


 |
市场调查报告书
商品编码
1740976
汽车 3D 地图系统市场机会、成长动力、产业趋势分析及 2025 - 2034 年预测Automotive 3D Map System Market Opportunity, Growth Drivers, Industry Trend Analysis, and Forecast 2025 - 2034 |
||||||
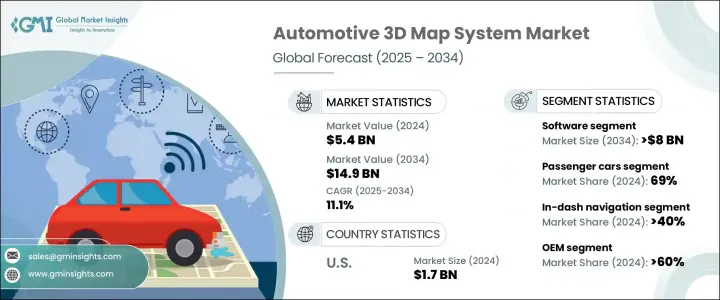
2024年,全球汽车3D地图系统市场规模达54亿美元,预计2034年将以11.1%的复合年增长率成长,达到149亿美元。这一增长主要得益于自动驾驶汽车技术的快速发展。随着汽车自动化程度的提高,3D地图正成为实现精确车道定位、即时障碍物侦测和智慧路线规划等高阶功能的关键推动因素。高清地图对于3至5级自动驾驶汽车至关重要,它能够提供超出车载感测器视线范围的环境资讯。如果没有这些详细的地图,自动驾驶系统将缺乏复杂决策所需的资料。随着业界转向更智慧的出行解决方案,製造商正在大力投资增强3D地图功能的技术。这些地图不仅能够提升安全性和性能,还能帮助打造更佳的车内体验。自动驾驶和先进驾驶辅助系统(ADAS)的研发持续加速3D地图的创新。随着消费者对即时、情境感知导航的需求不断增长,汽车製造商正在将 3D 地图系统打造为所有车型的标准配备。汽车製造商与数位地图开发商之间的合作日益频繁,旨在提供整合、品牌化的导航体验。
市场按组件细分为硬体、软体和服务。 2024 年,软体领域占据了整个产业的主导地位,约占整体市场份额的 50%,预计到 2034 年将超过 80 亿美元。人工智慧和云端运算的进步正在将地图软体转变为高度动态的平台,可以即时适应不断变化的交通状况、道路封闭和环境因素。汽车製造商现在青睐支援云端的地图系统,以改善预测路线规划和驾驶行为分析。随着驾驶者越来越追求个人化的数位体验,对可客製化地图软体的需求持续增长。汽车製造商正在部署支援独特用户配置、美学主题和数据丰富的迭加层的多功能平台,使地图软体成为资讯娱乐系统的关键差异化因素。
| 市场范围 | |
|---|---|
| 起始年份 | 2024 |
| 预测年份 | 2025-2034 |
| 起始值 | 54亿美元 |
| 预测值 | 149亿美元 |
| 复合年增长率 | 11.1% |
硬体在支援3D地图技术方面也发挥着至关重要的作用。配备光达、雷达和高清摄影机的车辆能够产生精确地图创建所需的详细空间资料。这些感测器对物体检测、深度估计和道路边界识别做出了重要贡献。随着感测器成本的下降,预计中阶车辆也将配备此类技术,推动未来十年硬体领域的成长。
按车型细分,市场包括乘用车、商用车和越野车。乘用车在2024年占据市场主导地位,占69%的市场。在日益密集和复杂的道路上行驶的驾驶员如今依赖3D地图来更清晰、更具互动性地了解周围环境。车道维持辅助和自适应巡航控制等功能在很大程度上依赖精准地图绘製,这促使汽车製造商将先进的地图系统融入更广泛的车型中。随着数位驾驶舱日益复杂,3D地图正成为提升整体驾驶体验的重要功能。
市场还根据导航显示格式进行划分:车载系统、平视显示器 (HUD) 和扩增实境 (AR) 导航。车载导航目前占据该领域的领先地位,市占率超过 40%。消费者正逐渐放弃售后 GPS 设备,转而青睐整合的原厂安装系统。这些车载显示器提供无缝的使用者体验、增强的可靠性并最大程度地减少驾驶分心。将车载地图与高解析度显示器和智慧迭加层配对,进一步提高了用户满意度。同时,HUD 技术作为一项安全前瞻性创新正在获得关注,它使驾驶员能够在接收即时路线和危险资料的同时专注于路况。 3D 地图与 AR 的整合将进一步加强基于 HUD 的系统,使其具有互动性和视觉直观性。
从销售通路来看,原始设备製造商 (OEM) 占据市场主导地位,2024 年的市占率将超过 60%。预计到 2034 年,该细分市场的复合年增长率将超过 11.5%。汽车製造商正在工厂层面将 3D 地图系统嵌入车辆,以确保与车载感测器的无缝集成,并满足与自动驾驶功能相关的监管要求。与售后市场替代方案相比,这些内建解决方案提供了更高的效能、系统可靠性和消费者信任度。即便如此,售后 3D 地图系统在寻求经济高效升级的老旧车主和车队营运商中仍持续受到青睐。这些系统提供可扩展、易于改造的解决方案,无需更换整个车队即可增强导航和 ADAS 功能。
从区域来看,北美在2024年引领全球市场,贡献了超过35%的总营收。仅美国就贡献了17亿美元的收入,这得益于自动驾驶汽车测试的不断进步、智慧基础设施计划以及消费者对安全功能日益增长的需求。由于完善的法律架构、科技产业的投资以及广泛的交通基础设施,美国已成为3D地图技术创新的中心枢纽。这些因素使得高清地图系统能够在各种驾驶条件下快速部署和即时测试。
该市场由全球技术提供商、地图软体开发商和本地化企业组成。一级供应商提供基于云端的平台、AI增强型感知工具以及根据OEM需求量身定制的车联网(V2X)整合功能。同时,区域性公司正在新兴市场迅速扩张,提供经济实惠、可扩展且适应性强的解决方案,以满足当地路况和消费者需求。
目录
第一章:方法论与范围
第二章:执行摘要
第三章:行业洞察
- 产业生态系统分析
- 供应商格局
- 零件供应商
- 技术提供者
- 软体供应商
- 经销商
- 最终用途
- 川普政府关税的影响
- 贸易影响
- 贸易量中断
- 报復措施
- 对产业的影响
- 供应方影响(原料)
- 主要材料价格波动
- 供应链重组
- 生产成本影响
- 需求面影响(客户成本)
- 价格传导至终端市场
- 市占率动态
- 消费者反应模式
- 供应方影响(原料)
- 受影响的主要公司
- 策略产业反应
- 供应链重组
- 定价和产品策略
- 政策参与
- 展望与未来考虑
- 贸易影响
- 利润率分析
- 技术与创新格局
- 专利分析
- 重要新闻和倡议
- 监管格局
- 用例
- 对部队的影响
- 成长动力
- 自动驾驶汽车对即时高精度地图的需求不断增长
- 政府法规推动ADAS和安全技术的应用
- 原始设备製造商将 3D 地图整合到工厂安装的资讯娱乐系统中
- 支援 V2X 通讯的智慧城市和互联基础设施的扩展
- 产业陷阱与挑战
- 即时高解析度地图的开发和维护成本高昂
- 与基于位置的服务相关的资料隐私和网路安全问题
- 成长动力
- 成长潜力分析
- 波特的分析
- PESTEL分析
第四章:竞争格局
- 介绍
- 公司市占率分析
- 竞争定位矩阵
- 战略展望矩阵
第五章:市场估计与预测:按组件,2021 - 2034 年
- 主要趋势
- 硬体
- 软体
- 服务
第六章:市场估计与预测:按导航,2021 - 2034 年
- 主要趋势
- 仪錶板导航
- 抬头显示器 (HUD)
- 扩增实境 (AR) 导航
第七章:市场估计与预测:依车型,2021 - 2034 年
- 主要趋势
- 搭乘用车
- 掀背车
- 轿车
- 越野车
- 商用车
- 轻型商用车(LCV)
- 中型商用车(MCV)
- 重型商用车(HCV)
- 越野车
第八章:市场估计与预测:按应用,2021 - 2034 年
- 主要趋势
- 高级驾驶辅助系统
- 自动驾驶
- 车载导航
- 车队和物流管理
- 其他的
第九章:市场估计与预测:依销售管道,2021 - 2034 年
- 主要趋势
- OEM
- 售后市场
第十章:市场估计与预测:按地区,2021 - 2034 年
- 主要趋势
- 北美洲
- 我们
- 加拿大
- 欧洲
- 英国
- 德国
- 法国
- 义大利
- 西班牙
- 俄罗斯
- 北欧人
- 亚太地区
- 中国
- 印度
- 日本
- 韩国
- 澳新银行
- 东南亚
- 拉丁美洲
- 巴西
- 墨西哥
- 阿根廷
- MEA
- 阿联酋
- 沙乌地阿拉伯
- 南非
第 11 章:公司简介
- 3D Mapping
- Carmera
- Civil Maps
- Deepmap
- Dynamic Map Platform
- Elektrobit
- Garmin
- HERE Technologies
- Inrix
- MapBox
- Microsoft
- Mitsubishi
- Mobileye
- NavInfo
- Nvidia
- Telenav
- TomTom
- Trimble
- Valeo
The Global Automotive 3D Map System Market was valued at USD 5.4 billion in 2024 and is estimated to grow at a CAGR of 11.1% to reach USD 14.9 billion by 2034. This growth is largely driven by the rapid expansion of autonomous vehicle technologies. As vehicles become increasingly automated, 3D maps are emerging as a critical enabler of advanced features such as precise lane localization, real-time obstacle detection, and intelligent route planning. High-definition mapping is essential for vehicles operating at Levels 3 to 5 autonomy, delivering an environmental context that goes beyond the line of sight of onboard sensors. Without these detailed maps, autonomous systems lack the necessary data for complex decision-making. As the industry pivots toward smarter mobility solutions, manufacturers are heavily investing in technologies that enhance the role of 3D maps. These maps not only boost safety and performance but also help create a better in-vehicle experience. Research and development in autonomous driving and advanced driver assistance systems (ADAS) continue to accelerate innovations in 3D mapping. With increasing consumer expectations for real-time, context-aware navigation, automakers are making 3D mapping systems a standard component across vehicle lineups. Collaborations between car manufacturers and digital map developers are becoming more common as they aim to deliver integrated and branded navigation experiences.
The market is segmented by component into hardware, software, and services. In 2024, the software segment dominated the industry with approximately 50% of the overall market share and is forecasted to surpass USD 8 billion by 2034. Advancements in artificial intelligence and cloud computing are transforming mapping software into highly dynamic platforms that adapt in real-time to changing traffic conditions, road closures, and environmental factors. Automakers are now favoring cloud-enabled mapping systems to improve predictive route planning and driving behavior analysis. As drivers increasingly seek personalized digital experiences, the demand for customizable map software continues to rise. Automakers are deploying versatile platforms that support unique user profiles, aesthetic themes, and data-rich overlays, making mapping software a key differentiator in infotainment systems.
| Market Scope | |
|---|---|
| Start Year | 2024 |
| Forecast Year | 2025-2034 |
| Start Value | $5.4 Billion |
| Forecast Value | $14.9 Billion |
| CAGR | 11.1% |
Hardware also plays a vital role in supporting 3D mapping technology. Vehicles equipped with LiDAR, radar, and HD cameras generate detailed spatial data essential for accurate map creation. These sensors contribute significantly to object detection, depth estimation, and road boundary recognition. As the cost of sensors drops, mid-range vehicles are also expected to feature such technologies, boosting the hardware segment's growth in the coming decade.
When segmented by vehicle type, the market includes passenger cars, commercial vehicles, and off-road vehicles. Passenger cars led the market in 2024, holding a 69% share. Drivers navigating increasingly dense and complex roadways are now relying on 3D maps for a clearer, more interactive understanding of their surroundings. Features like lane-keeping assistance and adaptive cruise control depend heavily on precision mapping, prompting automakers to incorporate advanced map systems into a wider range of car models. As digital cockpits become more sophisticated, 3D maps are turning into essential features that enhance the overall driving experience.
The market is also divided based on navigation display formats: in-dash systems, Heads-Up Displays (HUD), and Augmented Reality (AR) navigation. In-dash navigation currently leads the segment with over 40% market share. Consumers are gradually moving away from aftermarket GPS devices and favoring integrated, factory-installed systems. These in-dash displays offer seamless user experiences, enhanced reliability, and minimal driver distraction. Pairing in-dash maps with high-resolution displays and intelligent overlays further improves user satisfaction. Meanwhile, HUD technology is gaining traction as a safety-forward innovation, allowing drivers to keep their eyes on the road while receiving real-time route and hazard data. The integration of 3D mapping with AR will further strengthen HUD-based systems, making them interactive and visually intuitive.
From a sales channel perspective, OEMs dominate the market with a share exceeding 60% in 2024. This segment is projected to grow at over 11.5% CAGR through 2034. Automakers are embedding 3D map systems into vehicles at the factory level to ensure seamless integration with onboard sensors and to meet regulatory requirements associated with autonomous features. These built-in solutions offer better performance, system reliability, and consumer trust compared to aftermarket alternatives. That said, aftermarket 3D map systems continue to gain traction among owners of older vehicles and fleet operators looking for cost-effective upgrades. These systems offer scalable, retrofit-friendly solutions for enhancing navigation and ADAS capabilities without replacing entire vehicle fleets.
Regionally, North America led the global market in 2024, contributing over 35% of total revenue. The U.S. alone accounted for USD 1.7 billion, driven by growing advancements in autonomous vehicle testing, smart infrastructure initiatives, and increasing consumer demand for safety-oriented features. The country has become a central hub for innovation in 3D mapping technologies, thanks to a combination of legal frameworks, tech-sector investment, and an expansive transportation infrastructure. These factors enable the rapid deployment and real-time testing of high-definition mapping systems under a wide range of driving conditions.
The market features a mix of global tech providers, mapping software developers, and localized players. Tier 1 suppliers offer cloud-based platforms, AI-enhanced perception tools, and vehicle-to-everything (V2X) integration capabilities tailored to OEM needs. Meanwhile, regional firms are rapidly expanding in emerging markets, offering affordable, scalable, and adaptable solutions tailored to local road conditions and consumer needs.
Table of Contents
Chapter 1 Methodology & Scope
- 1.1 Research design
- 1.1.1 Research approach
- 1.1.2 Data collection methods
- 1.2 Base estimates and calculations
- 1.2.1 Base year calculation
- 1.2.2 Key trends for market estimates
- 1.3 Forecast model
- 1.4 Primary research & validation
- 1.4.1 Primary sources
- 1.4.2 Data mining sources
- 1.5 Market definitions
Chapter 2 Executive Summary
- 2.1 Industry 3600 synopsis, 2021 - 2034
Chapter 3 Industry Insights
- 3.1 Industry ecosystem analysis
- 3.2 Supplier landscape
- 3.2.1 Component supplier
- 3.2.2 Technology providers
- 3.2.3 Software providers
- 3.2.4 Distributors
- 3.2.5 End use
- 3.3 Impact of Trump administration tariffs
- 3.3.1 Trade impact
- 3.3.1.1 Trade volume disruptions
- 3.3.1.2 Retaliatory measures
- 3.3.2 Impact on industry
- 3.3.2.1 Supply-side impact (raw materials)
- 3.3.2.1.1 Price volatility in key materials
- 3.3.2.1.2 Supply chain restructuring
- 3.3.2.1.3 Production cost implications
- 3.3.2.2 Demand-side impact (Cost to customers)
- 3.3.2.2.1 Price transmission to end markets
- 3.3.2.2.2 Market share dynamics
- 3.3.2.2.3 Consumer response patterns
- 3.3.2.1 Supply-side impact (raw materials)
- 3.3.3 Key companies impacted
- 3.3.4 Strategic industry responses
- 3.3.4.1 Supply chain reconfiguration
- 3.3.4.2 Pricing and product strategies
- 3.3.4.3 Policy engagement
- 3.3.5 Outlook & future considerations
- 3.3.1 Trade impact
- 3.4 Profit margin analysis
- 3.5 Technology & innovation landscape
- 3.6 Patent analysis
- 3.7 Key news & initiatives
- 3.8 Regulatory landscape
- 3.9 Use cases
- 3.10 Impact on forces
- 3.10.1 Growth drivers
- 3.10.1.1 Rising demand for autonomous vehicles requiring real-time, high-precision maps
- 3.10.1.2 Government regulations pushing adoption of ADAS and safety technologies
- 3.10.1.3 Integration of 3D maps into factory-installed infotainment systems by OEMs
- 3.10.1.4 Expansion of smart cities and connected infrastructure supporting V2X communication
- 3.10.2 Industry pitfalls & challenges
- 3.10.2.1 High development and maintenance costs for real-time, high-resolution maps
- 3.10.2.2 Data privacy and cybersecurity concerns related to location-based services
- 3.10.1 Growth drivers
- 3.11 Growth potential analysis
- 3.12 Porter's analysis
- 3.13 PESTEL analysis
Chapter 4 Competitive Landscape, 2024
- 4.1 Introduction
- 4.2 Company market share analysis
- 4.3 Competitive positioning matrix
- 4.4 Strategic outlook matrix
Chapter 5 Market Estimates & Forecast, By Component, 2021 - 2034 ($Bn)
- 5.1 Key trends
- 5.2 Hardware
- 5.3 Software
- 5.4 Services
Chapter 6 Market Estimates & Forecast, By Navigation, 2021 - 2034 ($Bn)
- 6.1 Key trends
- 6.2 In-dash navigation
- 6.3 Heads-Up Display (HUD)
- 6.4 Augmented Reality (AR) navigation
Chapter 7 Market Estimates & Forecast, By Vehicle, 2021 - 2034 ($Bn)
- 7.1 Key trends
- 7.2 Passenger cars
- 7.2.1 Hatchback
- 7.2.2 Sedan
- 7.2.3 SUV
- 7.3 Commercial vehicles
- 7.3.1 Light Commercial Vehicles (LCV)
- 7.3.2 Medium Commercial Vehicles (MCV)
- 7.3.3 Heavy Commercial Vehicles (HCV)
- 7.4 Off-road vehicles
Chapter 8 Market Estimates & Forecast, By Application, 2021 - 2034 ($Bn)
- 8.1 Key trends
- 8.2 ADAS
- 8.3 Autonomous driving
- 8.4 In-vehicle navigation
- 8.5 Fleet and logistics management
- 8.6 Others
Chapter 9 Market Estimates & Forecast, By Sales Channel, 2021 - 2034 ($Bn)
- 9.1 Key trends
- 9.2 OEM
- 9.3 Aftermarket
Chapter 10 Market Estimates & Forecast, By Region, 2021 - 2034 ($Bn)
- 10.1 Key trends
- 10.2 North America
- 10.2.1 U.S.
- 10.2.2 Canada
- 10.3 Europe
- 10.3.1 UK
- 10.3.2 Germany
- 10.3.3 France
- 10.3.4 Italy
- 10.3.5 Spain
- 10.3.6 Russia
- 10.3.7 Nordics
- 10.4 Asia Pacific
- 10.4.1 China
- 10.4.2 India
- 10.4.3 Japan
- 10.4.4 South Korea
- 10.4.5 ANZ
- 10.4.6 Southeast Asia
- 10.5 Latin America
- 10.5.1 Brazil
- 10.5.2 Mexico
- 10.5.3 Argentina
- 10.6 MEA
- 10.6.1 UAE
- 10.6.2 Saudi Arabia
- 10.6.3 South Africa
Chapter 11 Company Profiles
- 11.1 3D Mapping
- 11.2 Carmera
- 11.3 Civil Maps
- 11.4 Deepmap
- 11.5 Dynamic Map Platform
- 11.6 Elektrobit
- 11.7 Garmin
- 11.8 Google
- 11.9 HERE Technologies
- 11.10 Inrix
- 11.11 MapBox
- 11.12 Microsoft
- 11.13 Mitsubishi
- 11.14 Mobileye
- 11.15 NavInfo
- 11.16 Nvidia
- 11.17 Telenav
- 11.18 TomTom
- 11.19 Trimble
- 11.20 Valeo
 以自动驾驶汽车为导向的高清地图(HD Maps)市场规模、份额和成长分析(按技术类型、应用程式、用例、最终用户、部署模式和地区划分)—2026-2033年产业预测
 2026-2034年全球汽车3D测绘系统市场规模、份额、趋势和成长分析报告
 高清地图(HD Maps)-全球市占率和排名、总收入和需求预测(2025-2031)自动驾驶高清地图:全球市场份额和排名、总收入和需求预测(2025-2031 年)
 汽车 3D 地图系统市场(按应用程式、组件、车辆类型、部署模式和最终用户)- 全球预测,2025 年至 2032 年面向自动驾驶汽车的高清地图市场:按应用程式、资料来源类型、服务类型、最终用户和车辆类型划分 - 全球预测,2025-2032 年
 全球自动驾驶高清地图市场(至 2032 年):按服务类型(地图绘製与本地化、更新与维护)、车辆类型(PC 与 CV)、解决方案类型(嵌入式与云端)、用途、自动化程度(L2、L3、L4、L5)和地区划分
 自动驾驶汽车高清地图市场:2032 年全球预测:按组件、解决方案类型、自动化程度、车辆、应用和地区划分
 自动驾驶用地图(HD/LD/SD地图,线上重组,即时生成地图)产业(2025年)
 车载 3D 地图系统的全球市场