


 |
市场调查报告书
商品编码
1750311
钙钛矿市场机会、成长动力、产业趋势分析及 2025 - 2034 年预测Perovskite Market Opportunity, Growth Drivers, Industry Trend Analysis, and Forecast 2025 - 2034 |
||||||
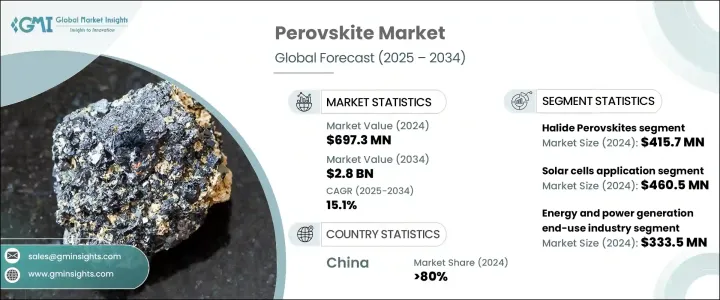
2024年,全球钙钛矿市场规模达6.973亿美元,预计年复合成长率将达15.1%,2034年将达28亿美元。这得归功于全球对永续能源和材料创新日益增长的关注,尤其是在清洁能源应用领域。随着能源基础设施不断调整以支援再生能源的整合,钙钛矿因其多功能性、轻量化特性以及与先进能源系统的兼容性而备受关注。这些材料在柔性高效薄膜配置中的出色性能,正在为太阳能、感测器和消费性电子产品领域开闢新的应用可能性。
持续的研发工作由公共和私营部门的倡议推动,这些倡议致力于加速能源转型,尤其是在美国,政府支持的可持续发展目标与光子学和半导体创新的投资相一致。人们对将硅与钙钛矿结合用于迭层太阳能电池的兴趣日益浓厚,这有望超越传统光伏电池的效率水平。其适应性也支持应用于便携式和可穿戴太阳能设备,满足住宅和商业市场的需求。薄膜电子技术的快速创新促成了创新装置设计,进一步提升了钙钛矿在面向未来技术的应用价值。
| 市场范围 | |
|---|---|
| 起始年份 | 2024 |
| 预测年份 | 2025-2034 |
| 起始值 | 6.973亿美元 |
| 预测值 | 28亿美元 |
| 复合年增长率 | 15.1% |
2024年,卤化物钙钛矿市场规模达4.157亿美元,预计2034年将以16.7%的复合年增长率成长。这些材料凭藉其卓越的光吸收能力,在太阳能和光电应用中表现出色。它们在串联太阳能配置中表现出色,持续吸引研究人员和商业开发者的注意。新兴太阳能材料领域资金的稳定成长显示全球对这些技术的信心十足。卤化物钙钛矿领域的创新预计将加速高效能太阳能和光子学解决方案的进展。
太阳能电池领域在2024年占据市场主导地位,规模达4.605亿美元,占66.1%,预计到2034年将以18%的复合年增长率成长。钙钛矿太阳能电池(尤其是在串联结构中)的能量转换效率不断提高,推动了其在全球太阳能产业的应用。由于製造成本降低和可扩展的製造方法,技术正越来越多地被整合到住宅和公用事业规模项目中的太阳能电池板中。这一趋势与全球向再生能源转型的趋势一致,预计太阳能将引领未来清洁能源投资。
2024年,中国钙钛矿市场占据了80%的市场份额,这得益于全球关键零件(例如晶圆、电池和组件)的产能集中在中国境内。这种广泛的控制不仅巩固了其作为太阳能技术主要出口国的地位,也增强了其对包括钙钛矿在内的新兴太阳能领域定价、可扩展性和创新速度的战略影响力。中国在研发方面的积极投入、国家补贴以及垂直整合的製造生态系统使其能够将下一代技术商业化。
该市场的顶尖公司包括 Frontier Materials、Swift Solar、Oxford PV、Saule Technologies 和 Microquanta Semiconductor。为了巩固市场地位,领先公司专注于扩大产能,透过材料创新提高效率,并与能源供应商和研究机构建立策略伙伴关係。许多公司投资试点生产线,测试大规模部署的可行性,同时透过专利保护其智慧财产权,以保持竞争优势。这些策略旨在满足全球需求并巩固长期市场地位。
目录
第一章:方法论与范围
第二章:执行摘要
第三章:行业洞察
- 产业生态系统分析
- 影响价值链的因素
- 利润率分析
- 中断
- 前景
- 製造商
- 经销商
- 川普政府关税
- 对贸易的影响
- 贸易量中断
- 报復措施
- 对产业的影响
- 供给侧影响(原料)
- 主要材料价格波动
- 供应链重组
- 生产成本影响
- 需求面影响(售价)
- 价格传导至终端市场
- 市占率动态
- 消费者反应模式
- 供给侧影响(原料)
- 受影响的主要公司
- 策略产业反应
- 供应链重组
- 定价和产品策略
- 政策参与
- 展望与未来考虑
- 对贸易的影响
- 贸易统计资料(HS 编码) 註:以上贸易统计仅提供主要国家。
- 主要出口国
- 主要进口国
- 利润率分析
- 重要新闻和倡议
- 监管格局
- 衝击力
- 成长动力
- 全球能源需求成长推动下一代光电应用
- 政府对清洁和分散能源系统的优惠奖励措施
- 钙钛矿太阳能技术的卓越效率与成本优势
- 增加发展中和偏远地区的离网电气化项目
- 产业陷阱与挑战
- 钙钛矿材料在恶劣环境下的稳定性与耐久性问题
- 缺乏成熟的大规模製造和商业化基础设施
- 成长动力
- 成长潜力分析
- 波特的分析
- PESTEL分析
第四章:竞争格局
- 竞争格局
- 公司概况
- 产品组合和规格
- SWOT分析
- 公司市占率分析
- 各公司全球市场占有率
- 区域市占率分析
- 产品组合份额分析
- 策略倡议
- 併购
- 伙伴关係和合作
- 产品发布和创新
- 扩张计划和投资
- 公司标竿分析
- 产品创新标竿分析
- 定价策略比较
- 配电网路比较
- 客户服务和支援比较
第五章:市场估计与预测:依材料类型,2021-2034
- 主要趋势
- 卤化物钙钛矿
- 有机-无机杂化卤化物钙钛矿
- 全无机卤化物钙钛矿
- 铅基卤化物钙钛矿
- 无铅卤化物钙钛矿
- 氧化物钙钛矿
- 钛酸盐基氧化物钙钛矿
- 铁电氧化物钙钛矿
- 其他氧化物钙钛矿
- 其他钙钛矿材料
- 双钙钛矿
- 层状钙钛矿
- 钙钛矿启发材料
第六章:市场估计与预测:按应用,2021-2034
- 主要趋势
- 太阳能电池
- 单结钙钛矿太阳能电池
- 串联钙钛矿-硅太阳能电池
- 柔性钙钛矿太阳能电池
- 建筑一体化光伏(bipv)
- 空间应用
- 发光二极体(LED)
- 显示技术
- 照明应用
- 光电探测器和感测器
- X射线侦测器
- 光电探测器
- 气体感测器
- 压力感测器
- 雷射和光学应用
- 储能设备
- 量子计算应用
- 其他应用
- 催化
- 热电器件
- 神经形态计算
第七章:市场估计与预测:按最终用途产业,2021-2034 年
- 主要趋势
- 能源和发电
- 电子与光电子
- 建筑和建筑材料
- 汽车和运输
- 航太和国防
- 医疗保健和医疗器械
- 电信
- 其他的
第八章:市场估计与预测:按地区,2021-2034
- 主要趋势
- 北美洲
- 我们
- 加拿大
- 欧洲
- 德国
- 英国
- 法国
- 西班牙
- 义大利
- 欧洲其他地区
- 亚太地区
- 中国
- 印度
- 日本
- 澳洲
- 韩国
- 亚太其他地区
- 拉丁美洲
- 巴西
- 墨西哥
- 阿根廷
- 拉丁美洲其他地区
- 中东和非洲
- 沙乌地阿拉伯
- 南非
- 阿联酋
- 中东和非洲其他地区
第九章:公司简介
- Oxford PV
- Saule Technologies
- Microquanta Semiconductor
- Swift Solar
- Frontier Materials
- Toshiba
- Panasonic
- Sekisui Chemical
- Hanwha Vision
- GCL Suzhou Nanotechnology
- EneCoat Technologies
- Kaneka Corporation
- Aisin Corporation
- UtmoLight
- Wonder Solar
- Other Notable Players
The Global Perovskite Market was valued at USD 697.3 million in 2024 and is estimated to grow at a CAGR of 15.1% to reach USD 2.8 billion by 2034, driven by the rising global attention toward sustainable energy and material innovation in the spotlight, especially in clean energy applications. As energy infrastructures adapt to support renewable integration, perovskites are gaining traction due to their versatility, lightweight properties, and compatibility with advanced energy systems. These materials are unlocking new possibilities in solar power, sensors, and consumer electronics thanks to their strong performance in flexible and efficient thin-film configurations.
Ongoing R&D is driven by public and private initiatives focused on accelerating energy transformation, particularly in the United States, where government-backed sustainability targets align with investments in photonics and semiconductor innovation. Interest is growing in combining silicon with perovskite for tandem solar cell use, offering potential to exceed the efficiency levels of traditional photovoltaics. Their adaptability also supports applications in portable and wearable solar devices, addressing demand from residential and commercial markets. Rapid innovation in thin-film electronics enables creative device designs, further increasing the relevance of perovskites in future-facing technologies.
| Market Scope | |
|---|---|
| Start Year | 2024 |
| Forecast Year | 2025-2034 |
| Start Value | $697.3 Million |
| Forecast Value | $2.8 Billion |
| CAGR | 15.1% |
In 2024, halide perovskites generated USD 415.7 million and are expected to grow at a CAGR of 16.7% through 2034. These materials are proving especially effective in solar and optoelectronic applications because of their exceptional light absorption capabilities. Their ability to perform well in tandem solar configurations continues to draw attention from researchers and commercial developers. A steady increase in funding for emerging solar materials indicates robust global confidence in these technologies. Innovations involving halide perovskites are expected to accelerate progress in high-efficiency solar and photonics solutions.
The solar cell segment dominated the market with USD 460.5 million in 2024, holding a 66.1% share and anticipated to grow at 18% CAGR through 2034. The improved energy conversion efficiency of perovskite solar cells, especially in tandem configurations, propels their use in the global solar industry. Technology is increasingly being integrated into solar panels used in both residential and utility-scale projects due to reduced manufacturing costs and scalable fabrication methods. This trend aligns with the global transition toward renewable energy, with solar projected to lead future clean energy investments.
China Perovskite Market held 80% share in 2024, driven by the world's manufacturing capacity for critical components, such as wafers, cells, and modules, concentrated within its borders. This extensive control not only strengthens its position as the primary exporter of solar technologies but also reinforces its strategic influence over the pricing, scalability, and innovation pace across emerging solar segments, including perovskites. China's aggressive investments in R&D, state-backed subsidies, and vertically integrated manufacturing ecosystems enable it to commercialize next-generation technologies.
Top companies in this market include Frontier Materials, Swift Solar, Oxford PV, Saule Technologies, and Microquanta Semiconductor. To secure their positions, leading companies focus on scaling production capabilities, enhancing efficiency through material innovation, and forming strategic partnerships with energy providers and research institutions. Many invest in pilot production lines to test large-scale deployment viability while protecting their IP through patents to maintain a competitive advantage. These strategies are designed to meet global demand and reinforce long-term market presence.
Table of Contents
Chapter 1 Methodology & Scope
- 1.1 Market scope & definitions
- 1.2 Base estimates & calculations
- 1.3 Forecast calculations
- 1.4 Data sources
- 1.4.1 Primary
- 1.4.2 Secondary
- 1.4.2.1 Paid sources
- 1.4.2.2 Public sources
Chapter 2 Executive Summary
- 2.1 Industry synopsis, 2021-2034
Chapter 3 Industry Insights
- 3.1 Industry ecosystem analysis
- 3.1.1 Factor affecting the value chain
- 3.1.2 Profit margin analysis
- 3.1.3 Disruptions
- 3.1.4 Outlook
- 3.1.5 Manufacturers
- 3.1.6 Distributors
- 3.2 Trump administration tariffs
- 3.2.1 Impact on trade
- 3.2.1.1 Trade volume disruptions
- 3.2.1.2 Retaliatory measures
- 3.2.2 Impact on the industry
- 3.2.2.1 Supply-side impact (raw materials)
- 3.2.2.1.1 Price volatility in key materials
- 3.2.2.1.2 Supply chain restructuring
- 3.2.2.1.3 Production cost implications
- 3.2.2.2 Demand-side impact (selling price)
- 3.2.2.2.1 Price transmission to end markets
- 3.2.2.2.2 Market share dynamics
- 3.2.2.2.3 Consumer response patterns
- 3.2.2.1 Supply-side impact (raw materials)
- 3.2.3 Key companies impacted
- 3.2.4 Strategic industry responses
- 3.2.4.1 Supply chain reconfiguration
- 3.2.4.2 Pricing and product strategies
- 3.2.4.3 Policy engagement
- 3.2.5 Outlook and Future Considerations
- 3.2.1 Impact on trade
- 3.3 Trade statistics (HS Code) Note: the above trade statistics will be provided for key countries only.
- 3.3.1 Major exporting countries
- 3.3.2 Major importing countries
- 3.4 Profit margin analysis
- 3.5 Key news & initiatives
- 3.6 Regulatory landscape
- 3.7 Impact forces
- 3.7.1 Growth drivers
- 3.7.1.1 Rising global energy demand driving next-generation photovoltaic adoption
- 3.7.1.2 Favorable government incentives for clean and decentralized energy systems
- 3.7.1.3 Superior efficiency and cost advantages of perovskite-based solar technologies
- 3.7.1.4 Increasing off-grid electrification projects in developing and remote regions
- 3.7.2 Industry pitfalls & challenges
- 3.7.2.1 Stability and durability concerns of perovskite materials in harsh environments
- 3.7.2.2 Lack of established large-scale manufacturing and commercialization infrastructure
- 3.7.1 Growth drivers
- 3.8 Growth potential analysis
- 3.9 Porter's analysis
- 3.10 PESTEL analysis
Chapter 4 Competitive Landscape, 2024
- 4.1 Competitive landscape
- 4.1.1 Company overview
- 4.1.2 Product portfolio and specifications
- 4.1.3 Swot analysis
- 4.2 Company market share analysis, 2024
- 4.2.1 Global market share by company
- 4.2.2 Regional market share analysis
- 4.2.3 Product portfolio share analysis
- 4.3 Strategic initiative
- 4.3.1 Mergers and acquisitions
- 4.3.2 Partnerships and collaborations
- 4.3.3 Product launches and innovations
- 4.3.4 Expansion plans and investments
- 4.4 Company benchmarking
- 4.4.1 Product innovation benchmarking
- 4.4.2 Pricing strategy comparison
- 4.4.3 Distribution network comparison
- 4.4.4 Customer service and support comparison
Chapter 5 Market Estimates & Forecast, By Material Type, 2021-2034 (USD Million) (Kilo Tons)
- 5.1 Key trends
- 5.2 Halide perovskites
- 5.2.1 Organic-inorganic hybrid halide perovskites
- 5.2.2 All-inorganic halide perovskites
- 5.2.3 Lead-based halide perovskites
- 5.2.4 Lead-free halide perovskites
- 5.3 Oxide perovskites
- 5.3.1 Titanate-based oxide perovskites
- 5.3.2 Ferroelectric oxide perovskites
- 5.3.3 Other oxide perovskites
- 5.4 Other perovskite materials
- 5.4.1 Double perovskites
- 5.4.2 Layered perovskites
- 5.4.3 Perovskite-inspired materials
Chapter 6 Market Estimates & Forecast, By Application, 2021-2034 (USD Million) (Kilo Tons)
- 6.1 Key trends
- 6.2 Solar cells
- 6.2.1 Single-junction perovskite solar cells
- 6.2.2 Tandem perovskite-silicon solar cells
- 6.2.3 Flexible perovskite solar cells
- 6.2.4 Building-integrated photovoltaics (bipv)
- 6.2.5 Space applications
- 6.3 Light-emitting diodes (leds)
- 6.3.1 Display technologies
- 6.3.2 Lighting applications
- 6.4 Photodetectors and sensors
- 6.4.1 X-ray detectors
- 6.4.2 Photodetectors
- 6.4.3 Gas sensors
- 6.4.4 Pressure sensors
- 6.5 Lasers and optical applications
- 6.6 Energy storage devices
- 6.7 Quantum computing applications
- 6.8 Other applications
- 6.8.1 Catalysis
- 6.8.2 Thermoelectric devices
- 6.8.3 Neuromorphic computing
Chapter 7 Market Estimates & Forecast, By End Use Industry, 2021-2034 (USD Million) (Kilo Tons)
- 7.1 Key trends
- 7.2 Energy and power generation
- 7.3 Electronics and optoelectronics
- 7.4 Construction and building materials
- 7.5 Automotive and transportation
- 7.6 Aerospace and defense
- 7.7 Healthcare and medical devices
- 7.8 Telecommunications
- 7.9 Others
Chapter 8 Market Estimates & Forecast, By Region, 2021-2034 (USD Million) (Kilo Tons)
- 8.1 Key trends
- 8.2 North America
- 8.2.1 U.S.
- 8.2.2 Canada
- 8.3 Europe
- 8.3.1 Germany
- 8.3.2 UK
- 8.3.3 France
- 8.3.4 Spain
- 8.3.5 Italy
- 8.3.6 Rest of Europe
- 8.4 Asia Pacific
- 8.4.1 China
- 8.4.2 India
- 8.4.3 Japan
- 8.4.4 Australia
- 8.4.5 South Korea
- 8.4.6 Rest of Asia Pacific
- 8.5 Latin America
- 8.5.1 Brazil
- 8.5.2 Mexico
- 8.5.3 Argentina
- 8.5.4 Rest of Latin America
- 8.6 Middle East and Africa
- 8.6.1 Saudi Arabia
- 8.6.2 South Africa
- 8.6.3 UAE
- 8.6.4 Rest of Middle East and Africa
Chapter 9 Company Profiles
- 9.1 Oxford PV
- 9.2 Saule Technologies
- 9.3 Microquanta Semiconductor
- 9.4 Swift Solar
- 9.5 Frontier Materials
- 9.6 Toshiba
- 9.7 Panasonic
- 9.8 Sekisui Chemical
- 9.9 Hanwha Vision
- 9.10 GCL Suzhou Nanotechnology
- 9.11 EneCoat Technologies
- 9.12 Kaneka Corporation
- 9.13 Aisin Corporation
- 9.14 UtmoLight
- 9.15 Wonder Solar
- 9.16 Other Notable Players
 2026年钙钛矿太阳能电池全球市场报告
 钙钛矿太阳能电池全球市场规模、份额、趋势和成长分析报告(2026-2034)
 全球钙钛矿太阳能电池市场:依产品类型、组件类型、结构、应用和地区划分-市场规模、产业动态、机会分析和预测(2026-2035 年)
 钙钛矿太阳能电池市场-全球产业规模、份额、趋势、机会和预测,按结构、产品、方法、应用、最终用途、地区和竞争格局划分,2020-2030年预测
 钙钛矿太阳能电池市场机会、成长驱动因素、产业趋势分析及预测(2025-2034年)
 2032 年钙钛矿太阳能电池市场预测:按类型、基板材料、层类型、技术、应用、最终用户和地区分類的全球分析2032 年钙钛矿材料市场预测:按类型、成分、应用、最终用户和地区进行的全球分析
 钙钛矿太阳能电池的全球市场
 钙钛矿太阳能电池市场规模、份额、趋势分析报告:按产品、应用、产业、地区和细分市场预测,2025 年至 2030 年
 钙钛矿材料·技术的全球市场(2025年~2035年)