


 |
市场调查报告书
商品编码
1750579
赤藻醣醇市场机会、成长动力、产业趋势分析及 2025 - 2034 年预测Erythritol Market Opportunity, Growth Drivers, Industry Trend Analysis, and Forecast 2025 - 2034 |
||||||
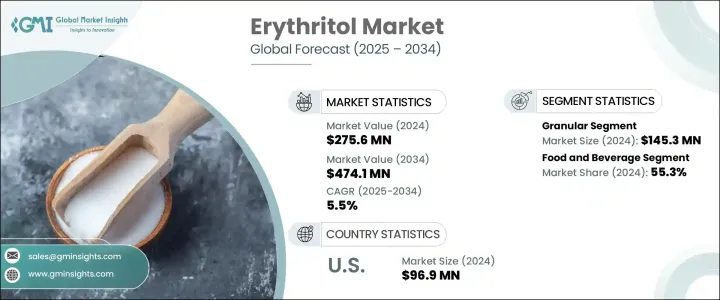
2024年,全球赤藻醣醇市场规模达2.756亿美元,预计到2034年将以5.5%的复合年增长率增长,达到4.741亿美元,这主要得益于消费者健康意识的提升以及对低卡路里和无糖产品的需求。随着越来越多的人追求更健康的生活方式,赤藻醣醇作为烘焙食品、糖果和饮料等食品和饮料中的糖替代品越来越受欢迎。这一趋势在欧洲和北美尤为明显,这些地区向糖替代品的转变刺激了市场的大幅扩张。此外,亚太和拉丁美洲新兴市场对赤藻醣醇的日益接受也进一步支持了其持续成长。随着这些地区经济的成长和消费者健康意识的提升,赤藻醣醇的市场渗透率预计将持续成长。
天然和植物性食品原料的兴起,正契合人们对更健康、更永续食品日益增长的需求,推动了市场发展。赤藻醣醇作为一种植物来源的糖醇,完美契合了这一趋势,并受到寻求传统醣类替代品的消费者的青睐。市场的整体成长反映了全球对健康生活方式的追求,推动了对赤藻醣醇等醣类替代品的持续需求。
| 市场范围 | |
|---|---|
| 起始年份 | 2024 |
| 预测年份 | 2025-2034 |
| 起始值 | 2.756亿美元 |
| 预测值 | 4.741亿美元 |
| 复合年增长率 | 5.5% |
2024年,赤藻醣醇颗粒市场规模达1.453亿美元,预计2025年至2034年期间的复合年增长率为5.6%,这得益于其易用性以及在各种应用领域的多功能性,尤其是在食品和饮料製造领域。赤藻醣醇的质地和甜度与糖非常相似,是烘焙食品、饮料和糖果的理想选择。此外,赤藻醣醇易于计量和在配方中混合,也使其在住宅和商业环境中广泛应用。颗粒状赤藻醣醇尤其受欢迎,因为它能够提供类似糖的口感,且不增加卡路里,为消费者提供了更健康的选择。
食品饮料业,2024年市场规模达1.524亿美元,预计2034年复合年增长率将达5.7%。消费者对更健康、低热量和无糖产品的偏好日益增长,推动了该行业对赤藻醣醇的需求。赤藻醣醇的低升糖指数,加上其在烘焙过程中耐高温的特性,使其成为製作各种食品(从饼干到蛋糕和糕点)的理想选择。
2024年,美国赤藻醣醇市场规模达9,690万美元,预估至2034年复合年增长率为5.5%。受低碳水化合物和生酮饮食的流行推动,东北部和西部等地区对赤藻醣醇的需求强劲。随着人们日益意识到醣类消费带来的健康风险,赤藻醣醇在加工食品、饮料和点心中的使用量不断增加,从而推动了市场的成长。
全球赤藻醣醇市场的主要参与者包括Foodchem International Corporation、泰莱公司、嘉吉公司、瑞士荣本茨劳尔公司和山东三元生物科技股份有限公司。各公司正透过专注于产品创新、拓展分销管道以及投资开发可持续生产方法来巩固其市场地位,以满足日益增长的天然甜味剂需求。为了提升其在赤藻醣醇市场的份额,各公司正在采取多项关键策略。这些策略包括专注于生产流程的技术进步以提高效率并降低成本,以及扩展产品组合以提供更广泛的糖替代品。此外,领先的製造商正在与食品和饮料行业的主要参与者建立策略合作伙伴关係,以扩大市场准入并触及新的消费群体。
目录
第一章:方法论与范围
第二章:执行摘要
第三章:行业洞察
- 产业生态系统分析
- 影响价值链的因素
- 利润率分析
- 中断
- 未来展望
- 製造商
- 经销商
- 川普政府关税
- 对贸易的影响
- 贸易量中断
- 报復措施
- 对产业的影响
- 供应方影响(原料)
- 主要材料价格波动
- 供应链重组
- 生产成本影响
- 供应方影响(原料)
- 需求面影响(售价)
- 价格传导至终端市场
- 市占率动态
- 消费者反应模式
- 受影响的主要公司
- 策略产业反应
- 供应链重组
- 定价和产品策略
- 政策参与
- 展望与未来考虑
- 对贸易的影响
- 贸易统计(HS编码)
- 2021-2024年主要出口国
- 2021-2024年主要进口国
註:以上贸易统计仅针对重点国家。
- 供应商格局
- 利润率分析
- 重要新闻和倡议
- 监管格局
- FDA 法规和 GRAS 状态
- 欧洲食品安全局(EFSA)指南
- 亚太监管环境
- 国际标准和认证
- 衝击力
- 成长动力
- 对低热量和无糖食品的需求不断增加
- 消费者健康意识不断增强
- 植物性和天然食品成分趋势的成长
- 生酮饮食和低碳水化合物饮食的流行
- 产业陷阱与挑战
- 与其他甜味剂相比,生产成本较高
- 新兴市场消费者意识有限
- 成长动力
- 交易分析
- 进出口场景
- 关税和非关税壁垒
- 反倾销措施和贸易争端
- 自由贸易协定的影响
- 技术格局
- 现有的生产技术
- 发酵製程创新
- 纯化和结晶技术
- 新兴技术与专利
- 定价分析
- 价格趋势(2021-2024年)
- 成本结构分析
- 定价策略评估
- 区域价格差异
- 价值链分析
- 原物料采购和供应商
- 製造和加工
- 分销管道
- 最终用途应用
- 产业影响分析
- Covid-19影响评估
- 俄乌战争的影响
- 经济衰退因素
- 供应链中断
- 成长潜力分析
- 波特的分析
- PESTEL分析
第四章:竞争格局
- 介绍
- 公司市占率分析
- 全球市占率分布
- 区域市占率分析
- 关键参与者的层级分析
- 竞争基准测试
- 产品组合比较
- 生产能力评估
- 定价策略比较
- 分销网络实力
- 研发能力与创新
- 策略倡议
- 併购
- 合资企业和合作伙伴关係
- 产能扩张
- 新产品发布
- 技术合作
- 竞争定位矩阵
- 市场领导者
- 新兴企业
- 创新者
- 利基市场参与者
- 战略仪表板
- Growth strategies
- Market penetration approaches
- Diversification tactics
- Sustainability initiatives
第五章:市场估计与预测:依形式,2021-2034
- 主要趋势
- 粉末
- 颗粒状
- 液体
第六章:市场估计与预测:依纯度等级,2021-2034
- 主要趋势
- 高纯度(≥99%)
- 标准纯度(95-98%)
- 其他的
第七章:市场估计与预测:按应用,2021-2034
- 主要趋势
- 食品和饮料
- 烘焙和糖果
- 饮料
- 乳製品
- 冷冻甜点
- 其他的
- 製药
- 片剂和胶囊
- 糖浆和混悬液
- 其他的
- 个人护理和化妆品
- 口腔护理产品
- 保养产品
- 其他的
- 其他的
- 农业应用
- 工业用途
第八章:市场估计与预测:按地区,2021-2034
- 主要趋势
- 北美洲
- 我们
- 加拿大
- 墨西哥
- 欧洲
- 英国
- 德国
- 法国
- 义大利
- 西班牙
- 俄罗斯
- 亚太地区
- 中国
- 印度
- 日本
- 韩国
- 澳洲
- 拉丁美洲
- 巴西
- 阿根廷
- MEA
- 南非
- 沙乌地阿拉伯
- 阿联酋
第九章:公司简介
- Baolingbao Biology Co., Ltd.
- Cargill, Inc.
- Changzhou Niutang Chemical Plant Co., Ltd.
- Foodchem International Corporation
- Futaste Co., Ltd.
- Ingredion Incorporated
- Jungbunzlauer Suisse AG
- Mitsubishi Chemical Group Corporation
- Nikken Chemical Co., Ltd.
- RAJVI ENTERPRISE
- Shandong Sanyuan Biotechnology Co., Ltd.
- Tate & Lyle PLC
- Xiwang Group
- Zibo ZhongShi GeRui Biotech Co., Ltd.
The Global Erythritol Market was valued at USD 275.6 million in 2024 and is estimated to grow at a CAGR of 5.5% to reach USD 474.1 million by 2034, driven by the health awareness among consumers and the demand for low-calorie and sugar-free products. As more individuals turn to healthier lifestyles, erythritol has gained popularity as a sugar substitute in foods and beverages such as baked goods, confectionery, and beverages. This trend is especially notable in Europe and North America, where the shift toward sugar alternatives has spurred significant market expansion. In addition, the increasing adoption of erythritol in emerging markets across Asia-Pacific and Latin America further supports its continued growth. As these regions grow economically and health-conscious consumer habits evolve, erythritol's market penetration is expected to increase consistently.
The market benefits from the rise in natural and plant-based food ingredients, which align with the growing demand for healthier and more sustainable options. Erythritol, as a plant-derived sugar alcohol, fits seamlessly into this trend, gaining favor with consumers seeking alternatives to traditional sugars. The overall growth of the market reflects the global push toward healthier living, driving sustained demand for sugar substitutes like erythritol.
| Market Scope | |
|---|---|
| Start Year | 2024 |
| Forecast Year | 2025-2034 |
| Start Value | $275.6 Million |
| Forecast Value | $474.1 Million |
| CAGR | 5.5% |
In 2024, the granular segment of the erythritol market was valued at USD 145.3 million and is projected to grow at a CAGR of 5.6% from 2025 to 2034 due to its ease of use and versatility in various applications, especially in food and beverage manufacturing. It closely resembles sugar in both texture and sweetness, making it ideal for baked goods, beverages, and confectionery. Its ability to be measured and mixed easily in recipes also contributes to its widespread adoption in residential and commercial settings. The granular form is particularly favored for its ability to deliver a sugar-like taste without the added calories, offering a healthier alternative for consumers.
The food & beverage sector, which accounted for USD 152.4 million in 2024 and is expected to grow at a CAGR of 5.7% through 2034. The demand for erythritol in this sector is driven by increasing consumer preference for healthier, low-calorie, and sugar-free products. Erythritol's low glycemic index, along with its ability to withstand high heat during baking, makes it an ideal choice for creating a wide range of food products, from cookies to cakes and pastries.
United States Erythritol Market was valued at USD 96.9 million in 2024, with a projected growth rate of 5.5% CAGR through 2034. The demand is strong in regions like the Northeast and West, driven by the popularity of low-carb and ketogenic diets. The growing awareness of the health risks associated with sugar consumption has led to increased use of erythritol in processed foods, beverages, and snacks, fueling market growth.
Key players in the Global Erythritol Market include Foodchem International Corporation, Tate & Lyle, Cargill, Jungbunzlauer Suisse AG, and Shandong Sanyuan Biotechnology. Companies are strengthening their positions by focusing on product innovation, expanding distribution channels, and investing in developing sustainable production methods to cater to the growing demand for natural sweeteners. To enhance their presence in the erythritol market, companies are adopting several key strategies. These include focusing on technological advancements in production processes to improve efficiency and reduce costs, as well as expanding their product portfolios to offer a wider range of sugar alternatives. Additionally, leading manufacturers are forming strategic partnerships with key players in the food and beverage sector to enhance market access and reach new consumer segments.
Table of Contents
Chapter 1 Methodology & Scope
- 1.1 Research methodology
- 1.2 Research approach & data sources
- 1.2.1 Primary research
- 1.2.2 Secondary research
- 1.2.3 Market size estimation techniques
- 1.2.4 Forecasting methodology
- 1.3 Research scope & assumptions
- 1.4 Market definition & segmentation
- 1.5 Limitations & challenges
- 1.6 Data validation & triangulation approach
Chapter 2 Executive Summary
- 2.1 Market overview & key findings
- 2.2 Market dynamics summary
- 2.3 Regional market highlights
- 2.4 Segmental performance overview
- 2.5 Competitive landscape snapshot
- 2.6 Future market outlook
- 2.7 Investment feasibility matrix
Chapter 3 Industry Insights
- 3.1 Industry ecosystem analysis
- 3.1.1 Factor affecting the value chain
- 3.1.2 Profit margin analysis
- 3.1.3 Disruptions
- 3.1.4 Future outlook
- 3.1.5 Manufacturers
- 3.1.6 Distributors
- 3.2 Trump administration tariffs
- 3.2.1 Impact on trade
- 3.2.1.1 Trade volume disruptions
- 3.2.1.2 Retaliatory measures
- 3.2.2 Impact on the industry
- 3.2.2.1 Supply-side impact (raw materials)
- 3.2.2.1.1 Price volatility in key materials
- 3.2.2.1.2 Supply chain restructuring
- 3.2.2.1.3 Production cost implications
- 3.2.2.1 Supply-side impact (raw materials)
- 3.2.3 Demand-side impact (selling price)
- 3.2.3.1 Price transmission to end markets
- 3.2.3.2 Market share dynamics
- 3.2.3.3 Consumer response patterns
- 3.2.4 Key companies impacted
- 3.2.5 Strategic industry responses
- 3.2.5.1 Supply chain reconfiguration
- 3.2.5.2 Pricing and product strategies
- 3.2.5.3 Policy engagement
- 3.2.6 Outlook and future considerations
- 3.2.1 Impact on trade
- 3.3 Trade statistics (HS code)
- 3.3.1 Major exporting countries, 2021-2024
- 3.3.2 Major importing countries, 2021-2024
- 3.4 Supplier landscape
- 3.5 Profit margin analysis
- 3.6 Key news & initiatives
- 3.7 Regulatory landscape
- 3.7.1 FDA regulations & GRAS status
- 3.7.2 European food safety authority (EFSA) guidelines
- 3.7.3 Asia-Pacific regulatory environment
- 3.7.4 International standards & certifications
- 3.8 Impact forces
- 3.8.1 Growth drivers
- 3.8.1.1 Increasing demand for low-calorie and sugar-free food products
- 3.8.1.2 Rising health consciousness among consumers
- 3.8.1.3 Growth of plant-based and natural food ingredient trends
- 3.8.1.4 Popularity of ketogenic and low-carb diets
- 3.8.2 Industry pitfalls & challenges
- 3.8.2.1 High production costs compared to other sweeteners
- 3.8.2.2 Limited consumer awareness in emerging markets
- 3.8.1 Growth drivers
- 3.9 Trade analysis
- 3.9.1 Import-export scenario
- 3.9.2 Tariff & non-tariff barriers
- 3.9.3 Anti-dumping measures & trade disputes
- 3.9.4 Free trade agreements impact
- 3.10 Technology landscape
- 3.10.1 Current production technologies
- 3.10.2 Fermentation process innovations
- 3.10.3 Purification & crystallization techniques
- 3.10.4 Emerging technologies & patents
- 3.11 Pricing Analysis
- 3.11.1 Price trends 2021-2024
- 3.11.2 Cost structure analysis
- 3.11.3 Pricing strategy assessment
- 3.11.4 Regional price variations
- 3.12 Value chain analysis
- 3.12.1 Raw material sourcing & suppliers
- 3.12.2 Manufacturing & processing
- 3.12.3 Distribution channels
- 3.12.4 End use applications
- 3.13 Industry impact analysis
- 3.13.1 Covid-19 impact assessment
- 3.13.2 Russia-Ukraine war implications
- 3.13.3 Economic recession factors
- 3.13.4 Supply chain disruptions
- 3.14 Growth potential analysis
- 3.15 Porter's analysis
- 3.16 PESTEL analysis
- 3.16.1 Political factors
- 3.16.2 Economic influences
- 3.16.3 Social trends
- 3.16.4 Technological innovations
- 3.16.5 Legal & regulatory framework
- 3.16.6 Environmental considerations
Chapter 4 Competitive Landscape, 2024
- 4.1 Introduction
- 4.2 Company market share analysis
- 4.2.1 Global market share distribution
- 4.2.2 Regional market share analysis
- 4.2.3 Tier analysis of key players
- 4.3 Competitive benchmarking
- 4.3.1 Product portfolio comparison
- 4.3.2 Production capacity assessment
- 4.3.3 Pricing strategy comparison
- 4.3.4 Distribution network strength
- 4.3.5 R&D capabilities & innovation
- 4.4 Strategic initiatives
- 4.4.1 Mergers & acquisitions
- 4.4.2 Joint ventures & partnerships
- 4.4.3 Capacity expansions
- 4.4.4 New product launches
- 4.4.5 Technological collaborations
- 4.5 Competitive positioning matrix
- 4.5.1 Market leaders
- 4.5.2 Emerging players
- 4.5.3 Innovators
- 4.5.4 Niche players
- 4.6 Strategic dashboard
Chapter 5 Market Estimates & Forecast, By Form, 2021-2034 (USD Billion) (Kilo Tons)
- 5.1 Key trends
- 5.2 Powder
- 5.3 Granular
- 5.4 Liquid
Chapter 6 Market Estimates & Forecast, By Purity Level, 2021-2034 (USD Billion) (Kilo Tons)
- 6.1 Key trends
- 6.2 High purity (=>99%)
- 6.3 Standard purity (95-98%)
- 6.4 Others
Chapter 7 Market Estimates & Forecast, By Application, 2021-2034 (USD Billion) (Kilo Tons)
- 7.1 Key trends
- 7.2 Food and beverages
- 7.2.1 Bakery & confectionery
- 7.2.2 Beverages
- 7.2.3 Dairy products
- 7.2.4 Frozen desserts
- 7.2.5 Others
- 7.3 Pharmaceutical
- 7.3.1 Tablets & capsules
- 7.3.2 Syrups & suspensions
- 7.3.3 Others
- 7.4 Personal care and cosmetics
- 7.4.1 Oral care products
- 7.4.2 Skin care products
- 7.4.3 Others
- 7.5 Others
- 7.5.1 Agricultural applications
- 7.5.2 Industrial uses
Chapter 8 Market Estimates & Forecast, By Region, 2021-2034 (USD Billion) (Kilo Tons)
- 8.1 Key trends
- 8.2 North America
- 8.2.1 U.S.
- 8.2.2 Canada
- 8.2.3 Mexico
- 8.3 Europe
- 8.3.1 UK
- 8.3.2 Germany
- 8.3.3 France
- 8.3.4 Italy
- 8.3.5 Spain
- 8.3.6 Russia
- 8.4 Asia Pacific
- 8.4.1 China
- 8.4.2 India
- 8.4.3 Japan
- 8.4.4 South Korea
- 8.4.5 Australia
- 8.5 Latin America
- 8.5.1 Brazil
- 8.5.2 Argentina
- 8.6 MEA
- 8.6.1 South Africa
- 8.6.2 Saudi Arabia
- 8.6.3 UAE
Chapter 9 Company Profiles
- 9.1 Baolingbao Biology Co., Ltd.
- 9.2 Cargill, Inc.
- 9.3 Changzhou Niutang Chemical Plant Co., Ltd.
- 9.4 Foodchem International Corporation
- 9.5 Futaste Co., Ltd.
- 9.6 Ingredion Incorporated
- 9.7 Jungbunzlauer Suisse AG
- 9.8 Mitsubishi Chemical Group Corporation
- 9.9 Nikken Chemical Co., Ltd.
- 9.10 RAJVI ENTERPRISE
- 9.11 Shandong Sanyuan Biotechnology Co., Ltd.
- 9.12 Tate & Lyle PLC
- 9.13 Xiwang Group
- 9.14 Zibo ZhongShi GeRui Biotech Co., Ltd.


