


 |
市场调查报告书
商品编码
1750585
湿式烟气脱硫系统市场机会、成长动力、产业趋势分析及2025-2034年预测Wet Flue Gas Desulfurization System Market Opportunity, Growth Drivers, Industry Trend Analysis, and Forecast 2025 - 2034 |
||||||
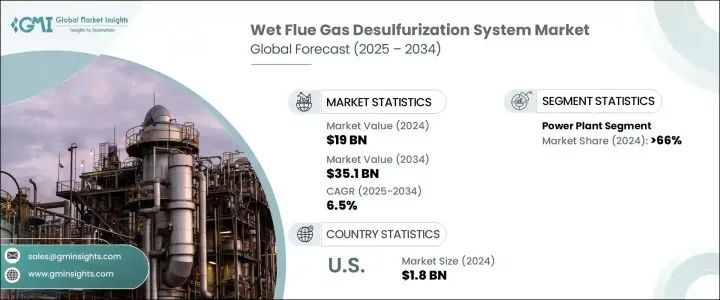
2024年,全球湿式烟气脱硫系统市场规模达190亿美元,预计到2034年将以6.5%的复合年增长率成长,达到351亿美元。这得归功于全球日益重视清洁能源,以及旨在减少工业生产(尤其是发电)二氧化硫(SO2)排放的更严格的环境法规。采用湿式烟气脱硫系统对于各行业遵守这些法规并减轻其环境影响至关重要。
技术进步显着提高了湿式烟气脱硫 (WFGD) 系统的效率和成本效益。吸收材料和系统设计的创新增强了二氧化硫 (SO2) 的去除能力,使这些系统更容易工业应用。能够根据特定排放标准客製化 WFGD 系统,进一步促进了其广泛应用。能够根据特定排放标准客製化 WFGD 系统,进一步促进了其广泛应用。各行各业越来越青睐根据区域监管框架量身定制的解决方案,这使得 WFGD 系统成为灵活的排放控制选择。这种适应性确保了其符合当前和未来的环境政策,这在各国政府持续收紧污染标准的背景下至关重要。此外,生产合成石膏等可用于建筑材料的副产品,也为这些系统增加了经济价值。工业界现在可以将二氧化硫捕获物转化为用于干墙、水泥和农产品的创收材料,而不是将其作为废物处理。
| 市场范围 | |
|---|---|
| 起始年份 | 2024 |
| 预测年份 | 2025-2034 |
| 起始值 | 190亿美元 |
| 预测值 | 351亿美元 |
| 复合年增长率 | 6.5% |
发电业仍然是最大的应用领域,到2024年将占66%的份额,这归因于燃煤电厂的高二氧化硫排放量以及严格的排放管理法规。亚太地区,尤其是中国和印度,正在经历快速的工业化进程,污染程度不断上升,对有效的排放控制技术的需求也日益增长。
2024年,美国湿式烟气脱硫系统市场规模达18亿美元,这得益于严格的监管措施,例如《汞和空气毒物标准》(MATS) 和《跨州空气污染规则》(CSAPR),这些措施限制了发电厂的二氧化硫排放。遵守这些法规需要实施先进的排放控制技术,包括湿式烟气脱硫系统 (WFGD)。
湿式烟气脱硫系统市场的主要参与者包括 CECO Environmental、KC Cottrell India、Hitachi Zosen Inova AG、Marsulex Environmental、KC Cottrell India、Hitachi Zosen Inova AG、Marsulex Environmental、KC Cottrell India、Hitachi Zosen Inova AG、Marsulex Environmental、KC Cottrell India、Hitachi Zosen Inova AG、Marsulex Environmental、KC Cottrell India、Hitachi Zosen Inova AG、Marsulex Environmental、KC 托尼亚Holding AB、通用电气、SA HAMON、Tri-Mer Corporation 和 Thermax Limited。这些公司致力于扩大产品供应并提高系统效率,以满足不断变化的市场需求。策略合作伙伴关係、技术创新和对永续发展的承诺是增强其市场地位和竞争力的关键策略。
目录
第一章:方法论与范围
第二章:执行摘要
第三章:行业洞察
- 产业生态系统分析
- 川普政府关税分析
- 对贸易的影响
- 贸易量中断
- 报復措施
- 对产业的影响
- 供应方影响(原料)
- 主要材料价格波动
- 供应链重组
- 生产成本影响
- 需求面影响(售价)
- 价格传导至终端市场
- 市占率动态
- 消费者反应模式
- 供应方影响(原料)
- 受影响的主要公司
- 策略产业反应
- 供应链重组
- 定价和产品策略
- 政策参与
- 展望与未来考虑
- 对贸易的影响
- 监管格局
- 产业衝击力
- 成长动力
- 产业陷阱与挑战
- 成长潜力分析
- 波特的分析
- PESTEL分析
第四章:竞争格局
- 介绍
- 公司市占率分析
- 战略仪表板
- 策略倡议
- 竞争基准测试
- 创新与永续发展格局
第五章:市场规模及预测:依应用,2021 - 2034
- 主要趋势
- 发电厂
- 化工和石化
- 水泥
- 金属加工和采矿
- 製造业
- 其他的
第六章:市场规模及预测:依地区,2021 - 2034
- 主要趋势
- 北美洲
- 我们
- 加拿大
- 墨西哥
- 欧洲
- 德国
- 英国
- 法国
- 西班牙
- 义大利
- 荷兰
- 亚太地区
- 中国
- 印度
- 日本
- 韩国
- 印尼
- 澳洲
- 中东和非洲
- 沙乌地阿拉伯
- 阿联酋
- 南非
- 拉丁美洲
- 巴西
- 智利
- 阿根廷
第七章:公司简介
- Babcock & Wilcox Enterprises, Inc.
- CECO Environmental
- Ducon Infratechnologies Ltd.
- GEA Group Aktiengesellschaft
- General Electric
- Hitachi Zosen Inova AG
- KC Cottrell India
- KCH Services, Inc.
- Marsulex Environmental Technologies
- Mitsubishi Heavy Industries Ltd.
- Nederman Holding AB
- SA HAMON
- Thermax Limited.
- Tri-Mer Corporation
- Valmet
- Verantis Environmental Solutions Group
The Global Wet Flue Gas Desulfurization System Market was valued at USD 19 billion in 2024 and is estimated to grow at a CAGR of 6.5% to reach USD 35.1 billion by 2034 driven by the increasing global emphasis on cleaner energy sources and stricter environmental regulations aimed at reducing sulfur dioxide (SO?) emissions from industrial processes, particularly in power generation. Adopting WFGD systems is essential for industries to comply with these regulations and mitigate their environmental impact.
Technological advancements have significantly improved the efficiency and cost-effectiveness of WFGD systems. Innovations in absorbent materials and system designs have enhanced SO? removal capabilities, making these systems more accessible to industries. The ability to customize WFGD systems to meet specific emission standards further contributes to their widespread adoption. The ability to customize WFGD systems to meet specific emission standards further contributes to their widespread adoption. Industries are increasingly favoring solutions tailored to align with regional regulatory frameworks, making WFGD systems a flexible choice for emission control. This adaptability ensures compliance with current and future environmental policies, essential as governments continue tightening pollution standards. Additionally, the production of by-products like synthetic gypsum, which can be utilized in construction materials, adds economic value to these systems. Instead of treating sulfur dioxide capture as waste, industries can now convert it into a revenue-generating material used in drywall, cement, and agricultural products.
| Market Scope | |
|---|---|
| Start Year | 2024 |
| Forecast Year | 2025-2034 |
| Start Value | $19 Billion |
| Forecast Value | $35.1 Billion |
| CAGR | 6.5% |
The power generation sector remains the largest application segment, accounting for 66% share in 2024, attributed to the high SO? emissions associated with coal-fired power plants and the stringent regulations governing these emissions. The Asia Pacific region, particularly China and India, is experiencing rapid industrialization, increasing pollution levels, and a heightened demand for effective emission control technologies.
United States Wet Flue Gas Desulfurization System Market was valued at USD 1.8 billion in 2024, fueled by stringent regulatory measures, such as the Mercury and Air Toxics Standards (MATS) and the Cross-State Air Pollution Rule (CSAPR), which limit SO? emissions from power plants. Compliance with these regulations necessitates the implementation of advanced emission control technologies, including WFGD systems.
Key players in the Wet Flue Gas Desulfurization System Market include CECO Environmental, KC Cottrell India, Hitachi Zosen Inova AG, Marsulex Environmental Technologies, Verantis Environmental Solutions Group, KCH Services, Inc., Mitsubishi Heavy Industries Ltd., Valmet Corporation, GEA Group Aktiengesellschaft, Babcock & Wilcox Enterprises, Inc., Ducon Infratechnologies Ltd., Nederman Holding AB, General Electric, S.A. HAMON, Tri-Mer Corporation, and Thermax Limited. These companies are focusing on expanding their product offerings and enhancing system efficiencies to meet the evolving demands of the market. Strategic partnerships, technological innovations, and a commitment to sustainability are key strategies employed to strengthen their market presence and competitiveness.
Table of Contents
Chapter 1 Methodology & Scope
- 1.1 Market scope & definitions
- 1.2 Market estimates & forecast parameters
- 1.3 Forecast calculation
- 1.4 Data sources
- 1.4.1 Primary
- 1.4.2 Secondary
- 1.4.2.1 Paid
- 1.4.2.2 Public
Chapter 2 Executive Summary
- 2.1 Industry synopsis, 2021 - 2034
Chapter 3 Industry Insights
- 3.1 Industry ecosystem analysis
- 3.2 Trump administration tariffs analysis
- 3.2.1 Impact on trade
- 3.2.1.1 Trade volume disruptions
- 3.2.1.2 Retaliatory measures
- 3.2.2 Impact on the industry
- 3.2.2.1 Supply-side impact (raw materials)
- 3.2.2.1.1 Price volatility in key materials
- 3.2.2.1.2 Supply chain restructuring
- 3.2.2.1.3 Production cost implications
- 3.2.2.2 Demand-side impact (selling price)
- 3.2.2.2.1 Price transmission to end markets
- 3.2.2.2.2 Market share dynamics
- 3.2.2.2.3 Consumer response patterns
- 3.2.2.1 Supply-side impact (raw materials)
- 3.2.3 Key companies impacted
- 3.2.4 Strategic industry responses
- 3.2.4.1.1 Supply chain reconfiguration
- 3.2.4.1.2 Pricing and product strategies
- 3.2.4.1.3 Policy engagement
- 3.2.5 Outlook and future considerations
- 3.2.1 Impact on trade
- 3.3 Regulatory landscape
- 3.4 Industry impact forces
- 3.4.1 Growth drivers
- 3.4.2 Industry pitfalls & challenges
- 3.5 Growth potential analysis
- 3.6 Porter's analysis
- 3.6.1 Bargaining power of suppliers
- 3.6.2 Bargaining power of buyers
- 3.6.3 Threat of new entrants
- 3.6.4 Threat of substitutes
- 3.7 PESTEL analysis
Chapter 4 Competitive Landscape, 2025
- 4.1 Introduction
- 4.2 Company market share analysis, 2024
- 4.3 Strategic dashboard
- 4.4 Strategic initiative
- 4.5 Competitive benchmarking
- 4.6 Innovation & sustainability landscape
Chapter 5 Market Size and Forecast, By Application, 2021 - 2034 (USD Billion)
- 5.1 Key trends
- 5.2 Power plants
- 5.3 Chemical & petrochemical
- 5.4 Cement
- 5.5 Metal processing & mining
- 5.6 Manufacturing
- 5.7 Others
Chapter 6 Market Size and Forecast, By Region, 2021 - 2034 (USD Billion)
- 6.1 Key trends
- 6.2 North America
- 6.2.1 U.S.
- 6.2.2 Canada
- 6.2.3 Mexico
- 6.3 Europe
- 6.3.1 Germany
- 6.3.2 UK
- 6.3.3 France
- 6.3.4 Spain
- 6.3.5 Italy
- 6.3.6 Netherlands
- 6.4 Asia Pacific
- 6.4.1 China
- 6.4.2 India
- 6.4.3 Japan
- 6.4.4 South Korea
- 6.4.5 Indonesia
- 6.4.6 Australia
- 6.5 Middle East & Africa
- 6.5.1 Saudi Arabia
- 6.5.2 UAE
- 6.5.3 South Africa
- 6.6 Latin America
- 6.6.1 Brazil
- 6.6.2 Chile
- 6.6.3 Argentina
Chapter 7 Company Profiles
- 7.1 Babcock & Wilcox Enterprises, Inc.
- 7.2 CECO Environmental
- 7.3 Ducon Infratechnologies Ltd.
- 7.4 GEA Group Aktiengesellschaft
- 7.5 General Electric
- 7.6 Hitachi Zosen Inova AG
- 7.7 KC Cottrell India
- 7.8 KCH Services, Inc.
- 7.9 Marsulex Environmental Technologies
- 7.10 Mitsubishi Heavy Industries Ltd.
- 7.11 Nederman Holding AB
- 7.12 S.A. HAMON
- 7.13 Thermax Limited.
- 7.14 Tri-Mer Corporation
- 7.15 Valmet
- 7.16 Verantis Environmental Solutions Group
 工业废气脱硫塔市场:依技术、材料、安装、塔型和最终用户划分,全球预测(2026-2032)
 2026年全球湿式烟气脱硫系统市场报告2026年全球烟道气体脱硫系统市场报告
 烟气脱硫市场 - 全球产业规模、份额、趋势、机会及预测(按类型、终端用户产业、安装量、地区和竞争格局划分,2021-2031年)
 排烟脱硫(FGD)市场按材料类型、最终用途行业和地区划分沼气脱硫市场依技术、应用、原料、终端用户及工厂产能划分,全球预测(2026-2032年)
 排烟脱硫系统市场规模、份额及成长分析(依技术、应用、吸附剂类型、安装类型及地区划分)-2026-2033年产业预测
 全球排烟脱硫市场-2025-2030年预测排烟脱硫系统市场:按最终用户、类型、安装类型和组件划分 - 全球预测 2025-2032
 2025-2029年全球排烟脱硫系统市场