


 |
市场调查报告书
商品编码
1755211
清洁标籤食品添加剂市场机会、成长动力、产业趋势分析及 2025 - 2034 年预测Clean Labelled Food Additives Market Opportunity, Growth Drivers, Industry Trend Analysis, and Forecast 2025 - 2034 |
||||||
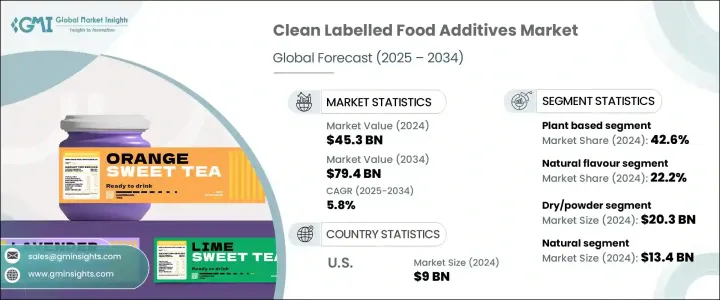
2024年,全球清洁标籤食品添加剂市场规模达453亿美元,预计2034年将以5.8%的复合年增长率成长,达到794亿美元。消费者对食品透明度、天然来源和最低加工要求的日益重视,对塑造这一市场格局发挥重要作用。随着对易于识别、易于理解的成分的需求日益增长,食品製造商正在选择不影响性能或保质期的清洁标籤解决方案。这些源自植物、微生物、矿物质和动物的添加剂正被广泛用于替代合成添加剂,同时保持加工食品的风味、外观和品质。
它们的功能涵盖保鲜、提升风味、改善质地、促进乳化以及赋予天然色素和甜味。消费者对人工添加剂的质疑日益加深,以及对符合健康和道德标准的食品的偏好,推动了这种向简化和天然来源的原料采购的转变。因此,清洁标籤配方已成为各大品类食品品牌的重要策略,使其能够维繫消费者信任,并满足市场对低加工、更健康食品的需求。
| 市场范围 | |
|---|---|
| 起始年份 | 2024 |
| 预测年份 | 2025-2034 |
| 起始值 | 453亿美元 |
| 预测值 | 794亿美元 |
| 复合年增长率 | 5.8% |
在关键成分中,天然香料在2024年占据了22.2%的市场份额,预计到2034年将以5.8%的复合年增长率成长。这些成分吸引了追求真实感的消费者,因为它们源自于水果、香草、香料和其他植物来源。它们用途广泛,无需依赖人工成分即可提升乳製品、烘焙食品、饮料和零食的口感,这使得它们在清洁标籤产品开发中的地位日益突出。
从成分来源来看,植物性添加剂在2024年占据42.6%的市场份额,占据市场主导地位,预计到2034年将以6%的复合年增长率成长。人们对永续性、动物福利和植物性饮食日益增长的兴趣,推动了对源自水果、蔬菜、谷物和豆类的清洁标籤成分的需求。这些成分透过提供合成化合物的天然替代品来满足清洁标籤的期望,使品牌能够配製出体现道德和环保意识的产品。
以形态划分,干粉类产品在2024年的收入超过203亿美元。它们保质期更长、易于储存,并且与自动化生产流程相容,使其成为烘焙食品、零食和饮料冲调的理想选择。其广泛应用源自于其为製造商和消费者提供的便利性和稳定性。同时,液体添加剂也越来越受到青睐,尤其是在酱料和乳製品等应用中,这些应用专注于易于混合和风味一致性。
从认证角度来看,天然产品市场在2024年达到134亿美元,凭藉其与健康、透明度和极简加工的紧密联繫,占据了市场主导地位。消费者倾向于信任「天然」标籤,认为它代表安全和成分的完整性。此外,由于对合成化学品和基因改造的担忧,对有机和非基因改造标籤的需求也在不断增长。儘管清洁标籤认证产品仍处于新兴阶段,但它们被视为提供最高水准的保证,并有望在受监管或高端市场占有一席之地。
在终端用途类别中,烘焙和糖果产品占据了最大的市场份额,2024 年贡献了 24.3%,预计到 2034 年将以 6.2% 的复合年增长率增长。人们对麵包、蛋糕和饼干等烘焙食品中清洁植物性成分的偏好持续推动着这一领域的创新。食品生产商正在用清洁标籤产品取代人工甜味剂、色素和防腐剂,以满足消费者对更健康选择的需求。
由于天然和功能性饮料日益流行,饮料业也呈现稳定成长。随着消费者对日常用品透明度的要求越来越高,清洁标籤添加剂正被用于乳製品和冷冻食品,尤其是优格和冷冻甜点。酱料、调味品、零食和即食食品也正在转向清洁配方,以吸引註重健康的消费者。肉类、禽类和海鲜类别正在逐步减少合成防腐剂和着色剂的使用,以符合清洁标籤标准,同时确保食品安全。
就功能性而言,风味和色素增强在2024年以136亿美元的市场规模领先该领域。人们对更鲜艳、更具吸引力、风味更天然的食品的需求持续增长,尤其是在外观对购买决策影响重大的领域。植物萃取物、草本植物和水果通常取代人工色素和香精,帮助品牌满足人们对更健康、更具视觉吸引力的食品的需求。
以消费者特征细分的市场显示,传统产品在2024年占总市场的30.9%,预计到2034年将以5.7%的复合年增长率成长。随着各大品牌努力改进麵包、酱料和零食等主食的配方,以满足日常清洁饮食的期望,这些产品已成为清洁标籤整合的焦点。虽然高端、健康和儿童产品仍在强调清洁标籤的特性,但此类成分在主流商品中的应用表明,清洁标籤已不再是小众概念,而是新的标准。
从区域来看,美国引领北美清洁标籤食品添加剂市场,2024年市场规模达90亿美元,预计2034年复合年增长率将达到5.6%。这一领先地位源于消费者意识的提升、监管支持以及广泛的清洁标籤产品供应。美国消费者尤其註重成分,也越来越要求产品不含人工添加剂。製造商正积极响应这一趋势,将清洁标籤原则融入几乎所有食品类别。
全球清洁标籤食品添加剂领域的领导者包括嘉吉、宜瑞安、ADM、凯里集团和泰特莱尔。这些公司拥有强大的全球影响力、多样化的产品组合和强大的分销体系,使其成为全球日益增长的清洁标籤解决方案需求的关键供应商。
目录
第一章:方法论与范围
第二章:执行摘要
第三章:行业洞察
- 产业生态系统分析
- 供应商概况
- 利润率
- 每个阶段的增值
- 影响价值链的因素
- 中断
- 产业衝击力
- 成长动力
- 产业陷阱与挑战
- 市场机会
- 成长潜力分析
- 监管格局
- 北美洲
- 欧洲
- 亚太地区
- 拉丁美洲
- 中东和非洲
- 波特的分析
- PESTEL分析
- 价格趋势
- 按地区
- 按产品
- 未来市场趋势
- 科技与创新格局
- 当前的技术趋势
- 新兴技术
- 专利态势
- 贸易统计(HS编码)
- 主要进口国
- 主要出口国
- 永续性和环境方面
- 永续实践
- 减少废弃物的策略
- 生产中的能源效率
- 环保倡议
- 製造流程概述
- 原料采购与准备
- 提取和加工方法
- 纯化和标准化
- 品质控制和测试
- 包装和储存
- 生产成本分析
- 原料成本
- 加工成本
- 劳动成本
- 包装成本
- 製造费用
- 成本优化策略
- 製造设施分析
- 主要製造地点
- 生产能力评估
- 设施扩建计划
- 供应链挑战与解决方案
- 原物料采购挑战
- 品质一致性问题
- 物流和运输
- 库存管理
- 製造流程的可持续性
- 能源效率措施
- 节水措施
- 废弃物减少和管理
- 减少碳足迹策略
- 全球监理框架
- 区域监理框架
- 北美洲
- FDA 法规和指南
- 美国农业部有机标准
- 国家级法规
- 欧洲
- Efsa 指南
- 欧盟食品添加物法规
- 欧盟有机法规
- 亚太
- 中国食品添加物管理条例
- 日本食品添加物标准
- 其他地区法规
- 北美洲
- 区域监理框架
- 世界其他地区
- 清洁标籤定义和标准
- 产业定义的标准
- 零售商定义的标准
- 消费者对清洁标章的看法
- 认证和标籤要求
- 有机认证
- 非基因改造验证
- 天然声明认证
- 过敏原标籤
- 合规挑战与策略
- 未来监管趋势和影响
- 环境、社会与治理分析
- 环境影响评估
- 碳足迹分析
- 用水和管理
- 土地利用和生物多样性影响
- 废弃物产生和管理
- 环境影响评估
- 社会责任实践
- 劳动实务和工作条件
- 社区参与与支持
- 健康和营养影响
- 道德采购实践
- 治理和道德考虑
- 公司治理结构
- 透明度和报告
- 道德商业行为
- 利害关係人参与
- 关键参与者的 ESG 绩效基准
- ESG风险评估及缓解策略
- 清洁标籤食品添加剂产业的未来 ESG 趋势
- 消费者行为与市场趋势分析
- 消费者偏好与购买模式
- 清洁标籤意识和理解
- 支付保费意愿
- 成分迴避行为
- 标籤阅读习惯
- 清洁标籤消费者的人口统计分析
- 年龄组分析
- 收入水平分析
- 地理分布
- 生活风格和心理细分
- 消费者对清洁标示食品添加剂的看法
- 感知到的健康益处
- 感知的环境效益
- 感知品质和价值
- 信任和可信度因素
- 新兴消费趋势
- 植物性和纯素食偏好
- 无过敏原和无过敏原趋势
- 功能性食品和强化食品偏好
- 永续性和道德消费
- 数位转型对消费者参与度的影响
- 消费者回馈分析及启示
- 消费者偏好与购买模式
- 技术格局与创新分析
- 当前的技术趋势
- 新兴技术
- 先进的萃取技术
- 发酵和生物技术
- 奈米科技应用
- 高压非热技术
- 产品创新趋势
- 多功能成分
- 传统添加剂的替代品
- 新型植物成分
- 升级再造的原料
- 配方与应用创新
- 延长保质期的解决方案
- 风味增强技术
- 纹理化解决方案
- 色彩稳定性创新
- 包装和配送系统创新
- 永续包装
- 智慧包装
- 份量控制包装
- 延长保存期限的包装
- 研发活动与创新中心
- 各地区技术采用趋势
- 未来技术路线图(2025-2034)
- 定价分析与经济因素
- 定价趋势
- 历史价格趋势
- 目前定价情景
- 价格预测
- 影响定价的因素
- 原料成本
- 加工成本
- 合规成本
- 市场竞争
- 消费者支付意愿
- 定价策略
- 高阶市场 vs. 大众市场
- 增值定价
- 捆绑定价
- 区域价格差异
- 价格价值关係分析
- 经济指标
- GDP成长与消费者支出
- 通货膨胀和货币波动
- 农产品价格
- 能源成本
- 定价趋势
- 供应商格局
- 利润率分析
- 重要新闻和倡议
- 监管格局
- 衝击力
- 成长动力
- 消费者对清洁标籤产品的偏好日益增长
- 不断扩张的食品饮料产业
- 扩大需要清洁标籤成分的植物性和有机食品产品
- 产业陷阱与挑战
- 清洁标籤食品添加剂成本高
- 不使用人工防腐剂,维持口味、质地和保存期限的挑战
- 成长动力
- 成长潜力分析
- 波特的分析
- PESTEL分析
第四章:竞争格局
- 介绍
- 公司市占率分析
- 按地区
- 北美洲
- 欧洲
- 亚太地区
- 拉丁美洲
- MEA
- 公司矩阵分析
- 主要市场参与者的竞争分析
- 竞争定位矩阵
- 关键进展
- 併购
- 伙伴关係与合作
- 新产品发布
- 扩张计划
第五章:市场规模及预测:依成分类型 2021 - 2034
- 主要趋势
- 自然色彩
- 天然香料
- 天然防腐剂
- 天然甜味剂
- 水胶体和组织剂
- 功能性天然淀粉
- 天然乳化剂
- 其他
第六章:市场规模及预测:依来源,2021 - 2034
- 主要趋势
- 植物基
- 动物性
- 微生物/发酵
- 矿物基
第七章:市场规模及预测:依形式,2021 - 2034
- 主要趋势
- 干粉
- 液体
- 其他的
第 8 章:市场规模与预测:按认证,2021 年至 2034 年
- 主要趋势
- 有机的
- 非基因改造
- 自然的
- 清洁标籤认证
- 其他的
第九章:市场规模及预测:依最终用途,2021 - 2034
- 主要趋势
- 烘焙和糖果
- 饮料
- 乳製品和冷冻食品
- 加工食品
- 酱料和调味品
- 小吃和便利商店
- 肉类、家禽和海鲜
- 其他的
第 10 章:市场规模与预测:按功能划分,2021 年至 2034 年
- 主要趋势
- 储存
- 纹理修改
- 增强风味/色彩
- 乳化
- 甜味剂
- 其他的
第 11 章:市场规模及预测:依消费者划分,2021 年至 2034 年
- 主要趋势
- 常规产品
- 优质产品
- 健康与保健产品
- 儿童产品
- 其他的
第 12 章:市场估计与预测:按地区,2021 年至 2034 年
- 主要趋势
- 北美洲
- 我们
- 加拿大
- 欧洲
- 德国
- 英国
- 法国
- 西班牙
- 义大利
- 亚太地区
- 中国
- 印度
- 日本
- 澳洲
- 韩国
- 拉丁美洲
- 巴西
- 墨西哥
- 阿根廷
- 中东和非洲
- 沙乌地阿拉伯
- 南非
- 阿联酋
第十三章:公司简介
- ADM
- Cargill
- Corbion Inc.
- DSM
- Frutarom
- Ingredion
- International Flavors & Fragrances Inc.
- Kemin Industries, Inc.
- Kerry Group
- Sensient Technologies
- Tate & Lyle
The Global Clean Labelled Food Additives Market was valued at USD 45.3 billion in 2024 and is estimated to grow at a CAGR of 5.8% to reach USD 79.4 billion by 2034. The growing awareness among consumers about food transparency, natural origins, and minimal processing is playing a significant role in shaping this market. With the increasing demand for recognizable, easy-to-understand ingredients, food manufacturers are opting for clean label solutions that don't compromise on performance or shelf life. These additives, derived from plants, microbes, minerals, and animals, are being widely used to replace synthetic counterparts while maintaining the taste, appearance, and quality of processed foods.
Their functions extend to preserving freshness, enhancing flavors, improving texture, supporting emulsification, and delivering natural colors and sweetness. This shift toward simplicity and natural origins in ingredient sourcing is supported by rising consumer skepticism toward artificial additives and a preference for food that aligns with healthy and ethical choices. As a result, clean label formulations have become a vital strategy for food brands across major categories, allowing them to retain consumer trust and respond to market demand for minimally processed, better-for-you foods.
| Market Scope | |
|---|---|
| Start Year | 2024 |
| Forecast Year | 2025-2034 |
| Start Value | $45.3 Billion |
| Forecast Value | $79.4 Billion |
| CAGR | 5.8% |
Among the key ingredients, natural flavors commanded a 22.2% share of the market in 2024 and are projected to expand at a CAGR of 5.8% through 2034. These ingredients appeal to consumers seeking authenticity, as they are derived from fruits, herbs, spices, and other plant-based sources. Their versatility in enhancing the taste of dairy products, baked goods, beverages, and snacks without relying on artificial components supports their growing prominence in clean label product development.
When viewed by ingredient source, plant-based additives led the market with a 42.6% share in 2024 and are expected to grow at a CAGR of 6% through 2034. Rising interest in sustainability, animal welfare, and plant-forward diets has fueled the demand for clean label ingredients derived from fruits, vegetables, grains, and legumes. These ingredients meet clean label expectations by offering natural alternatives to synthetic compounds, thus enabling brands to formulate products that reflect ethical and environmental consciousness.
Based on form, the dry or powder segment generated revenues exceeding USD 20.3 billion in 2024. Their longer shelf life, ease of storage, and compatibility with automated manufacturing processes make them an ideal choice for baked goods, snacks, and drink mixes. Their widespread use stems from the convenience and stability they offer to manufacturers and consumers alike. Meanwhile, liquid additives are gaining traction, particularly in applications such as sauces and dairy products, where ease of blending and consistency in flavor delivery are valued.
From a certification standpoint, the natural segment reached USD 13.4 billion in 2024, dominating the market due to its strong association with health, transparency, and minimal processing. Consumers tend to trust the "natural" label, believing it represents safety and ingredient integrity. This is followed by a growing demand for organic and non-GMO labels, driven by concerns over synthetic chemicals and genetic modification. Although still emerging, clean label certified products are seen as offering the highest level of assurance and are likely to gain ground in regulated or high-end markets.
Among end-use categories, bakery and confectionery products accounted for the largest market share, contributing 24.3% in 2024 and expected to grow at a CAGR of 6.2% through 2034. The preference for clean, plant-based ingredients in baked treats like bread, cakes, and cookies continues to drive innovation in this segment. Food producers are substituting artificial sweeteners, colors, and preservatives with clean label options to satisfy customer demand for healthier choices.
The beverage segment is also witnessing steady growth due to the increasing popularity of natural and functional drinks. Clean label additives are being used in dairy and frozen foods, particularly in yogurts and frozen desserts, as consumers demand transparency in everyday items. Sauces, condiments, snacks, and ready meals are also shifting toward clean formulations to appeal to health-focused shoppers. The meat, poultry, and seafood categories are gradually reducing synthetic preservatives and coloring agents to align with clean label standards while maintaining food safety.
In terms of functionality, flavor and color enhancement led the segment with USD 13.6 billion in 2024. The drive for more vibrant, appealing, and naturally flavored foods continues to rise, especially in segments where appearance heavily influences purchase decisions. Plant-based extracts, herbs, and fruits commonly replace artificial colors and flavors, helping brands align with the demand for healthier, visually attractive foods.
The market segmented by consumer profile shows that conventional products accounted for 30.9% of the total market in 2024 and are forecast to expand at a CAGR of 5.7% through 2034. These products have become a focal point for clean label integration as brands work to reformulate staple items like bread, sauces, and snacks to meet everyday clean eating expectations. While premium, wellness, and children's products continue to highlight clean label features, the inclusion of such ingredients in mainstream goods shows that clean label is no longer a niche concept-it's the new standard.
In regional terms, the U.S. led the North American clean labelled food additives market, reaching USD 9 billion in 2024, and is expected to grow at a CAGR of 5.6% through 2034. This leadership stems from heightened consumer awareness, regulatory support, and extensive clean label product offerings. American consumers are especially mindful of ingredients and increasingly demand products free from artificial additives. Manufacturers are responding by incorporating clean label principles across nearly every food category.
Leading players in the global clean labelled food additives space include Cargill, Ingredion, ADM, Kerry Group, and Tate & Lyle. These companies have strong global footprints, diverse product portfolios, and robust distribution systems, positioning them as key suppliers for the increasing demand for clean label solutions worldwide.
Table of Contents
Chapter 1 Methodology & Scope
- 1.1 Market scope & definition
- 1.2 Base estimates & calculations
- 1.3 Forecast calculation
- 1.4 Data sources
- 1.4.1 Primary
- 1.4.2 Secondary
- 1.4.2.1 Paid sources
- 1.4.2.2 Public sources
- 1.5 Primary research and validation
- 1.5.1 Primary sources
- 1.5.2 Data mining sources
Chapter 2 Executive Summary
- 2.1 Industry 360° synopsis
- 2.2 Key market trends
- 2.2.1 Regional
- 2.2.2 Ingredient type
- 2.2.3 Form
- 2.2.4 Origin
- 2.2.5 Beverage type
- 2.2.6 Flavor type
- 2.3 TAM Analysis, 2025-2034
- 2.4 CXO perspectives: Strategic imperatives
- 2.4.1 Executive decision points
- 2.4.2 Critical success factors
- 2.5 Future Outlook and Strategic Recommendations
Chapter 3 Industry Insights
- 3.1 Industry ecosystem analysis
- 3.1.1 Supplier Landscape
- 3.1.2 Profit Margin
- 3.1.3 Value addition at each stage
- 3.1.4 Factor affecting the value chain
- 3.1.5 Disruptions
- 3.2 Industry impact forces
- 3.2.1 Growth drivers
- 3.2.2 Industry pitfalls and challenges
- 3.2.3 Market opportunities
- 3.3 Growth potential analysis
- 3.4 Regulatory landscape
- 3.4.1 North America
- 3.4.2 Europe
- 3.4.3 Asia Pacific
- 3.4.4 Latin America
- 3.4.5 Middle East & Africa
- 3.5 Porter's analysis
- 3.6 PESTEL analysis
- 3.6.1 Technology and Innovation landscape
- 3.6.2 Current technological trends
- 3.6.3 Emerging technologies
- 3.7 Price trends
- 3.7.1 By region
- 3.7.2 By product
- 3.8 Future market trends
- 3.9 Technology and Innovation landscape
- 3.9.1 Current technological trends
- 3.9.2 Emerging technologies
- 3.10 Patent Landscape
- 3.11 Trade statistics (HS code)
- 3.11.1 Major importing countries
- 3.11.2 Major exporting countries
- 3.12 Sustainability and environmental aspects
- 3.12.1 Sustainable practices
- 3.12.2 Waste reduction strategies
- 3.12.3 Energy efficiency in production
- 3.12.4 Eco-friendly initiatives
- 3.13 Manufacturing process overview
- 3.13.1 Raw material procurement and preparation
- 3.13.2 Extraction and processing methods
- 3.13.3 Purification and standardization
- 3.13.4 Quality control and testing
- 3.13.5 Packaging and storage
- 3.14 Production cost analysis
- 3.14.1 Raw material costs
- 3.14.2 Processing costs
- 3.14.3 Labor costs
- 3.14.4 Packaging costs
- 3.14.5 Manufacturing overheads
- 3.14.6 Cost optimization strategies
- 3.15 Manufacturing facilities analysis
- 3.15.1 Key manufacturing locations
- 3.15.2 Production capacity assessment
- 3.15.3 Facility expansion plans
- 3.16 Supply chain challenges and solutions
- 3.16.1 Raw material sourcing challenges
- 3.16.2 Quality consistency issues
- 3.16.3 Logistics and transportation
- 3.16.4 Inventory management
- 3.17 Sustainability in manufacturing processes
- 3.17.1 Energy efficiency measures
- 3.17.2 Water conservation practices
- 3.17.3 Waste reduction and management
- 3.17.4 Carbon footprint reduction strategies
- 3.18 Global regulatory framework
- 3.18.1 Regional regulatory frameworks
- 3.18.1.1 North america
- 3.18.1.1.1 Fda regulations and guidelines
- 3.18.1.1.2 Usda organic standards
- 3.18.1.1.3 State-level regulations
- 3.18.1.2 Europe
- 3.18.1.2.1 Efsa guidelines
- 3.18.1.2.2 Eu food additives regulation
- 3.18.1.2.3 Eu organic regulations
- 3.18.1.3 Asia-pacific
- 3.18.1.3.1 China food additive regulations
- 3.18.1.3.2 Japan food additive standards
- 3.18.1.3.3 Other regional regulations
- 3.18.1.1 North america
- 3.18.1 Regional regulatory frameworks
- 3.19 Rest of the world
- 3.20 Clean label definitions and standards
- 3.20.1 Industry-defined standards
- 3.20.2 Retailer-defined standards
- 3.20.3 Consumer perception of clean label
- 3.21 Certification and labeling requirements
- 3.21.1 Organic certification
- 3.21.2 Non-gmo verification
- 3.21.3 Natural claims certification
- 3.21.4 Allergen labeling
- 3.22 Compliance challenges and strategies
- 3.23 Future regulatory trends and implications
- 3.24 Environmental, social, and governance analysis
- 3.24.1 Environmental impact assessment
- 3.24.1.1 Carbon footprint analysis
- 3.24.1.2 Water usage and management
- 3.24.1.3 Land use and biodiversity impact
- 3.24.1.4 Waste generation and management
- 3.24.1 Environmental impact assessment
- 3.25 Social responsibility practices
- 3.25.1.1 Labor practices and working conditions
- 3.25.1.2 Community engagement and support
- 3.25.1.3 Health and nutrition impact
- 3.25.1.4 Ethical sourcing practices
- 3.26 Governance and ethical considerations
- 3.26.1.1 Corporate governance structures
- 3.26.1.2 Transparency and reporting
- 3.26.1.3 Ethical business practices
- 3.26.1.4 Stakeholder engagement
- 3.27 Esg performance benchmarking of key players
- 3.28 Esg risk assessment and mitigation strategies
- 3.29 Future esg trends in the clean labelled food additives industry
- 3.30 Consumer behavior and market trends analysis
- 3.30.1 Consumer preferences and purchasing patterns
- 3.30.1.1 Clean label awareness and understanding
- 3.30.1.2 Willingness to pay premium
- 3.30.1.3 Ingredient avoidance behaviors
- 3.30.1.4 Label reading habits
- 3.30.2 Demographic analysis of clean label consumers
- 3.30.2.1 Age group analysis
- 3.30.2.2 Income level analysis
- 3.30.2.3 Geographic distribution
- 3.30.2.4 Lifestyle and psychographic segmentation
- 3.30.3 Consumer perception of clean labelled food additives
- 3.30.3.1 Perceived health benefits
- 3.30.3.2 Perceived environmental benefits
- 3.30.3.3 Perceived quality and value
- 3.30.3.4 Trust and credibility factors
- 3.30.4 Emerging consumer trends
- 3.30.4.1 Plant-based and vegan preferences
- 3.30.4.2 Allergen-free and free-from trends
- 3.30.4.3 Functional and fortified food preferences
- 3.30.4.4 Sustainability and ethical consumption
- 3.30.5 Impact of digital transformation on consumer engagement
- 3.30.6 Consumer feedback analysis and implications
- 3.30.1 Consumer preferences and purchasing patterns
- 3.31 Technological landscape and innovation analysis
- 3.31.1 Current technological trends
- 3.31.2 Emerging technologies
- 3.31.2.1 Advanced extraction technologies
- 3.31.2.2 Fermentation and biotechnology
- 3.31.2.3 Nanotechnology applications
- 3.31.2.4 High-pressure and non-thermal tech
- 3.31.3 Product innovation trends
- 3.31.3.1 Multi-functional ingredients
- 3.31.3.2 Alternatives to traditional additives
- 3.31.3.3 Novel plant-based ingredients
- 3.31.3.4 Upcycled ingredients
- 3.31.4 Formulation and application innovations
- 3.31.4.1 Shelf-life extension solutions
- 3.31.4.2 Flavor enhancement techniques
- 3.31.4.3 Texturizing solutions
- 3.31.4.4 Color stability innovations
- 3.31.5 Packaging and delivery system innovations
- 3.31.5.1 Sustainable packaging
- 3.31.5.2 Smart packaging
- 3.31.5.3 Portion control packaging
- 3.31.5.4 Extended shelf-life packaging
- 3.31.6 R&d activities and innovation hubs
- 3.31.7 Technology adoption trends across regions
- 3.31.8 Future technology roadmap (2025-2034)
- 3.32 Pricing analysis and economic factors
- 3.32.1 Pricing trends
- 3.32.1.1 Historical price trends
- 3.32.1.2 Current pricing scenario
- 3.32.1.3 Price forecast
- 3.32.2 Factors affecting pricing
- 3.32.2.1 Raw material costs
- 3.32.2.2 Processing costs
- 3.32.2.3 Compliance costs
- 3.32.2.4 Market competition
- 3.32.2.5 Consumer willingness to pay
- 3.32.3 Pricing strategies
- 3.32.3.1 Premium vs. Mass market
- 3.32.3.2 Value-added pricing
- 3.32.3.3 Bundle pricing
- 3.32.4 Regional price variations
- 3.32.5 Price-value relationship analysis
- 3.32.6 Economic indicators
- 3.32.6.1 Gdp growth and consumer spending
- 3.32.6.2 Inflation and currency fluctuations
- 3.32.6.3 Agricultural commodity prices
- 3.32.6.4 Energy cost
- 3.32.1 Pricing trends
- 3.33 Supplier landscape
- 3.34 Profit margin analysis
- 3.35 Key news & initiatives
- 3.36 Regulatory landscape
- 3.37 Impact forces
- 3.37.1 Growth drivers
- 3.37.1.1 The rising consumer preference for clean-label products
- 3.37.1.2 Expanding food & beverage industry
- 3.37.1.3 Expansion of plant-based and organic food products requiring clean-label ingredient
- 3.37.2 Industry pitfalls & challenges
- 3.37.2.1 High cost of clean labelled food additives
- 3.37.2.2 Challenges in maintaining taste, texture, and shelf life without artificial preservatives
- 3.37.1 Growth drivers
- 3.38 Growth potential analysis
- 3.39 Porter's analysis
- 3.40 PESTEL analysis
Chapter 4 Competitive Landscape, 2024
- 4.1 Introduction
- 4.2 Company market share analysis
- 4.2.1 By region
- 4.2.2 North America
- 4.2.3 Europe
- 4.2.4 Asia Pacific
- 4.2.5 LATAM
- 4.2.6 MEA
- 4.3 Company matrix analysis
- 4.4 Competitive analysis of major market players
- 4.5 Competitive positioning matrix
- 4.6 Key developments
- 4.6.1 Mergers & acquisitions
- 4.6.2 Partnerships & collaborations
- 4.6.3 New Product Launches
- 4.6.4 Expansion Plans
Chapter 5 Market Size and Forecast, By Ingredient Type 2021 - 2034 (USD Billion, Kilo Tons)
- 5.1 Key trends
- 5.2 Natural colors
- 5.3 Natural flavors
- 5.4 Natural preservatives
- 5.5 Natural sweeteners
- 5.6 Hydrocolloids and texturizers
- 5.7 Functional native starches
- 5.8 Natural emulsifiers
- 5.9 Other
Chapter 6 Market Size and Forecast, By Source, 2021 - 2034 (USD Billion, Kilo Tons)
- 6.1 Key trends
- 6.2 Plant-based
- 6.3 Animal-based
- 6.4 Microbial/fermentation
- 6.5 Mineral-based
Chapter 7 Market Size and Forecast, By Form, 2021 - 2034 (USD Billion, Kilo Tons)
- 7.1 Key trend
- 7.2 Dry/powder
- 7.3 Liquid
- 7.4 Others
Chapter 8 Market Size and Forecast, By Certification, 2021 - 2034 (USD Billion, Kilo Tons)
- 8.1 Key trend
- 8.2 Organic
- 8.3 Non-GMO
- 8.4 Natural
- 8.5 Clean label certified
- 8.6 Others
Chapter 9 Market Size and Forecast, By End Use, 2021 - 2034 (USD Billion, Kilo Tons)
- 9.1 Key trend
- 9.2 Bakery & confectionery
- 9.3 Beverages
- 9.4 Dairy & frozen
- 9.5 Processed foods
- 9.6 Sauces & condiments
- 9.7 Snacks & convenience
- 9.8 Meat, poultry & Seafood
- 9.9 Others
Chapter 10 Market Size and Forecast, By Functionality, 2021 - 2034 (USD Billion, Kilo Tons)
- 10.1 Key trend
- 10.2 Preservation
- 10.3 Texture modification
- 10.4 Flavor/color enhancement
- 10.5 Emulsification
- 10.6 Sweetening
- 10.7 Others
Chapter 11 Market Size and Forecast, By Consumer, 2021 - 2034 (USD Billion, Kilo Tons)
- 11.1 Key trend
- 11.2 Conventional product
- 11.3 Premium product
- 11.4 Health & wellness product
- 11.5 Children’s products
- 11.6 Others
Chapter 12 Market Estimates and Forecast, By Region, 2021 - 2034 (USD Billion) (Kilo Tons)
- 12.1 Key trends
- 12.2 North America
- 12.2.1 U.S.
- 12.2.2 Canada
- 12.3 Europe
- 12.3.1 Germany
- 12.3.2 UK
- 12.3.3 France
- 12.3.4 Spain
- 12.3.5 Italy
- 12.4 Asia Pacific
- 12.4.1 China
- 12.4.2 India
- 12.4.3 Japan
- 12.4.4 Australia
- 12.4.5 South Korea
- 12.5 Latin America
- 12.5.1 Brazil
- 12.5.2 Mexico
- 12.5.3 Argentina
- 12.6 Middle East and Africa
- 12.6.1 Saudi Arabia
- 12.6.2 South Africa
- 12.6.3 UAE
Chapter 13 Company Profiles
- 13.1 ADM
- 13.2 Cargill
- 13.3 Corbion Inc.
- 13.4 DSM
- 13.5 Frutarom
- 13.6 Ingredion
- 13.7 International Flavors & Fragrances Inc.
- 13.8 Kemin Industries, Inc.
- 13.9 Kerry Group
- 13.10 Sensient Technologies
- 13.11 Tate & Lyle

