


 |
市场调查报告书
商品编码
1755246
企业资料视觉化平台市场机会、成长动力、产业趋势分析及 2025 - 2034 年预测Enterprise Data Visualization Platform Market Opportunity, Growth Drivers, Industry Trend Analysis, and Forecast 2025 - 2034 |
||||||
2024年,全球企业数据视觉化平台市场规模达88亿美元,预计到2034年将以14.1%的复合年增长率增长,达到277亿美元,这得益于数位化转型步伐的加快以及对云端分析需求的不断增长。随着企业日益注重以数据为中心,企业开始大幅转向能够提供即时、可操作洞察的工具。企业正在摆脱静态报告,转而采用能够促进敏捷性、协作和明智决策的动态平台。人工智慧和机器学习功能与视觉化工具的集成,进一步将其转变为预测洞察和异常检测的引擎。这些进步使企业能够快速回应不断变化的市场环境。如今,集中式系统能够连结分散的资料来源,提高跨部门的可见性,并促进策略计画的实施。借助云端原生工具提供的可扩展且经济高效的解决方案,企业能够更好地适应不断变化的业务环境,使资料视觉化成为卓越营运和竞争成长的基石。
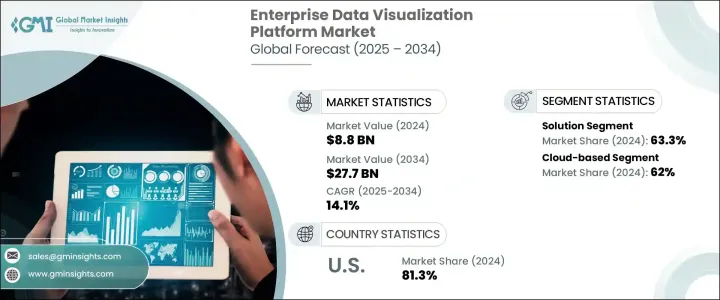
2024 年,云端平台占据 62% 的市场份额,预计 2025 年至 2034 年期间的复合年增长率将达到 14.9%。这些平台提供无与伦比的灵活性,支援分散的团队和动态的业务需求。它们能够快速与各种系统集成,并提供按需洞察,使其成为寻求可扩展即时分析的组织的首选。凭藉嵌入式分析、AI 增强探索和自动扩展等功能,它们无需传统基础架构的复杂性即可提供强大的效能。
| 市场范围 | |
|---|---|
| 起始年份 | 2024 |
| 预测年份 | 2025-2034 |
| 起始值 | 88亿美元 |
| 预测值 | 277亿美元 |
| 复合年增长率 | 14.1% |
解决方案细分市场占据63.3%的市场份额,预计到2034年将以15%的复合年增长率成长。这些平台将深度分析功能与直觉的设计相结合,使用户能够推动策略和营运决策。这些解决方案通常部署在数位转型专案中,使企业能够简化报告流程、监控营运情况,并使用互动式模型和预建模板来获取客户洞察。低程式码和无程式码功能可实现更广泛的使用者采用,帮助各部门团队创建仪表板、减少对IT的依赖,并培养资料优先的文化。
北美企业数据视觉化平台市场占81.3%的市场份额,2024年市场规模达105亿美元。该市场的成长得益于高度数位化的生态系统、智慧工具的广泛应用以及强大的技术创新力量。企业持续投资于高阶分析和云端平台,以提升营运敏捷性和策略协同性。成熟的基础设施和丰富的资料人才使其成为开发和部署尖端视觉化技术的主要枢纽。
推动全球企业资料视觉化平台市场创新的关键参与者包括 Salesforce、MicroStrategy、Qlik、亚马逊网路服务 (AWS)、Google、IBM Corporation、SAP SE、微软 Corporation、Domo 和 Oracle Corporation。企业资料视觉化平台市场的领先公司专注于创新、云端扩展和人工智慧集成,以巩固其市场地位。许多公司正在透过预测分析、自然语言处理和自动异常检测等人工智慧驱动的功能来增强其平台,以改善用户体验和决策能力。供应商正在投资云端原生架构和嵌入式分析。组织透过提供低程式码客製化和直觉的介面来优先考虑易用性,从而实现跨业务部门的更广泛采用。
目录
第一章:方法论与范围
第二章:执行摘要
第三章:行业洞察
- 产业生态系统分析
- 供应商格局
- 技术提供者
- 系统整合商
- 云端和基础设施供应商
- 最终用途
- 川普政府关税的影响
- 贸易影响
- 贸易量中断
- 报復措施
- 对产业的影响
- 供应方影响(原料)
- 主要材料价格波动
- 供应链重组
- 生产成本影响
- 需求面影响(客户成本)
- 价格传导至终端市场
- 市占率动态
- 消费者反应模式
- 供应方影响(原料)
- 受影响的主要公司
- 策略产业反应
- 供应链重组
- 定价和产品策略
- 政策参与
- 展望与未来考虑
- 贸易影响
- 利润率分析
- 技术与创新格局
- 专利分析
- 用例
- 重要新闻和倡议
- 监管格局
- 衝击力
- 成长动力
- 快速数位转型
- 人工智慧和机器学习在业务流程中的集成
- 机器人流程自动化(RPA)的采用日益增多
- 云端采用和 SaaS 扩展
- 产业陷阱与挑战
- 实施成本高
- 资料隐私和安全问题
- 成长动力
- 成长潜力分析
- 波特的分析
- PESTEL分析
第四章:竞争格局
- 介绍
- 公司市占率分析
- 竞争定位矩阵
- 战略展望矩阵
第五章:市场估计与预测:按组件,2021 - 2034 年
- 主要趋势
- 解决方案
- 服务
- 专业服务
- 託管服务
第六章:市场估计与预测:依部署模型,2021 - 2034 年
- 主要趋势
- 基于云端
- 本地
第七章:市场估计与预测:依组织规模,2021 - 2034 年
- 主要趋势
- 大型企业
- 中小企业
第八章:市场估计与预测:按应用,2021 - 2034 年
- 主要趋势
- 商业智能
- 效能监控
- 风险与合规
- 销售和行销分析
- 营运管理
第九章:市场估计与预测:依最终用途,2021 - 2034 年
- 主要趋势
- 金融服务业
- 卫生保健
- 零售
- IT和电信
- 教育
- 製造业
- 运输与物流
- 其他的
第十章:市场估计与预测:按地区,2021 - 2034 年
- 主要趋势
- 北美洲
- 我们
- 加拿大
- 欧洲
- 英国
- 德国
- 法国
- 义大利
- 西班牙
- 俄罗斯
- 北欧人
- 亚太地区
- 中国
- 印度
- 日本
- 韩国
- 澳新银行
- 东南亚
- 拉丁美洲
- 巴西
- 墨西哥
- 阿根廷
- MEA
- 阿联酋
- 沙乌地阿拉伯
- 南非
第 11 章:公司简介
- Amazon Web Services (AWS)
- Alteryx
- Board International
- Domo
- Dundas BI
- IBM Corporation
- InetSoft Technology
- Infor Birst
- Microsoft Corporation
- MicroStrategy
- Oracle Corporation
- Qlik
- Salesforce
- SAP SE
- Sisense
- ThoughtSpot
- TIBCO Software
- Yellowfin
- Zoho Analytics
The Global Enterprise Data Visualization Platform Market was valued at USD 8.8 billion in 2024 and is estimated to grow at a CAGR of 14.1% to reach USD 27.7 billion by 2034, driven by the acceleration of digital transformation efforts and a rising demand for cloud-based analytics. As organizations increasingly focus on becoming data-centric, there's a notable shift toward tools that enable real-time, actionable insights. Businesses are moving away from static reporting and adopting dynamic platforms that foster agility, collaboration and informed decision-making. The integration of artificial intelligence and machine learning capabilities into visualization tools is further transforming them into engines of predictive insights and anomaly detection. These advancements allow enterprises to respond swiftly to shifting market conditions. Centralized systems now bridge fragmented data sources, improving visibility across departments and facilitating strategic initiatives. With cloud-native tools offering scalable and cost-effective solutions, enterprises are better equipped to adapt to evolving business environments, making data visualization a cornerstone of operational excellence and competitive growth.
In 2024, cloud-based platforms held 62% share and is forecasted to grow at a CAGR of 14.9% between 2025 and 2034. These platforms offer unmatched flexibility, supporting decentralized teams and dynamic business needs. Their ability to integrate quickly with various systems and provide on-demand insights make them the preferred choice for organizations seeking scalable, real-time analytics. With features like embedded analytics, AI-enhanced exploration, and auto-scaling, they deliver powerful performance without the complexity of traditional infrastructure.
| Market Scope | |
|---|---|
| Start Year | 2024 |
| Forecast Year | 2025-2034 |
| Start Value | $8.8 Billion |
| Forecast Value | $27.7 Billion |
| CAGR | 14.1% |
The solution segment held 63.3% share and will grow at 15% CAGR through 2034. These platforms blend deep analytics functionality with intuitive design, enabling users to drive both strategic and operational decisions. Often deployed in digital transformation projects, these solutions allow enterprises to streamline reporting, monitor operations, and gain customer insights using interactive models and pre-built templates. Low-code and no-code features enable broader user adoption, helping teams across departments create their dashboards, reduce IT dependency, and foster a data-first culture.
North America Enterprise Data Visualization Platform Market held 81.3% share and generated USD 10.5 billion in 2024. The market's growth is supported by a highly digitized ecosystem, widespread use of intelligence tools, and a strong presence of technology innovators. Companies continue to invest in advanced analytics and cloud platforms to drive operational agility and strategic alignment. The mature infrastructure and abundant data talent make it a prime hub for developing and deploying cutting-edge visualization technologies.
Key players driving innovation in the Global Enterprise Data Visualization Platform Market include Salesforce, MicroStrategy, Qlik, Amazon Web Services (AWS), Google, IBM Corporation, SAP SE, Microsoft Corporation, Domo, and Oracle Corporation. Leading companies in the enterprise data visualization platform market focus on innovation, cloud expansion, and AI integration to solidify their market position. Many are enhancing their platforms with AI-driven features such as predictive analytics, natural language processing, and automated anomaly detection to improve user experience and decision-making capabilities. Vendors are investing in cloud-native architectures and embedded analytics. Organizations prioritize ease of use by offering low-code customization and intuitive interfaces, enabling broader adoption across business units.
Table of Contents
Chapter 1 Methodology & Scope
- 1.1 Research design
- 1.1.1 Research approach
- 1.1.2 Data collection methods
- 1.2 Base estimates and calculations
- 1.2.1 Base year calculation
- 1.2.2 Key trends for market estimates
- 1.3 Forecast model
- 1.4 Primary research & validation
- 1.4.1 Primary sources
- 1.4.2 Data mining sources
- 1.5 Market definitions
Chapter 2 Executive Summary
- 2.1 Industry 3600 synopsis, 2021 - 2034
Chapter 3 Industry Insights
- 3.1 Industry ecosystem analysis
- 3.2 Supplier landscape
- 3.2.1 Technology providers
- 3.2.2 System integrators
- 3.2.3 Cloud and infrastructure providers
- 3.2.4 End use
- 3.3 Impact of Trump administration tariffs
- 3.3.1 Trade impact
- 3.3.1.1 Trade volume disruptions
- 3.3.1.2 Retaliatory measures
- 3.3.2 Impact on industry
- 3.3.2.1 Supply-side impact (raw materials)
- 3.3.2.1.1 Price volatility in key materials
- 3.3.2.1.2 Supply chain restructuring
- 3.3.2.1.3 Production cost implications
- 3.3.2.2 Demand-side impact (Cost to customers)
- 3.3.2.2.1 Price transmission to end markets
- 3.3.2.2.2 Market share dynamics
- 3.3.2.2.3 Consumer response patterns
- 3.3.2.1 Supply-side impact (raw materials)
- 3.3.3 Key companies impacted
- 3.3.4 Strategic industry responses
- 3.3.4.1 Supply chain reconfiguration
- 3.3.4.2 Pricing and product strategies
- 3.3.4.3 Policy engagement
- 3.3.5 Outlook & future considerations
- 3.3.1 Trade impact
- 3.4 Profit margin analysis
- 3.5 Technology & innovation landscape
- 3.6 Patent analysis
- 3.7 Use cases
- 3.8 Key news & initiatives
- 3.9 Regulatory landscape
- 3.10 Impact forces
- 3.10.1 Growth drivers
- 3.10.1.1 Rapid digital transformation
- 3.10.1.2 Integration of AI and machine learning in business processes
- 3.10.1.3 Growing adoption of Robotic Process Automation (RPA)
- 3.10.1.4 Cloud adoption and SaaS expansion
- 3.10.2 Industry pitfalls & challenges
- 3.10.2.1 High implementation costs
- 3.10.2.2 Data privacy and security concerns
- 3.10.1 Growth drivers
- 3.11 Growth potential analysis
- 3.12 Porter's analysis
- 3.13 PESTEL analysis
Chapter 4 Competitive Landscape, 2024
- 4.1 Introduction
- 4.2 Company market share analysis
- 4.3 Competitive positioning matrix
- 4.4 Strategic outlook matrix
Chapter 5 Market Estimates & Forecast, By Component, 2021 - 2034 ($Mn)
- 5.1 Key trends
- 5.2 Solution
- 5.3 Services
- 5.3.1 Professional services
- 5.3.2 Managed services
Chapter 6 Market Estimates & Forecast, By Deployment Model, 2021 - 2034 ($Mn)
- 6.1 Key trends
- 6.2 Cloud-based
- 6.3 On-premises
Chapter 7 Market Estimates & Forecast, By Organization Size, 2021 - 2034 ($Mn)
- 7.1 Key trends
- 7.2 Large Enterprise
- 7.3 SME
Chapter 8 Market Estimates & Forecast, By Application, 2021 - 2034 ($Mn)
- 8.1 Key trends
- 8.2 Business intelligence
- 8.3 Performance monitoring
- 8.4 Risk and compliance
- 8.5 Sales and marketing analytics
- 8.6 Operations management
Chapter 9 Market Estimates & Forecast, By End Use, 2021 - 2034 ($Mn)
- 9.1 Key trends
- 9.2 BFSI
- 9.3 Healthcare
- 9.4 Retail
- 9.5 IT & telecom
- 9.6 Education
- 9.7 Manufacturing
- 9.8 Transportation & logistics
- 9.9 Others
Chapter 10 Market Estimates & Forecast, By Region, 2021 - 2034 ($Mn)
- 10.1 Key trends
- 10.2 North America
- 10.2.1 U.S.
- 10.2.2 Canada
- 10.3 Europe
- 10.3.1 UK
- 10.3.2 Germany
- 10.3.3 France
- 10.3.4 Italy
- 10.3.5 Spain
- 10.3.6 Russia
- 10.3.7 Nordics
- 10.4 Asia Pacific
- 10.4.1 China
- 10.4.2 India
- 10.4.3 Japan
- 10.4.4 South Korea
- 10.4.5 ANZ
- 10.4.6 Southeast Asia
- 10.5 Latin America
- 10.5.1 Brazil
- 10.5.2 Mexico
- 10.5.3 Argentina
- 10.6 MEA
- 10.6.1 UAE
- 10.6.2 Saudi Arabia
- 10.6.3 South Africa
Chapter 11 Company Profiles
- 11.1 Amazon Web Services (AWS)
- 11.2 Alteryx
- 11.3 Board International
- 11.4 Domo
- 11.5 Dundas BI
- 11.6 Google
- 11.7 IBM Corporation
- 11.8 InetSoft Technology
- 11.9 Infor Birst
- 11.10 Microsoft Corporation
- 11.11 MicroStrategy
- 11.12 Oracle Corporation
- 11.13 Qlik
- 11.14 Salesforce
- 11.15 SAP SE
- 11.16 Sisense
- 11.17 ThoughtSpot
- 11.18 TIBCO Software
- 11.19 Yellowfin
- 11.20 Zoho Analytics
 人工智慧心智图工具市场:按部署类型、定价模式、技术组件、应用、部署模式和组织规模划分,全球预测,2026-2032年
 感测器资料分析市场分析及预测(至2035年):按类型、产品类型、服务、技术、组件、应用、设备、最终用户和部署类型划分
 数据驱动型市场-全球产业规模、份额、趋势、机会及预测(按类型、应用、垂直产业、地区及竞争格局划分,2021-2031年)AI智慧型视觉化网关市场按产品类型、部署类型、最终用户、应用和分销管道划分 - 全球预测(2026-2032年)人工智慧感测器市场:按感测器类型、技术、应用和最终用户划分,全球预测(2026-2032年)感测器资料分析市场:2026-2032年全球预测(按感测器类型、技术、部署类型、应用和最终用户划分)
 数据市场-2026-2031年预测人工智慧感测器市场-全球产业规模、份额、趋势、机会及预测(按类型、技术、应用、区域及竞争格局划分,2021-2031年预测)
 感测器资料分析市场规模、份额和成长分析(按组件、模型、分析方法、服务、应用、最终用途和地区划分)-2026-2033年产业预测
 供应链视觉化软体市场机会、成长驱动因素、产业趋势分析及预测(2026-2035年)