


 |
市场调查报告书
商品编码
1755361
发电碳捕获与封存市场机会、成长动力、产业趋势分析及 2025 - 2034 年预测Power Generation Carbon Capture and Storage Market Opportunity, Growth Drivers, Industry Trend Analysis, and Forecast 2025 - 2034 |
||||||
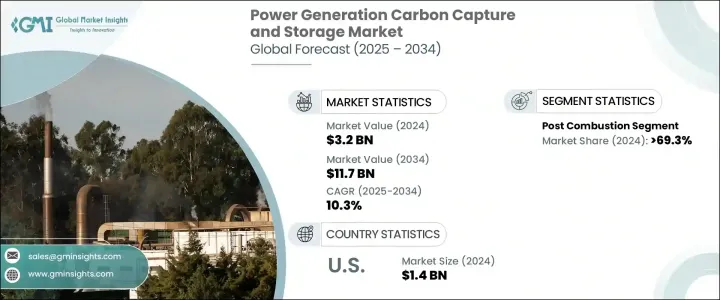
2024年,全球发电碳捕集与封存市场规模达32亿美元,预计2034年将以10.3%的复合年增长率成长,达到117亿美元。这得归功于日益严格的环境法规,这些法规要求减少发电厂的温室气体排放。世界各国政府对高碳排放企业处以重罚,推动企业采用CCS技术,以达成环保目标。随着各国加大对实现净零排放的承诺,CCS已成为向清洁能源转型的重要工具,为发电厂提供了一种在持续生产能源的同时减少碳足迹的途径。
CCS技术使电力公司能够在维持能源生产的同时降低排放,从而吸引具有环保意识的投资者和消费者。这一趋势符合全球气候协议,并体现了对永续发展的承诺。 CCS与再生能源的结合,能够在不损害环境影响的情况下实现稳定发电。例如,燃烧前CCS预计将实现显着成长,为在化石燃料燃烧前减少排放提供了一种创新方法。
| 市场范围 | |
|---|---|
| 起始年份 | 2024 |
| 预测年份 | 2025-2034 |
| 起始值 | 32亿美元 |
| 预测值 | 117亿美元 |
| 复合年增长率 | 10.3% |
预计到2034年,发电业碳捕获与封存市场中的燃烧前部分将以6%的复合年增长率成长。这项技术能够将化石燃料转化为富氢气体,用于发电或其他工业製程。美国一直积极参与碳捕获与封存(CCS)的推广,政府为开发旨在减少碳排放的封存设施和技术提供激励措施。
2024年,美国发电业碳捕集与封存市场产值达14亿美元,并受惠于政府奖励措施以及不断增加的燃煤和燃气发电厂减排力道。政府已推出多项措施和财政支援机制,鼓励采用更清洁的技术,包括碳捕集与封存 (CCS) 解决方案。这些激励措施不仅提高了电力公司采用CCS的财务可行性,也符合减少温室气体排放、应对气候变迁的更广泛目标。因此,美国公用事业公司正在大力投资CCS技术,以实现基础设施现代化,并满足更严格的环境标准。
全球发电碳捕获与封存市场的主要参与者包括 Aker Solutions、Equinor ASA、埃克森美孚公司、福陆公司、通用电气、三菱重工有限公司、NRG Energy, Inc.、壳牌 CANSOLV、西门子和林德公司等。为了巩固其在发电碳捕获与封存市场的地位,各公司正大力投资创新的 CCS 技术,专注于提高效率并降低碳捕获成本。与政府机构和能源公司的策略合作正变得越来越普遍,以确保为大型 CCS 专案提供资金。一些公司还在开发和部署燃烧前和燃烧后捕获系统,这些系统可以整合到现有的发电厂中,为减少排放提供可扩展的解决方案。
目录
第一章:方法论与范围
第二章:执行摘要
第三章:行业洞察
- 产业生态系统分析
- 川普政府关税分析
- 对贸易的影响
- 贸易量中断
- 报復措施
- 对产业的影响
- 供给侧影响(原料)
- 主要材料价格波动
- 供应链重组
- 生产成本影响
- 需求面影响(售价)
- 价格传导至终端市场
- 市占率动态
- 消费者反应模式
- 供给侧影响(原料)
- 受影响的主要公司
- 策略产业反应
- 供应链重组
- 定价和产品策略
- 政策参与
- 对贸易的影响
- 展望与未来考虑
- 产业衝击力
- 成长动力
- 产业陷阱与挑战
- 成长潜力分析
- 波特的分析
- PESTEL分析
第四章:竞争格局
- 介绍
- 公司市占率
- 战略仪表板
- 策略倡议
- 竞争基准测试
- 创新与永续发展格局
第五章:市场规模及预测:依技术分类,2021 - 2034 年
- 主要趋势
- 预燃烧
- 后燃烧
- 富氧燃烧
第六章:市场规模及预测:依地区,2021 - 2034
- 主要趋势
- 北美洲
- 我们
- 加拿大
- 欧洲
- 挪威
- 荷兰
- 英国
- 亚太地区
- 中国
- 韩国
- 澳洲
- 世界其他地区
第七章:公司简介
- Air Liquide
- Linde plc
- Global Thermostat
- General Electric
- Siemens
- Aker Solutions
- HALLIBURTON
- SLB
- Exxon Mobil Corporation
- Shell CANSOLV
- Mitsubishi Heavy Industries Ltd.
- Dakota Gasification Company
- NRG Energy, Inc.
- Fluor Corporation
- Sulzer Ltd
- Equinor ASA
The Global Power Generation Carbon Capture and Storage Market was valued at USD 3.2 billion in 2024 and is estimated to grow at a CAGR of 10.3% to reach USD 11.7 billion by 2034, driven by the increasing implementation of stringent environmental regulations that mandate the reduction of greenhouse gas emissions from power plants. Governments worldwide enforce heavy penalties for high carbon emissions, pushing the adoption of CCS technologies to help companies meet their environmental goals. As nations ramp up their commitments to achieving net-zero emissions, CCS has become an essential tool in the transition towards cleaner energy sources, providing a way for power plants to continue producing energy while reducing their carbon footprint.
CCS technologies enable power companies to lower their emissions while maintaining energy production, making them attractive to environmentally conscious investors and consumers. This trend aligns with global climate agreements and demonstrates a commitment to sustainability. The combination of CCS with renewable energy allows for stable power generation without compromising environmental impact. Pre-combustion CCS, for example, is expected to see significant growth, offering an innovative method for reducing emissions before fossil fuels are burned.
| Market Scope | |
|---|---|
| Start Year | 2024 |
| Forecast Year | 2025-2034 |
| Start Value | $3.2 Billion |
| Forecast Value | $11.7 Billion |
| CAGR | 10.3% |
The pre-combustion segment in the power generation carbon capture and storage market is projected to grow at a CAGR of 6% by 2034. This technology enables the conversion of fossil fuels into a hydrogen-rich gas that can be used in power generation or other industrial processes. The United States has been actively involved in adopting CCS, with the government offering incentives for the development of storage facilities and technologies aimed at reducing carbon emissions.
United States Power Generation Carbon Capture and Storage Market generated USD 1.4 billion in 2024 and is benefiting significantly from a combination of government incentives and growing efforts to reduce emissions from coal and gas power plants. The government has introduced several initiatives and financial support mechanisms to encourage the adoption of cleaner technologies, including carbon capture and storage (CCS) solutions. These incentives not only make CCS more financially viable for power companies but also align with the broader goals of reducing greenhouse gas emissions to combat climate change. As a result, utilities in the U.S. are investing heavily in CCS technology to modernize their infrastructure and meet stricter environmental standards.
Key players in the Global Power Generation Carbon Capture and Storage Market include Aker Solutions, Equinor ASA, Exxon Mobil Corporation, Fluor Corporation, General Electric, Mitsubishi Heavy Industries Ltd., NRG Energy, Inc., Shell CANSOLV, Siemens, and Linde plc, among others. To strengthen their position in the power generation carbon capture and storage market, companies are investing heavily in innovative CCS technologies, focusing on improving efficiency and reducing the cost of carbon capture. Strategic collaborations with government entities and energy companies are becoming more common to secure funding for large-scale CCS projects. Several companies are also developing and deploying pre-combustion and post-combustion capture systems, which can be integrated into existing power plants, offering a scalable solution for reducing emissions.
Table of Contents
Chapter 1 Methodology & Scope
- 1.1 Market definition
- 1.2 Base estimates & calculations
- 1.3 Forecast calculation
- 1.4 Data source
- 1.4.1 Primary
- 1.4.2 Secondary
- 1.4.2.1 Paid
- 1.4.2.2 Public
Chapter 2 Executive Summary
- 2.1 Industry synopsis, 2021 - 2034
Chapter 3 Industry Insights
- 3.1 Industry ecosystem analysis
- 3.2 Trump administration tariffs analysis
- 3.2.1 Impact on trade
- 3.2.1.1 Trade volume disruptions
- 3.2.1.2 Retaliatory measures
- 3.2.2 Impact on the industry
- 3.2.2.1 Supply-side impact (raw materials)
- 3.2.2.1.1 Price volatility in key materials
- 3.2.2.1.2 Supply chain restructuring
- 3.2.2.1.3 Production cost implications
- 3.2.2.2 Demand-side impact (selling price)
- 3.2.2.2.1 Price transmission to end markets
- 3.2.2.2.2 Market share dynamics
- 3.2.2.2.3 Consumer response patterns
- 3.2.2.1 Supply-side impact (raw materials)
- 3.2.3 Key companies impacted
- 3.2.4 Strategic industry responses
- 3.2.4.1 Supply chain reconfiguration
- 3.2.4.2 Pricing and product strategies
- 3.2.4.3 Policy engagement
- 3.2.1 Impact on trade
- 3.3 Outlook and future considerations
- 3.4 Industry impact forces
- 3.4.1 Growth drivers
- 3.4.2 Industry pitfalls & challenges
- 3.5 Growth potential analysis
- 3.6 Porter's analysis
- 3.6.1 Bargaining power of suppliers
- 3.6.2 Bargaining power of buyers
- 3.6.3 Threat of new entrants
- 3.6.4 Threat of substitutes
- 3.7 PESTEL analysis
Chapter 4 Competitive landscape, 2024
- 4.1 Introduction
- 4.2 Company market share
- 4.3 Strategic dashboard
- 4.4 Strategic initiative
- 4.5 Competitive benchmarking
- 4.6 Innovation & sustainability landscape
Chapter 5 Market Size and Forecast, By Technology, 2021 - 2034 (MTPA, USD Billion)
- 5.1 Key trends
- 5.2 Pre-combustion
- 5.3 Post combustion
- 5.4 Oxy-fuel combustion
Chapter 6 Market Size and Forecast, By Region, 2021 - 2034 (MTPA, USD Billion)
- 6.1 Key trends
- 6.2 North America
- 6.2.1 U.S.
- 6.2.2 Canada
- 6.3 Europe
- 6.3.1 Norway
- 6.3.2 Netherlands
- 6.3.3 UK
- 6.4 Asia Pacific
- 6.4.1 China
- 6.4.2 South Korea
- 6.4.3 Australia
- 6.5 Rest of the World
Chapter 7 Company Profiles
- 7.1 Air Liquide
- 7.2 Linde plc
- 7.3 Global Thermostat
- 7.4 General Electric
- 7.5 Siemens
- 7.6 Aker Solutions
- 7.7 HALLIBURTON
- 7.8 SLB
- 7.9 Exxon Mobil Corporation
- 7.10 Shell CANSOLV
- 7.11 Mitsubishi Heavy Industries Ltd.
- 7.12 Dakota Gasification Company
- 7.13 NRG Energy, Inc.
- 7.14 Fluor Corporation
- 7.15 Sulzer Ltd
- 7.16 Equinor ASA
 2026年全球二氧化碳捕集与储存市场报告2026年全球二氧化碳捕集与封存(CCS)市场报告
 全球工业脱碳技术市场预测(至2034年):按类型、组件、资金来源、部署模式、应用、最终用户和地区划分
 日本二氧化碳捕集与储存(CCS)市场:规模、份额、趋势和预测:按服务、技术、最终用途行业和地区划分,2026-2034年
 全球捕碳封存(CCS)市场:市场规模、份额、趋势分析(按捕获技术、应用和地区划分)、细分市场预测,2025-2033年捕碳封存(CCS)市场预测至2032年:按服务类型、储存类型、技术、应用、最终用户和地区分類的全球分析
 2025 年至 2032 年发电领域 CCS 市场(按技术类型、撷取方法、工厂类型、计划规模和部署模型划分)全球预测捕碳封存市场(按服务、技术、最终用途产业及储存类型)-2025-2030 年全球预测
 全球发电捕碳封存市场
 碳捕获与储存(CCS):市场份额分析、产业趋势、统计和成长预测(2025-2030 年)