


 |
市场调查报告书
商品编码
1755366
饮料调味系统市场机会、成长动力、产业趋势分析及 2025 - 2034 年预测Beverage Flavoring System Market Opportunity, Growth Drivers, Industry Trend Analysis, and Forecast 2025 - 2034 |
||||||
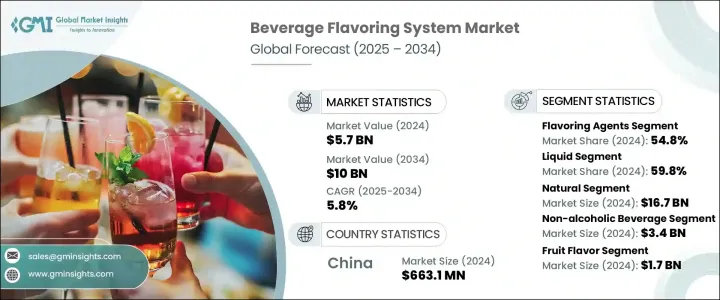
2024年,全球饮料调味系统市场规模达57亿美元,预计2034年将以5.8%的复合年增长率成长,达到100亿美元。受消费者偏好变化、技术创新以及饮料应用日益多样化的推动,该市场正经历着一场充满活力的变革。随着饮料生产商努力提升产品吸引力并打造差异化产品,调味系统已成为提供一致的口感、香气和视觉衝击力的关键要素。饮料行业的每个类别——无论是软性饮料、功能性饮料还是乳製饮料——都高度依赖客製化的调味系统来满足市场需求。
天然和清洁标籤调味解决方案正日益受到青睐,这反映出消费者对健康和保健意识的日益提升。消费者对植物基、非基因改造和有机来源的调味成分的偏好日益增长,促使製造商采用天然成分,例如植物浸液、精油和发酵香料。这些元素不仅符合当前的健康趋势,也支持更清晰的标籤,进一步引起当今知情消费者的共鸣。饮料调味系统市场的驱动力在于持续的创新、不断增加的研发活动以及全球调味品公司之间日益激烈的竞争。这些参与者正在与饮料品牌建立策略合作关係,并利用新的配方技术,创造独特的风味,在竞争激烈的市场中脱颖而出。
| 市场范围 | |
|---|---|
| 起始年份 | 2024 |
| 预测年份 | 2025-2034 |
| 起始值 | 57亿美元 |
| 预测值 | 100亿美元 |
| 复合年增长率 | 5.8% |
按成分类型划分,调味剂在2024年占据54.8%的市场份额,占据该细分市场的主导地位,预计到2034年将以5.7%的复合年增长率增长。调味剂在业界的优势源于其在塑造饮料感官特性方面发挥的重要作用。这些调味料对于提供标誌性的口味体验、满足消费者对真实性的需求以及提升产品形象至关重要。随着人们对新颖天然口味选择的需求不断增长,调味剂在传统和新兴饮料形式中都得到了广泛的应用。
就形态而言,液体香精在2024年占据最大份额,达到59.8%,预计将维持5.7%的复合年增长率。液体香精系统的成功很大程度上归功于其易于整合、配方分布均匀以及成本效益。其高适应性使製造商能够快速回应不断变化的香精趋势,简化生产流程并降低营运成本。无论是大规模生产或小批量生产,液体香精系统都能提供无与伦比的一致性和加工效率。
按来源细分,天然香料市场表现突出,2024 年估值高达 167 亿美元。这一主导地位反映出注重健康的清洁标籤饮料日益受到青睐。随着消费者对合成成分日益谨慎,天然香料因其透明度、真实性和可感知的健康益处而备受青睐。饮料生产商正在改进产品配方,强调自然宣称,以吸引註重健康的消费者。儘管面临成本和原料采购方面的挑战,天然香料在高端和功能性饮料类别中尤其受到青睐,巩固了其领先的市场地位。
从饮料类型来看,非酒精饮料成为最大的贡献者,2024 年市场规模达 34 亿美元。该细分市场的强劲成长得益于其较高的日均消费量、丰富的产品种类以及广泛的消费者群体。从补水产品到能量提升配方,非酒精饮料类别始终需要创新的风味解决方案来维持消费者的兴趣。另一方面,酒精饮料虽然市场规模较小,但由于消费者对高端风味酒精饮料的需求不断增长,其市场规模也显着增长。
就风味类型而言,水果风味占据主导地位,2024 年市场规模达 17 亿美元。由于其与健康的天然关联、与各种饮料的广泛兼容性以及成本效益,水果风味将继续占据主导地位。水果风味用途广泛,既可单独使用,也可进行复杂的混合,因此深受致力于提供独特清新口味体验的製造商的青睐。
从区域来看,中国在亚太地区饮料调味系统市场中处于领先地位,2024 年市场价值达 6.631 亿美元,预计到 2034 年复合年增长率将达到 5.6%。中国庞大的消费群体、城市扩张以及对调味和功能性饮料日益增长的需求,共同推动着这一成长。强大的国内製造能力和良好的食品安全法规进一步巩固了中国的地位。随着消费者需求持续转向健康、风味浓郁的饮料,中国仍将是该地区创新和生产的中心。
全球调味系统供应商正利用其技术专长、丰富的产品线和广泛的分销网络来满足日益增长的需求。他们的竞争优势在于能够快速适应、大力投资创新,并在多个地区提供一致的品质。
目录
第一章:方法论
- 市场范围和定义
- 研究设计
- 研究方法
- 资料收集方法
- 资料探勘来源
- 全球的
- 地区/国家
- 基础估算与计算
- 基准年计算
- 市场评估的主要趋势
- 初步研究和验证
- 主要来源
- 预测模型
- 研究假设和局限性
第二章:执行摘要
第三章:行业洞察
- 产业生态系统分析
- 供应商格局
- 利润率
- 每个阶段的增值
- 影响价值链的因素
- 中断
- 产业衝击力
- 成长动力
- 产业陷阱与挑战
- 市场机会
- 成长潜力分析
- 监管格局
- 北美洲
- 欧洲
- 亚太地区
- 拉丁美洲
- 中东和非洲
- 波特的分析
- PESTEL分析
- 价格趋势
- 按地区
- 按产品
- 未来市场趋势
- 科技与创新格局
- 当前的技术趋势
- 新兴技术
- 专利态势
- 贸易统计资料(HS 编码)(註:仅提供重点国家的贸易统计资料)
- 主要进口国
- 主要出口国
- 永续性和环境方面
- 永续实践
- 减少废弃物的策略
- 生产中的能源效率
- 环保倡议
- 新兴趋势与未来展望
- 技术创新
- 人工智慧和机器学习在风味开发的应用
- 先进的封装技术
- 生物技术在风味生产的应用
- 消费者偏好的演变
- 清洁标籤运动
- 功能性香料
- 全球和异国风味
- 健康与保健趋势
- 减糖解决方案
- 增强免疫力的口味
- 适应原和益智口味
- 个性化和客製化
- 香精香料产业的数位转型
- 与其他饮料类别的整合
- 植物饮料
- 低酒精/无酒精饮料
- 功能性饮料
- 未来市场潜力
- 投资机会
- 技术创新
第四章:竞争格局
- 介绍
- 公司市占率分析
- 按地区
- 北美洲
- 欧洲
- 亚太地区
- 拉丁美洲
- MEA
- 按地区
- 公司矩阵分析
- 主要市场参与者的竞争分析
- 竞争定位矩阵
- 关键进展
- 併购
- 伙伴关係与合作
- 新产品发布
- 扩张计划
第五章:市场估计与预测:依成分类型,2021 - 2034 年
- 主要趋势
- 调味剂
- 天然香料
- 水果口味
- 植物风味
- 香料和香草口味
- 坚果和种子口味
- 其他的
- 人工香料
- 水果模仿者
- 甜味
- 咸味
- 其他的
- 与天然相同的口味
- 天然香料
- 风味载体
- 丙二醇
- 乙醇
- 植物油
- 其他的
- 增味剂
- 酸化剂
- 甜味剂
- 其他的
- 风味改良剂
第六章:市场估计与预测:依形式,2021 - 2034 年
- 主要趋势
- 液体
- 乳液
- 解决方案
- 暂停
- 干燥
- 喷雾干燥
- 冷冻干燥
- 胶囊
- 其他的
第七章:市场估计与预测:按来源,2021 - 2034 年
- 主要趋势
- 自然的
- 植物基
- 动物源性
- 人造的
- 自然同一性
第八章:市场估计与预测:依饮料类型,2021 - 2034 年
- 主要趋势
- 酒精饮料
- 啤酒
- 葡萄酒
- 烈酒
- 即饮(RTD)酒精饮料
- 其他的
- 非酒精饮料
- 碳酸软性饮料
- 果汁和花蜜
- 能量饮料
- 运动饮料
- 即饮茶和咖啡
- 调味水
- 乳製品饮料
- 植物饮料
- 其他的
第九章:市场预估与预测:依口味类型,2021 - 2034
- 主要趋势
- 水果口味
- 莓果
- 柑橘
- 热带
- 核果
- 其他的
- 巧克力和香草
- 咖啡和茶
- 香料和草药
- 花香
- 坚果和种子口味
- 薄荷和薄荷醇
- 甜味
- 咸味
- 其他的
第十章:市场估计与预测:按地区,2021 - 2034 年
- 主要趋势
- 北美洲
- 我们
- 加拿大
- 欧洲
- 德国
- 英国
- 法国
- 义大利
- 西班牙
- 欧洲其他地区
- 亚太地区
- 中国
- 印度
- 日本
- 澳洲
- 韩国
- 亚太其他地区
- 拉丁美洲
- 巴西
- 墨西哥
- 阿根廷
- 拉丁美洲其他地区
- 中东和非洲
- 沙乌地阿拉伯
- 南非
- 阿联酋
- 中东和非洲其他地区
第 11 章:公司简介
- Givaudan SA
- International Flavors & Fragrances Inc. (IFF)
- DSM
- Symrise AG
- Sensient Technologies Corporation
- Kerry Group plc
- Archer Daniels Midland Company (ADM)
- Tate & Lyle PLC
- Cargill, Incorporated
- MANE SA
- McCormick & Company, Inc.
- Takasago International Corporation
- T. Hasegawa Co., Ltd.
- Robertet Group
- Kalsec Inc.
The Global Beverage Flavoring System Market was valued at USD 5.7 billion in 2024 and is estimated to grow at a CAGR of 5.8% to reach USD 10 billion by 2034. This market is undergoing a dynamic transformation fueled by evolving consumer preferences, innovative technologies, and the increasing diversity of beverage applications. As beverage producers strive to enhance product appeal and differentiate offerings, flavor systems have emerged as a critical component in delivering consistent taste, aroma, and visual impact. Every category within the beverage sector-whether it's soft drinks, functional beverages, or dairy-based drinks-relies heavily on tailored flavoring systems to meet market demands.
There is an ongoing shift towards natural and clean-label flavoring solutions, reflecting broader consumer awareness around health and wellness. The rising preference for plant-based, non-GMO, and organically sourced flavor ingredients is encouraging manufacturers to adopt natural components like botanical infusions, essential oils, and fermentation-derived flavors. These elements not only align with current health trends but also support clearer labeling, which further resonates with today's informed consumers. The beverage flavoring system market is driven by constant innovation, increased R&D activity, and heightened competition among global flavor houses. These players are forming strategic collaborations with beverage brands and leveraging new formulation technologies to create unique flavor profiles that stand out in a crowded marketplace.
| Market Scope | |
|---|---|
| Start Year | 2024 |
| Forecast Year | 2025-2034 |
| Start Value | $5.7 Billion |
| Forecast Value | $10 Billion |
| CAGR | 5.8% |
By ingredient type, flavoring agents led the segment with a commanding 54.8% market share in 2024 and are projected to grow at a CAGR of 5.7% through 2034. Their stronghold in the industry stems from their essential role in shaping the sensory characteristics of beverages. These agents are integral to delivering signature taste experiences, meeting consumer demand for authenticity, and elevating product identity. As the appetite for novel and natural taste options continues to grow, flavoring agents are seeing widespread application across both conventional and emerging beverage formats.
In terms of form, liquid forms accounted for the largest share at 59.8% in 2024 and are anticipated to maintain momentum with a 5.7% CAGR. The success of liquid flavor systems is largely due to their ease of integration, uniform distribution in formulations, and cost-effectiveness. Their adaptability allows manufacturers to respond quickly to changing flavor trends, streamline production processes, and reduce operational costs. Whether it's large-scale manufacturing or small-batch production, liquid flavor systems offer unmatched consistency and processing efficiency.
When segmented by origin, the natural flavor segment stood out with a significant valuation of USD 16.7 billion in 2024. This dominance reflects the increasing popularity of health-forward, clean-label beverages. As consumers grow more cautious about synthetic ingredients, natural flavors have gained favor for their transparency, authenticity, and perceived health benefits. Beverage producers are reformulating products to emphasize natural claims, appealing to the wellness-oriented segment. Despite challenges around cost and raw material sourcing, natural flavors are particularly favored in premium and functional beverage categories, reinforcing their leading market position.
Based on beverage type, non-alcoholic drinks emerged as the largest contributor, holding a market size of USD 3.4 billion in 2024. The strong presence of this segment is attributed to high daily consumption rates, product variety, and a broad consumer base. From hydration products to energy-enhancing formulations, the non-alcoholic category consistently demands innovative flavor solutions to maintain consumer interest. On the other hand, alcoholic beverages, though smaller in market size, are witnessing notable growth fueled by rising demand for premium, flavored alcoholic drinks.
Regarding flavor types, fruit flavors led the category, accounting for USD 1.7 billion in 2024. These flavors continue to dominate due to their natural association with wellness, wide compatibility with various beverage types, and cost-efficiency. The versatility of fruit flavors allows for both standalone applications and complex blends, making them a favorite among manufacturers aiming to deliver unique and refreshing taste experiences.
Regionally, China leads the Asia Pacific beverage flavoring system market with a market value of USD 663.1 million in 2024 and is projected to grow at a CAGR of 5.6% through 2034. The country's large consumer base, urban expansion, and increasing appetite for flavored and functional drinks are fueling this growth. Strong domestic manufacturing capabilities and favorable food safety regulations have further strengthened China's position. As consumer demand continues to shift toward health-conscious and flavor-rich beverage options, China remains a central hub for innovation and production in the region.
Global flavor system providers are leveraging their technical expertise, diverse product lines, and expansive distribution networks to tap into the growing demand. Their competitive edge lies in their ability to adapt quickly, invest heavily in innovation, and offer consistent quality across multiple regions.
Table of Contents
Chapter 1 Methodology
- 1.1 Market scope and definition
- 1.2 Research design
- 1.2.1 Research approach
- 1.2.2 Data collection methods
- 1.3 Data mining sources
- 1.3.1 Global
- 1.3.2 Regional/Country
- 1.4 Base estimates and calculations
- 1.4.1 Base year calculation
- 1.4.2 Key trends for market estimation
- 1.5 Primary research and validation
- 1.5.1 Primary sources
- 1.6 Forecast model
- 1.7 Research assumptions and limitations
Chapter 2 Executive Summary
- 2.1 Industry 3600 synopsis
- 2.2 Key market trends
- 2.2.1 Regional
- 2.2.2 Ingredient type
- 2.2.3 Form
- 2.2.4 Origin
- 2.2.5 Beverage type
- 2.2.6 Flavor type
- 2.3 TAM Analysis, 2025-2034
- 2.4 CXO perspectives: Strategic imperatives
- 2.4.1 Executive decision points
- 2.4.2 Critical success factors
- 2.5 Future Outlook and Strategic Recommendations
Chapter 3 Industry Insights
- 3.1 Industry ecosystem analysis
- 3.1.1 Supplier landscape
- 3.1.2 Profit margin
- 3.1.3 Value addition at each stage
- 3.1.4 Factor affecting the value chain
- 3.1.5 Disruptions
- 3.2 Industry impact forces
- 3.2.1 Growth drivers
- 3.2.2 Industry pitfalls and challenges
- 3.2.3 Market opportunities
- 3.3 Growth potential analysis
- 3.4 Regulatory landscape
- 3.4.1 North America
- 3.4.2 Europe
- 3.4.3 Asia Pacific
- 3.4.4 Latin America
- 3.4.5 Middle East & Africa
- 3.5 Porter's analysis
- 3.6 PESTEL analysis
- 3.6.1 Technology and innovation landscape
- 3.6.2 Current technological trends
- 3.6.3 Emerging technologies
- 3.7 Price trends
- 3.7.1 By region
- 3.7.2 By product
- 3.8 Future market trends
- 3.9 Technology and Innovation landscape
- 3.9.1 Current technological trends
- 3.9.2 Emerging technologies
- 3.10 Patent Landscape
- 3.11 Trade statistics (HS code) ( Note: the trade statistics will be provided for key countries only )
- 3.11.1 Major importing countries
- 3.11.2 Major exporting countries
- 3.12 Sustainability and environmental aspects
- 3.12.1 Sustainable practices
- 3.12.2 Waste reduction strategies
- 3.12.3 Energy efficiency in production
- 3.12.4 Eco-friendly initiatives
- 3.13 Emerging trends and future outlook
- 3.13.1 Technological innovations
- 3.13.1.1 Ai and machine learning in flavor development
- 3.13.1.2 Advanced encapsulation technologies
- 3.13.1.3 Biotechnology in flavor production
- 3.13.2 Consumer preference evolution
- 3.13.2.1 Clean label movement
- 3.13.2.2 Functional flavors
- 3.13.2.3 Global and exotic flavor profiles
- 3.13.3 Health and wellness trends
- 3.13.4 Sugar reduction solutions
- 3.13.5 Immunity-boosting flavors
- 3.13.6 Adaptogenic and nootropic flavors
- 3.13.7 Personalization and customization
- 3.13.8 Digital transformation in flavor industry
- 3.13.9 Integration with alternative beverage categories
- 3.13.9.1 Plant-based beverages
- 3.13.9.2 Low/no-alcohol beverages
- 3.13.9.3 Functional beverages
- 3.13.10 Future market potential
- 3.13.11 Investment opportunities
- 3.13.1 Technological innovations
Chapter 4 Competitive Landscape, 2024
- 4.1 Introduction
- 4.2 Company market share analysis
- 4.2.1 By region
- 4.2.1.1 North America
- 4.2.1.2 Europe
- 4.2.1.3 Asia Pacific
- 4.2.1.4 LATAM
- 4.2.1.5 MEA
- 4.2.1 By region
- 4.3 Company matrix analysis
- 4.4 Competitive analysis of major market players
- 4.5 Competitive positioning matrix
- 4.6 Key developments
- 4.6.1 Mergers & acquisitions
- 4.6.2 Partnerships & collaborations
- 4.6.3 New product launches
- 4.6.4 Expansion plans
Chapter 5 Market Estimates & Forecast, By Ingredient Type, 2021 - 2034 (USD Million) (Kilo Tons)
- 5.1 Key trend
- 5.2 Flavoring agents
- 5.2.1 Natural flavors
- 5.2.1.1 Fruit flavors
- 5.2.1.2 Botanical flavors
- 5.2.1.3 Spice and herb flavors
- 5.2.1.4 Nut and seed flavors
- 5.2.1.5 Others
- 5.2.2 Artificial flavors
- 5.2.2.1 Fruit mimics
- 5.2.2.2 Sweet flavors
- 5.2.2.3 Savory flavors
- 5.2.2.4 Others
- 5.2.3 Nature-identical flavors
- 5.2.1 Natural flavors
- 5.3 Flavor carriers
- 5.3.1 Propylene glycol
- 5.3.2 Ethanol
- 5.3.3 Vegetable oils
- 5.3.4 Others
- 5.4 Flavor enhancers
- 5.4.1 Acidulants
- 5.4.2 Sweeteners
- 5.4.3 Others
- 5.5 Flavor modifiers
Chapter 6 Market Estimates & Forecast, By Form, 2021 - 2034 (USD Million) (Kilo Tons)
- 6.1 Key trend
- 6.2 Liquid
- 6.2.1 Emulsions
- 6.2.2 Solutions
- 6.2.3 Suspensions
- 6.3 Dry
- 6.3.1 Spray-dried
- 6.3.2 Freeze-dried
- 6.3.3 Encapsulated
- 6.3.4 Others
Chapter 7 Market Estimates & Forecast, By Origin, 2021 - 2034 (USD Million) (Kilo Tons)
- 7.1 Key trend
- 7.2 Natural
- 7.2.1 Plant-based
- 7.2.2 Animal-derived
- 7.3 Artificial
- 7.4 Nature-identical
Chapter 8 Market Estimates & Forecast, By Beverage Type, 2021 - 2034 (USD Million) (Kilo Tons)
- 8.1 Key trend
- 8.2 Alcoholic beverages
- 8.2.1 Beer
- 8.2.2 Wine
- 8.2.3 Spirits
- 8.2.4 Ready-to-Drink (RTD) alcoholic beverages
- 8.2.5 Others
- 8.3 Non-alcoholic beverages
- 8.3.1 Carbonated soft drinks
- 8.3.2 Juices and nectars
- 8.3.3 Energy drinks
- 8.3.4 Sports drinks
- 8.3.5 Ready-to-Drink (RTD) tea and coffee
- 8.3.6 Flavored water
- 8.3.7 Dairy-based beverages
- 8.3.8 Plant-based beverages
- 8.3.9 Others
Chapter 9 Market Estimates & Forecast, By Flavor Type, 2021 - 2034 (USD Million) (Kilo Tons)
- 9.1 Key trend
- 9.2 Fruit flavors
- 9.2.1 Berries
- 9.2.2 Citrus
- 9.2.3 Tropical
- 9.2.4 Stone fruits
- 9.2.5 Others
- 9.3 Chocolate and vanilla
- 9.4 Coffee and tea
- 9.5 Spices and herbs
- 9.6 Floral flavors
- 9.7 Nut and seed flavors
- 9.8 Mint and menthol
- 9.9 Sweet flavors
- 9.10 Savory flavors
- 9.11 Others
Chapter 10 Market Estimates & Forecast, By Region, 2021 - 2034 (USD Million) (Kilo Tons)
- 10.1 Key trends
- 10.2 North America
- 10.2.1 U.S.
- 10.2.2 Canada
- 10.3 Europe
- 10.3.1 Germany
- 10.3.2 UK
- 10.3.3 France
- 10.3.4 Italy
- 10.3.5 Spain
- 10.3.6 Rest of Europe
- 10.4 Asia Pacific
- 10.4.1 China
- 10.4.2 India
- 10.4.3 Japan
- 10.4.4 Australia
- 10.4.5 South Korea
- 10.4.6 Rest of Asia Pacific
- 10.5 Latin America
- 10.5.1 Brazil
- 10.5.2 Mexico
- 10.5.3 Argentina
- 10.5.4 Rest of Latin America
- 10.6 Middle East & Africa
- 10.6.1 Saudi Arabia
- 10.6.2 South Africa
- 10.6.3 UAE
- 10.6.4 Rest of Middle East & Africa
Chapter 11 Company Profiles
- 11.1 Givaudan SA
- 11.2 International Flavors & Fragrances Inc. (IFF)
- 11.3 DSM
- 11.4 Symrise AG
- 11.5 Sensient Technologies Corporation
- 11.6 Kerry Group plc
- 11.7 Archer Daniels Midland Company (ADM)
- 11.8 Tate & Lyle PLC
- 11.9 Cargill, Incorporated
- 11.10 MANE SA
- 11.11 McCormick & Company, Inc.
- 11.12 Takasago International Corporation
- 11.13 T. Hasegawa Co., Ltd.
- 11.14 Robertet Group
- 11.15 Kalsec Inc.
 2026-2034年全球果味饮料化合物市场规模、份额、趋势和成长分析报告全球饮料调味料市场规模、份额、趋势和成长分析报告(2026-2034)全球饮料调味系统市场规模、份额、趋势和成长分析报告(2026-2034年)
 饮料调味系统市场-全球产业规模、份额、趋势、机会和预测(按成分、类型、原料、饮料、地区和竞争格局划分),2021-2031年
 饮料调味系统市场规模、份额和成长分析(按成分、饮料类型、口味、形态、产地和地区划分)—产业预测(2026-2033 年)全球饮料调味系统市场-2025-2030年预测
 全球饮料口味市场全球饮料调味系统市场规模(按类型、应用、来源、区域范围和预测)全球饮料调味系统市场