


 |
市场调查报告书
商品编码
1766306
商业及工业光电逆变器市场机会、成长动力、产业趋势分析及 2025 - 2034 年预测Commercial and Industrial PV Inverter Market Opportunity, Growth Drivers, Industry Trend Analysis, and Forecast 2025 - 2034 |
||||||
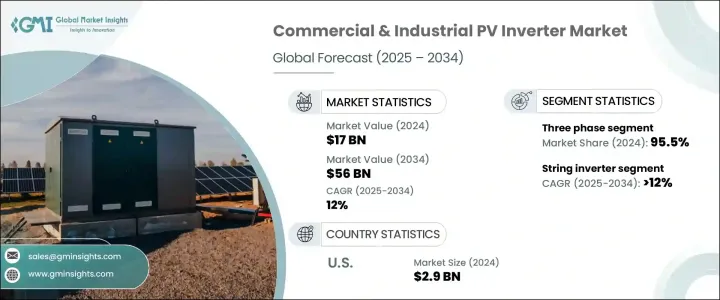
2024年,全球商业和工业光伏逆变器市场规模达170亿美元,预计到2034年将以12%的复合年增长率成长,达到560亿美元。推动这一成长的主要因素是电价不稳定性的加剧,促使企业寻求更可预测、更永续的能源。商业和工业设施正越来越多地转向太阳能光电系统,而逆变器在确保太阳能有效转换和融入日常营运方面发挥着至关重要的作用。这种转变的主要目的是降低营运成本、提高能源效率并满足日益严格的永续性标准。
随着商业建筑和製造部门的电力需求持续激增,太阳能逆变器已成为帮助企业优化能源消耗、管理尖峰负载和实现碳减排目标的重要工具。它们与建筑能源管理系统的整合正变得越来越普遍,这反映出对更智慧能源解决方案的需求日益增长。企业不仅受到节省成本的驱动,也面临越来越大的减少环境影响的压力,这进一步增强了对太阳能技术的需求。
| 市场范围 | |
|---|---|
| 起始年份 | 2024 |
| 预测年份 | 2025-2034 |
| 起始值 | 170亿美元 |
| 预测值 | 560亿美元 |
| 复合年增长率 | 12% |
全球各国政府和私营机构正在製定更积极的再生能源应用目标,进一步刺激光电逆变器的需求。这些目标得到了旨在加速向太阳能转型的有利法规和激励计划的支持。净计量和再生能源信用等政策持续为采用太阳能解决方案创造积极的商业案例,尤其是在商业和工业应用中。随着人们对气候变迁和能源安全的认识不断提高,越来越多的企业将能源独立放在首位,而逆变器正成为该策略的重要组成部分。此外,紧凑型、高效、低压逆变器系统的日益普及,使太阳能技术在更广泛的应用中更具可行性,帮助企业克服空间和基础设施的限制。这对于在城市地区营运的公司尤其重要,因为这些地区的房地产和安装空间都非常宝贵。
然而,贸易相关的挑战,尤其是对进口太阳能组件征收的关税,预计将对市场发展势头造成一些限制。太阳能设备采购成本的上升可能会推迟专案进度,并导致商业和工业开发商的预算超支。这些障碍也可能给供应链带来压力,尤其是在价格具有竞争力的高性能逆变器供应已经有限的情况下。儘管面临这些不利因素,但由于持续的创新和对工业级逆变器技术的投入,市场的整体前景仍然强劲。
根据产品类型,市场分为组串式逆变器、微型逆变器和集中式逆变器。预计到2034年,组串式逆变器市场的复合年增长率将超过12%。此类别的需求主要源于设计、效率和系统可扩展性的改进,使其成为商业屋顶和中型工业设施的首选。随着太阳能专案开发商寻求更灵活、更模组化的选择,组串式逆变器在各种部署规模中都越来越受欢迎。
就相位配置而言,商业和工业光伏逆变器市场分为单相和三相繫统。 2024年,三相逆变器占据了全球95.5%的市场份额,这得益于其在工厂综合体、仓库和多租户商业建筑等大型应用中的日益普及。三相逆变器在处理高功率负载方面效率更高,并且更适合与电网系统集成,这使其成为大规模安装的理想选择。
从区域来看,美国已成为关键市场,其商业和工业光伏逆变器产业规模将在2024年达到29亿美元,高于2023年的25亿美元和2022年的22亿美元。北美在2024年占据全球市场的17.3%,预计到预测期末这一比例将会上升。强大的国内製造基础和更快的交付速度,有助于加速逆变器在美国商业和工业设施中的应用。政府支持的推广清洁能源和奖励使用国产零件的措施也促进了市场的成长。
领先的製造商正在大力投资产能扩张、研发以及推出专为高性能应用而设计的先进逆变器。这些公司还透过策略合作伙伴关係和分销网络拓展其全球影响力,从而实现更快的回应时间和更优质的本地服务。与工程、采购和施工公司以及太阳能开发商的合作已变得十分普遍,尤其是在获得大型商业和工业专案方面。在具有高成长潜力的市场中,本地製造和支援服务仍然是关键的差异化因素。
目录
第一章:方法论与范围
第二章:执行摘要
第三章:行业洞察
- 产业生态系统
- 川普政府关税分析
- 对贸易的影响
- 贸易量中断
- 报復措施
- 对产业的影响
- 供应方影响(原料)
- 主要材料价格波动
- 供应链重组
- 生产成本影响
- 需求面影响(售价)
- 价格传导至终端市场
- 市占率动态
- 消费者反应模式
- 供应方影响(原料)
- 受影响的主要公司
- 策略产业反应
- 供应链重组
- 定价和产品策略
- 政策参与
- 展望与未来考虑
- 对贸易的影响
- 监管格局
- 产业衝击力
- 成长动力
- 产业陷阱与挑战
- 成长潜力分析
- 波特的分析
- PESTEL分析
第四章:竞争格局
- 介绍
- 公司市占率
- 战略仪表板
- 策略倡议
- 竞争基准测试
- 创新与永续发展格局
第五章:市场规模及预测:依产品,2021 - 2034
- 主要趋势
- 细绳
- 微
- 中央
第六章:市场规模及预测:依阶段,2021 - 2034
- 主要趋势
- 单相
- 三相
第七章:市场规模及预测:依连结性,2021 - 2034
- 主要趋势
- 独立
- 在电网上
第八章:市场规模及预测:按地区,2021 - 2034
- 主要趋势
- 北美洲
- 我们
- 加拿大
- 欧洲
- 德国
- 义大利
- 波兰
- 荷兰
- 奥地利
- 英国
- 法国
- 亚太地区
- 中国
- 澳洲
- 印度
- 日本
- 韩国
- 中东和非洲
- 以色列
- 沙乌地阿拉伯
- 阿联酋
- 南非
- 拉丁美洲
- 巴西
- 墨西哥
- 智利
第九章:公司简介
- Canadian Solar
- Delta Electronics
- Darfon Electronics
- Eaton
- Fimer Group
- Ginlong Technologies
- GoodWe
- Growatt New Energy
- Huawei Technologies
- Schneider Electric
- SMA Solar Technology
- Sungrow
- SolarEdge Technologies
- Sineng Electric
- Tabuchi Electric
The Global Commercial and Industrial PV Inverter Market was valued at USD 17 billion in 2024 and is estimated to grow at a CAGR of 12% to reach USD 56 billion by 2034. A major factor driving this growth is the rising instability in electricity prices, prompting businesses to seek more predictable and sustainable energy sources. Commercial and industrial facilities are increasingly turning to solar photovoltaic systems, with inverters playing a crucial role in ensuring the effective conversion and integration of solar energy into everyday operations. This shift is primarily aimed at reducing operational costs, improving energy efficiency, and meeting rising sustainability standards.
As power demands continue to surge across commercial buildings and manufacturing units, solar inverters have emerged as vital tools to help companies optimize their energy consumption, manage peak loads, and meet carbon reduction goals. Their integration with building energy management systems is becoming more common, reflecting the rising need for smarter energy solutions. Companies are not only driven by cost-saving motives but also by mounting pressure to reduce their environmental impact, which is reinforcing the demand for solar-based technologies.
| Market Scope | |
|---|---|
| Start Year | 2024 |
| Forecast Year | 2025-2034 |
| Start Value | $17 Billion |
| Forecast Value | $56 Billion |
| CAGR | 12% |
Governments and private organizations worldwide are setting more aggressive targets for renewable energy adoption, further fueling demand for PV inverters. These goals are supported by favorable regulations and incentive programs aimed at accelerating the shift to solar energy. Policies such as net metering and renewable energy credits continue to create a positive business case for adopting solar energy solutions, especially in commercial and industrial applications. As awareness of climate change and energy security rises, more enterprises are prioritizing energy independence, and inverters are becoming an essential part of that strategy. In addition, the growing availability of compact, high-efficiency, low-voltage inverter systems is making solar technology more viable for a wider range of applications, helping businesses overcome space and infrastructure limitations. This is particularly important for companies operating in urban areas where real estate and installation space come at a premium.
However, trade-related challenges, particularly tariffs imposed on imported solar components, are expected to pose some limitations on the market's momentum. Increased procurement costs for solar equipment can delay project timelines and result in budget overruns for commercial and industrial developers. These barriers could also strain the supply chain, especially when the availability of competitively priced high-performance inverters is already limited. Despite these headwinds, the overall outlook for the market remains strong due to consistent innovation and investments in inverter technology tailored for industrial-grade installations.
Based on product type, the market is divided into string, micro, and central inverters. The string inverter segment is projected to expand at a CAGR exceeding 12% through 2034. Demand for this category is primarily fueled by improvements in design, efficiency, and system scalability, making it a preferred choice for commercial rooftops and mid-sized industrial installations. As solar project developers seek more flexible and modular options, string inverters are becoming increasingly popular across various deployment scales.
In terms of phase configuration, the commercial and industrial PV inverter market is segmented into single phase and three phase systems. The three phase segment accounted for 95.5% of the global market share in 2024, supported by its growing use in large-scale applications such as factory complexes, warehouses, and multi-tenant commercial buildings. Three phase inverters are more efficient for handling high power loads and are better suited for integration with grid systems, which makes them ideal for large-scale installations.
Regionally, the United States has emerged as a key market, with its commercial and industrial PV inverter industry reaching USD 2.9 billion in 2024, up from USD 2.5 billion in 2023 and USD 2.2 billion in 2022. North America held a 17.3% share of the global market in 2024, and this is expected to increase by the end of the forecast period. A robust domestic manufacturing base and faster delivery timelines are helping to accelerate inverter adoption across commercial and industrial installations in the U.S. Market growth is also being reinforced by government-backed initiatives that promote clean energy and reward the use of domestically produced components.
Leading manufacturers are investing heavily in capacity expansion, research and development, and the launch of advanced inverters designed for high-performance applications. These companies are also extending their global reach through strategic partnerships and distribution networks that enable quicker response times and better local service. Collaborations with engineering, procurement, and construction firms, as well as solar developers, have become common, especially for securing large-scale commercial and industrial projects. Local manufacturing and support services continue to be key differentiators in markets with high growth potential.
Table of Contents
Chapter 1 Methodology & Scope
- 1.1 Research design
- 1.2 Base estimates & calculations
- 1.3 Forecast calculation
- 1.4 Primary research & validation
- 1.4.1 Primary sources
- 1.4.2 Data mining sources
- 1.5 Market definitions
Chapter 2 Executive Summary
- 2.1 Industry synopsis, 2021 - 2034
Chapter 3 Industry Insights
- 3.1 Industry ecosystem
- 3.2 Trump administration tariff analysis
- 3.2.1 Impact on trade
- 3.2.1.1 Trade volume disruptions
- 3.2.1.2 Retaliatory measures
- 3.2.2 Impact on the industry
- 3.2.2.1 Supply-side impact (raw materials)
- 3.2.2.1.1 Price volatility in key materials
- 3.2.2.1.2 Supply chain restructuring
- 3.2.2.1.3 Production cost implications
- 3.2.2.2 Demand-side impact (selling price)
- 3.2.2.2.1 Price transmission to end markets
- 3.2.2.2.2 Market share dynamics
- 3.2.2.2.3 Consumer response patterns
- 3.2.2.1 Supply-side impact (raw materials)
- 3.2.3 Key companies impacted
- 3.2.4 Strategic industry responses
- 3.2.4.1 Supply chain reconfiguration
- 3.2.4.2 Pricing and product strategies
- 3.2.4.3 Policy engagement
- 3.2.5 Outlook and future considerations
- 3.2.1 Impact on trade
- 3.3 Regulatory landscape
- 3.4 Industry impact forces
- 3.4.1 Growth drivers
- 3.4.2 Industry pitfalls & challenges
- 3.5 Growth potential analysis
- 3.6 Porter's analysis
- 3.6.1 Bargaining power of suppliers
- 3.6.2 Bargaining power of buyers
- 3.6.3 Threat of new entrants
- 3.6.4 Threat of substitutes
- 3.7 PESTEL analysis
Chapter 4 Competitive landscape, 2024
- 4.1 Introduction
- 4.2 Company market share
- 4.3 Strategic dashboard
- 4.4 Strategic initiative
- 4.5 Competitive benchmarking
- 4.6 Innovation & sustainability landscape
Chapter 5 Market Size and Forecast, By Product, 2021 - 2034 (USD Billion & MW)
- 5.1 Key trends
- 5.2 String
- 5.3 Micro
- 5.4 Central
Chapter 6 Market Size and Forecast, By Phase, 2021 - 2034 (USD Billion & MW)
- 6.1 Key trends
- 6.2 Single phase
- 6.3 Three phase
Chapter 7 Market Size and Forecast, By Connectivity, 2021 - 2034 (USD Billion & MW)
- 7.1 Key trends
- 7.2 Standalone
- 7.3 On grid
Chapter 8 Market Size and Forecast, By Region, 2021 - 2034 (USD Billion & MW)
- 8.1 Key trends
- 8.2 North America
- 8.2.1 U.S.
- 8.2.2 Canada
- 8.3 Europe
- 8.3.1 Germany
- 8.3.2 Italy
- 8.3.3 Poland
- 8.3.4 Netherlands
- 8.3.5 Austria
- 8.3.6 UK
- 8.3.7 France
- 8.4 Asia Pacific
- 8.4.1 China
- 8.4.2 Australia
- 8.4.3 India
- 8.4.4 Japan
- 8.4.5 South Korea
- 8.5 Middle East & Africa
- 8.5.1 Israel
- 8.5.2 Saudi Arabia
- 8.5.3 UAE
- 8.5.4 South Africa
- 8.6 Latin America
- 8.6.1 Brazil
- 8.6.2 Mexico
- 8.6.3 Chile
Chapter 9 Company Profiles
- 9.1 Canadian Solar
- 9.2 Delta Electronics
- 9.3 Darfon Electronics
- 9.4 Eaton
- 9.5 Fimer Group
- 9.6 Ginlong Technologies
- 9.7 GoodWe
- 9.8 Growatt New Energy
- 9.9 Huawei Technologies
- 9.10 Schneider Electric
- 9.11 SMA Solar Technology
- 9.12 Sungrow
- 9.13 SolarEdge Technologies
- 9.14 Sineng Electric
- 9.15 Tabuchi Electric
 全球商业和工业光伏逆变器市场全球工业中央光电逆变器市场全球中央光电逆变器市场
 2025年全球光电逆变器市场占有率报告
 全球太阳能逆变器市场:依类型、系统类型、阶段、最终用户和地区的机会与预测(2018-2032)高频太阳能光伏发电变频器的全球市场的评估:各相,各终端用户,各地区,机会,预测(2018年~2032年)
 高频太阳能逆变器市场-全球产业规模、份额、趋势、机会和预测,按产品类型、应用、功率等级、配销通路、地区和竞争进行细分,2020-2030 年预测光电逆变器市场机会、成长动力、产业趋势分析及2025-2034年预测
 2024-2035年全球太阳能光电逆变器产业併网光电逆变器市场机会、成长动力、产业趋势分析及 2025 - 2034 年预测