


 |
市场调查报告书
商品编码
1773357
指纹感应器市场机会、成长动力、产业趋势分析及 2025 - 2034 年预测Fingerprint Sensor Market Opportunity, Growth Drivers, Industry Trend Analysis, and Forecast 2025 - 2034 |
||||||
2024年,全球指纹感应器市场规模达42亿美元,预计2034年将以6.9%的复合年增长率成长,达到81亿美元。这一增长主要源于对安全生物识别验证的需求不断增长,以及消费者对无缝身份验证解决方案的日益青睐。随着数位安全日益融入日常生活,指纹感应器在便利性和可靠性之间实现了理想的平衡。感测器设计和性能的快速进步,正在提升各行业指纹认证的准确性和适应性。
从传统的电容式技术发展到更强大的超音波和光学感测器,消除了诸如指尖潮湿或污渍等常见的识别难题。例如,超音波指纹感应器依靠声波映射,具有更高的防伪性和精度。这些技术进步正在开启智慧型手机以外的全新应用,扩展到智慧卡、汽车系统和高安全性门禁控制领域。
| 市场范围 | |
|---|---|
| 起始年份 | 2024 |
| 预测年份 | 2025-2034 |
| 起始值 | 42亿美元 |
| 预测值 | 81亿美元 |
| 复合年增长率 | 6.9% |
指纹技术如今正被广泛应用于各种消费和商业产品中,包括笔记型电脑、支付终端、门锁和便携式电子设备。只需轻轻一触即可解锁装置或完成交易,这不仅符合人们对速度、安全性和隐私日益增长的期望,而且不会影响用户体验。製造商正顺应这一趋势,将指纹感测器嵌入下一代电子产品中,推动其广泛应用。
区域感测器和触控感测器领域占据市场主导地位,2024 年市场价值达 37 亿美元。其市场领先地位归功于卓越的扫描能力、始终如一的精度以及跨各种设备架构的兼容性。这些感测器凭藉其可靠性和易于整合的特点,广泛应用于个人和商业应用。由于对可扩展、经济高效的解决方案的需求强劲,尤其是在价格敏感或资源受限的地区,区域感测器和触控感测器仍然是首选。
2024年,行动和便携式指纹感应器市场规模达33亿美元。其受欢迎程度源自于消费性电子、金融服务和政府部门对快速、便利识别日益增长的需求。这些紧凑型感测器已将身份验证从静态环境转移到行动平台,支援从现场安全到基于应用程式的电子商务验证等各种操作。
2024年,美国指纹感应器市场规模达7.962亿美元。由于生物辨识技术在国防、执法和民用领域的广泛应用,美国持续引领全球指纹感应器的普及。在公共安全现代化、边境管理改进和数位身分识别项目方面的大量投资,巩固了指纹感测器在国家安全战略中的地位。目前,美国的国防和技术承包商正在将生物识别工具嵌入到安全通讯系统和用户身份验证设备中,从而将该技术的实用性扩展到传统应用之外。
推动全球指纹感测器产业创新并塑造竞争格局的关键参与者包括 Synaptics Incorporated、神盾科技股份有限公司、深圳市汇顶科技有限公司和高通技术有限公司。指纹感测器领域的竞争公司正致力于透过技术创新实现产品差异化。他们正在投资先进的感测器技术,例如超音波和光学解决方案,以提高准确性和环境适应性。
与原始设备製造商 (OEM) 的策略合作正成为优先事项,旨在将感测器整合到更广泛的终端设备中,例如智慧型穿戴装置、汽车仪表板和门禁系统。此外,许多公司正在透过提供针对行动和基础设施应用量身定制的经济高效、可扩展的解决方案,进军新兴市场。智慧财产权保护和研发扩张对于维持技术优势仍然至关重要,而参与生物辨识安全标准和合规框架则有助于增强信任和监管合规性。这些策略共同支持持续成长、提高市场渗透率和长期品牌权益。
目录
第一章:方法论与范围
第二章:执行摘要
第三章:行业洞察
- 产业生态系统分析
- 供应商格局
- 利润率
- 成本结构
- 每个阶段的增值
- 影响价值链的因素
- 中断
- 产业衝击力
- 成长动力
- 安全生物辨识认证需求不断成长
- 感测器技术的进步
- 与物联网(IOT)和智慧型设备的集成
- 政府措施和监管合规
- 消费者对便利性和使用者体验的偏好
- 产业陷阱与挑战
- 安全漏洞和欺骗风险
- 新兴应用程式中的整合和相容性限制
- 成长动力
- 成长潜力分析
- 监管格局
- 北美洲
- 欧洲
- 亚太地区
- 拉丁美洲
- 中东和非洲
- 波特的分析
- PESTEL分析
- 技术和创新格局
- 当前的技术趋势
- 新兴技术
- 新兴商业模式
- 合规性要求
- 永续性措施
- 消费者情绪分析
- 专利和智慧财产权分析
- 地缘政治与贸易动态
第四章:竞争格局
- 介绍
- 公司市占率分析
- 按地区
- 北美洲
- 欧洲
- 亚太地区
- 市场集中度分析
- 按地区
- 关键参与者的竞争基准
- 财务绩效比较
- 收入
- 利润率
- 研发
- 产品组合比较
- 产品范围广度
- 科技
- 创新
- 地理位置比较
- 全球足迹分析
- 服务网路覆盖
- 各地区市场渗透率
- 竞争定位矩阵
- 领导者
- 挑战者
- 追踪者
- 利基市场参与者
- 战略展望矩阵
- 财务绩效比较
- 2021-2024 年关键发展
- 併购
- 伙伴关係和合作
- 技术进步
- 扩张和投资策略
- 永续发展倡议
- 数位转型倡议
- 新兴/新创企业竞争对手格局
第五章:市场估计与预测:按感测器类型,2021 - 2034 年
- 主要趋势
- 区域和触控感应器
- 滑动感应器
第六章:市场估计与预测:依移动性,2021 - 2034 年
- 主要趋势
- 固定/指纹扫描仪
- 移动/便携
第七章:市场估计与预测:依最终用途,2021 - 2034 年
- 主要趋势
- 个人
- 金融服务业
- 卫生保健
- 零售与电子商务
- 汽车
- 政府和国防
- 其他的
第八章:市场估计与预测:按地区,2021 - 2034 年
- 主要趋势
- 北美洲
- 我们
- 加拿大
- 欧洲
- 德国
- 英国
- 法国
- 西班牙
- 义大利
- 荷兰
- 亚太地区
- 中国
- 印度
- 日本
- 澳洲
- 韩国
- 拉丁美洲
- 巴西
- 墨西哥
- 阿根廷
- 中东和非洲
- 沙乌地阿拉伯
- 南非
- 阿联酋
第九章:公司简介
- BioEnable
- Egis Technology Inc.
- Fingerprint Cards AB
- GigaDevice
- HID Global Corporation
- Holtek Semiconductor Inc.
- IDEX Biometrics ASA
- Mantra Softech
- Next Biometrics
- Qualcomm Technologies, Inc.
- SecuGen Corporation
- Shenzhen Goodix Technology Co., Ltd.
- SUPREMA
- Synaptics Incorporated
- Thales
- Xthings Inc.
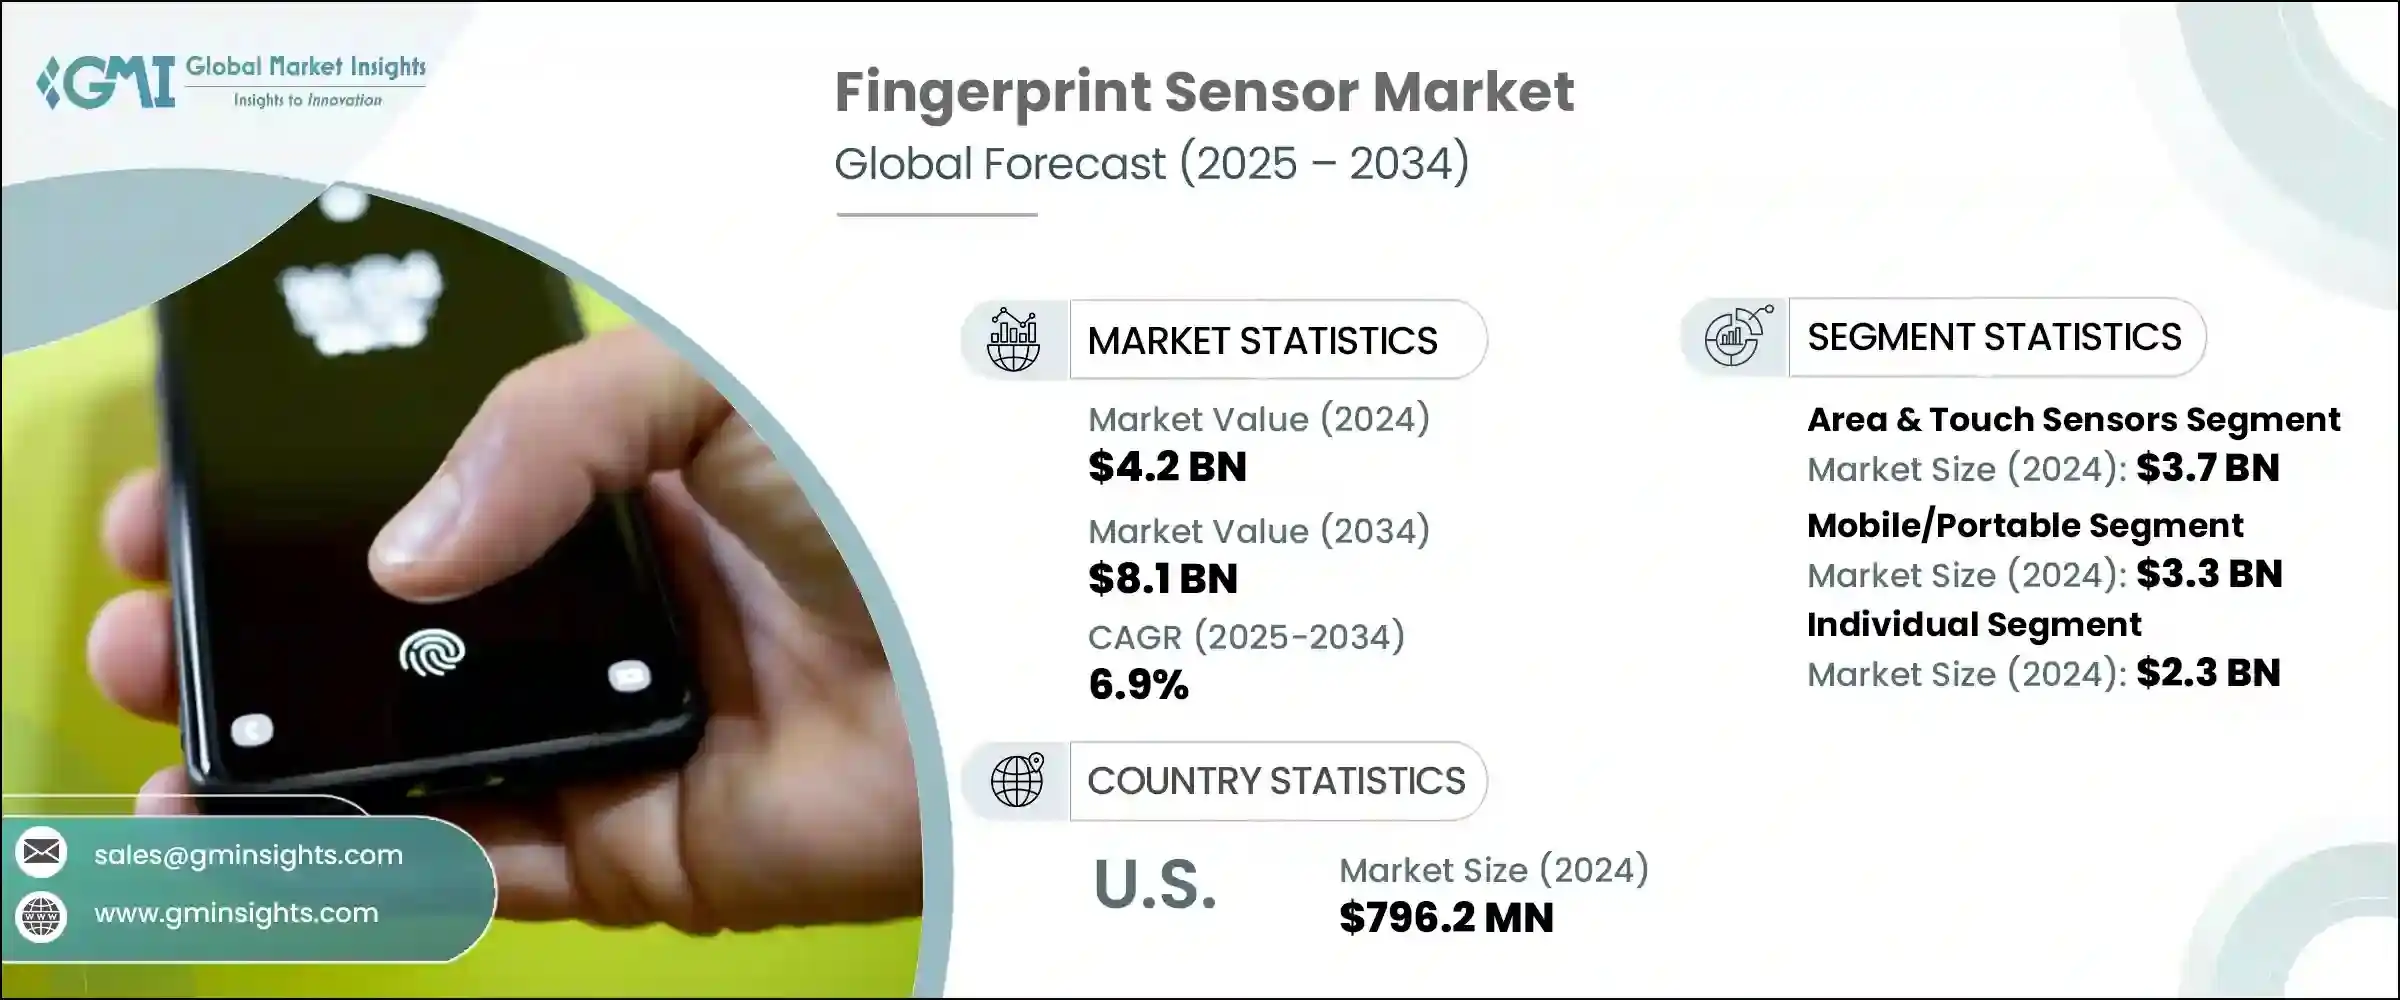
The Global Fingerprint Sensor Market was valued at USD 4.2 billion in 2024 and is estimated to grow at a CAGR of 6.9% to reach USD 8.1 billion by 2034. This growth is primarily fueled by rising demand for secure biometric verification and increasing consumer inclination toward seamless authentication solutions. As digital security becomes more embedded in daily life, fingerprint sensors offer the ideal balance of convenience and reliability. Rapid advancements in sensor design and performance are enhancing the accuracy and adaptability of fingerprint authentication across industries.
The evolution from traditional capacitive technologies to more robust ultrasonic and optical sensors has eliminated common identification challenges such as wet or smudged fingertips. Ultrasonic fingerprint sensors, for instance, rely on sound wave mapping, delivering higher spoof resistance and precision. These technological improvements are unlocking new applications beyond smartphones, extending into smart cards, automotive systems, and high-security access control.
| Market Scope | |
|---|---|
| Start Year | 2024 |
| Forecast Year | 2025-2034 |
| Start Value | $4.2 billion |
| Forecast Value | $8.1 billion |
| CAGR | 6.9% |
Fingerprint technology is now being integrated into a wide array of consumer and commercial products, including laptops, payment terminals, door locks, and portable electronics. The ability to unlock devices or complete transactions with a simple touch aligns with growing expectations for speed, security, and privacy without complicating the user experience. Manufacturers are embracing this trend by embedding fingerprint sensors into next-gen electronics, driving widespread adoption.
Area and touch sensors segment dominated the market with a value of USD 3.7 billion in 2024. Their market lead is attributed to superior scanning capabilities, consistent accuracy, and compatibility across various device architectures. These sensors are widely used in both personal and commercial applications due to their reliability and ease of integration. With strong demand from industries that require scalable, cost-efficient solutions, particularly in price-sensitive or resource-constrained regions, area and touch sensors remain a top choice.
The mobile and portable fingerprint sensor segment generated USD 3.3 billion in 2024. Their popularity stems from the growing need for fast, on-the-go identification across consumer electronics, financial services, and government sectors. These compact sensors have transitioned authentication from static environments to mobile platforms, supporting operations ranging from field-based security to app-based e-commerce verification.
U.S. Fingerprint Sensor Market was valued at USD 796.2 million in 2024. The country continues to lead global adoption, supported by the widespread use of biometrics in defense, law enforcement, and civilian sectors. Significant investments in public safety modernization, border management enhancements, and digital ID initiatives have cemented the role of fingerprint sensors in national security strategies. US-based defense and tech contractors are now embedding biometric tools into secured communications systems and user-authenticated devices, expanding the technology's utility beyond conventional use cases.
Key players driving innovation and shaping the competitive landscape in the Global Fingerprint Sensor Industry include Synaptics Incorporated, Egis Technology Inc., Shenzhen Goodix Technology Co., Ltd., and Qualcomm Technologies, Inc. Companies competing in the fingerprint sensor space are focusing heavily on product differentiation through technological innovation. They are investing in advanced sensor technologies like ultrasonic and optical-based solutions to improve accuracy and environmental adaptability.
Strategic collaborations with OEMs are being prioritized to integrate sensors into a wider variety of end-use devices such as smart wearables, automotive dashboards, and access control systems. Additionally, many are expanding into emerging markets by offering cost-effective, scalable solutions tailored for mobile and infrastructure applications. Intellectual property protection and R&D expansion remain critical to maintaining a technological edge, while participation in biometric security standards and compliance frameworks enhances trust and regulatory alignment. Together, these strategies support sustained growth, increased market penetration, and long-term brand equity.
Table of Contents
Chapter 1 Methodology and Scope
- 1.1 Market scope and definitions
- 1.2 Research design
- 1.2.1 Research approach
- 1.2.2 Data collection methods
- 1.3 Data mining sources
- 1.3.1 Global
- 1.3.2 Regional
- 1.4 Base estimates and calculations
- 1.4.1 Base year calculation
- 1.4.2 Key trends for market estimation
- 1.5 Primary research and validation
- 1.5.1 Primary sources
- 1.6 Forecast model
- 1.7 Research assumptions and limitations
Chapter 2 Executive Summary
- 2.1 Industry 3600 synopsis
- 2.2 Key market trends
- 2.2.1 Sensor type trends
- 2.2.2 Mobility trends
- 2.2.3 End use trends
- 2.2.4 Regional
- 2.3 TAM Analysis, 2025-2034 (USD Million)
- 2.4 CXO perspectives: strategic imperatives
- 2.4.1 Executive decision points
- 2.4.2 Critical success factors
- 2.5 Future outlook and strategic recommendations
Chapter 3 Industry Insights
- 3.1 Industry ecosystem analysis
- 3.1.1 Supplier landscape
- 3.1.2 Profit margin
- 3.1.3 Cost structure
- 3.1.4 Value addition at each stage
- 3.1.5 Factor affecting the value chain
- 3.1.6 Disruptions
- 3.2 Industry impact forces
- 3.2.1 Growth drivers
- 3.2.1.1 Rising demand for secure biometric authentication
- 3.2.1.2 Advancements in sensor technology
- 3.2.1.3 Integration with internet of things (IOT) and smart devices
- 3.2.1.4 Government initiatives and regulatory compliance
- 3.2.1.5 Consumer preference for convenience and user experience
- 3.2.2 Industry pitfalls and challenges
- 3.2.2.1 Security vulnerabilities and spoofing risks
- 3.2.2.2 Integration and compatibility limitations in emerging applications
- 3.2.1 Growth drivers
- 3.3 Growth potential analysis
- 3.4 Regulatory landscape
- 3.4.1 North America
- 3.4.2 Europe
- 3.4.3 Asia Pacific
- 3.4.4 Latin America
- 3.4.5 Middle East & Africa
- 3.5 Porter's analysis
- 3.6 PESTEL analysis
- 3.7 Technology and innovation landscape
- 3.7.1 Current technological trends
- 3.7.2 Emerging technologies
- 3.8 Emerging business models
- 3.9 Compliance requirements
- 3.10 Sustainability measures
- 3.11 Consumer sentiment analysis
- 3.12 Patent and IP analysis
- 3.13 Geopolitical and trade dynamics
Chapter 4 Competitive Landscape, 2024
- 4.1 Introduction
- 4.2 Company market share analysis
- 4.2.1 By region
- 4.2.1.1 North America
- 4.2.1.2 Europe
- 4.2.1.3 Asia Pacific
- 4.2.2 Market concentration analysis
- 4.2.1 By region
- 4.3 Competitive benchmarking of key players
- 4.3.1 Financial performance comparison
- 4.3.1.1 Revenue
- 4.3.1.2 Profit margin
- 4.3.1.3 R&D
- 4.3.2 Product portfolio comparison
- 4.3.2.1 Product range breadth
- 4.3.2.2 Technology
- 4.3.2.3 Innovation
- 4.3.3 Geographic presence comparison
- 4.3.3.1 Global footprint analysis
- 4.3.3.2 Service network coverage
- 4.3.3.3 Market penetration by region
- 4.3.4 Competitive positioning matrix
- 4.3.4.1 Leaders
- 4.3.4.2 Challengers
- 4.3.4.3 Followers
- 4.3.4.4 Niche players
- 4.3.5 Strategic outlook matrix
- 4.3.1 Financial performance comparison
- 4.4 Key developments, 2021-2024
- 4.4.1 Mergers and acquisitions
- 4.4.2 Partnerships and collaborations
- 4.4.3 Technological advancements
- 4.4.4 Expansion and investment strategies
- 4.4.5 Sustainability initiatives
- 4.4.6 Digital transformation initiatives
- 4.5 Emerging/ startup competitors landscape
Chapter 5 Market Estimates and Forecast, By Sensor Type, 2021 - 2034 (USD Million)
- 5.1 Key trends
- 5.2 Area & touch sensors
- 5.3 Swipe sensors
Chapter 6 Market Estimates and Forecast, By Mobility, 2021 - 2034 (USD Million)
- 6.1 Key trends
- 6.2 Fixed/fingerprint scanners
- 6.3 Mobile/portable
Chapter 7 Market Estimates and Forecast, By End Use, 2021 - 2034 (USD Million)
- 7.1 Key trends
- 7.2 Individual
- 7.3 BFSI
- 7.4 Healthcare
- 7.5 Retail & e-commerce
- 7.6 Automotive
- 7.7 Government & defense
- 7.8 Others
Chapter 8 Market Estimates and Forecast, By Region, 2021 - 2034 (USD Million)
- 8.1 Key trends
- 8.2 North America
- 8.2.1 U.S.
- 8.2.2 Canada
- 8.3 Europe
- 8.3.1 Germany
- 8.3.2 UK
- 8.3.3 France
- 8.3.4 Spain
- 8.3.5 Italy
- 8.3.6 Netherlands
- 8.4 Asia Pacific
- 8.4.1 China
- 8.4.2 India
- 8.4.3 Japan
- 8.4.4 Australia
- 8.4.5 South Korea
- 8.5 Latin America
- 8.5.1 Brazil
- 8.5.2 Mexico
- 8.5.3 Argentina
- 8.6 Middle East and Africa
- 8.6.1 Saudi Arabia
- 8.6.2 South Africa
- 8.6.3 UAE
Chapter 9 Company Profiles
- 9.1 BioEnable
- 9.2 Egis Technology Inc.
- 9.3 Fingerprint Cards AB
- 9.4 GigaDevice
- 9.5 HID Global Corporation
- 9.6 Holtek Semiconductor Inc.
- 9.7 IDEX Biometrics ASA
- 9.8 Mantra Softech
- 9.9 Next Biometrics
- 9.10 Qualcomm Technologies, Inc.
- 9.11 SecuGen Corporation
- 9.12 Shenzhen Goodix Technology Co., Ltd.
- 9.13 SUPREMA
- 9.14 Synaptics Incorporated
- 9.15 Thales
- 9.16 Xthings Inc.
 硅基指纹感测器市场:按感测器类型、嵌入式类型、应用、最终用户和销售管道划分-2026-2032年全球市场预测
 指纹感应器市场分析及预测(至2035年):依类型、产品类型、技术、组件、应用、最终用户、模组、功能及安装类型划分
 2026年全球指纹感应器市场报告
 指纹感应器市场 - 全球产业规模、份额、趋势、机会、预测:按类型、技术、应用、地区和竞争格局划分,2021-2031年
 日本指纹感应器市场报告(按类型、技术、应用和地区划分,2026-2034年)
 指纹感应器市场规模、份额及成长分析(按类型、技术、应用、最终用户和地区划分)-2026-2033年产业预测
 指纹感测器市场:2035年前的产业趋势和全球预测 - 指纹感测器类别,各技术类型,应用ipu,类别企业,各地区
 指纹感测器:市场份额分析、行业趋势、统计数据和成长预测(2025-2030 年)2025 年至 2033 年指纹感应器市场报告(按类型、技术、应用和地区)
 到 2030 年指纹感应器市场预测:按产品、材料、功能、技术、应用和地区进行的全球分析