


 |
市场调查报告书
商品编码
1773482
种植及施肥机械市场机会、成长动力、产业趋势分析及 2025 - 2034 年预测Planting and Fertilizing Machinery Market Opportunity, Growth Drivers, Industry Trend Analysis, and Forecast 2025 - 2034 |
||||||
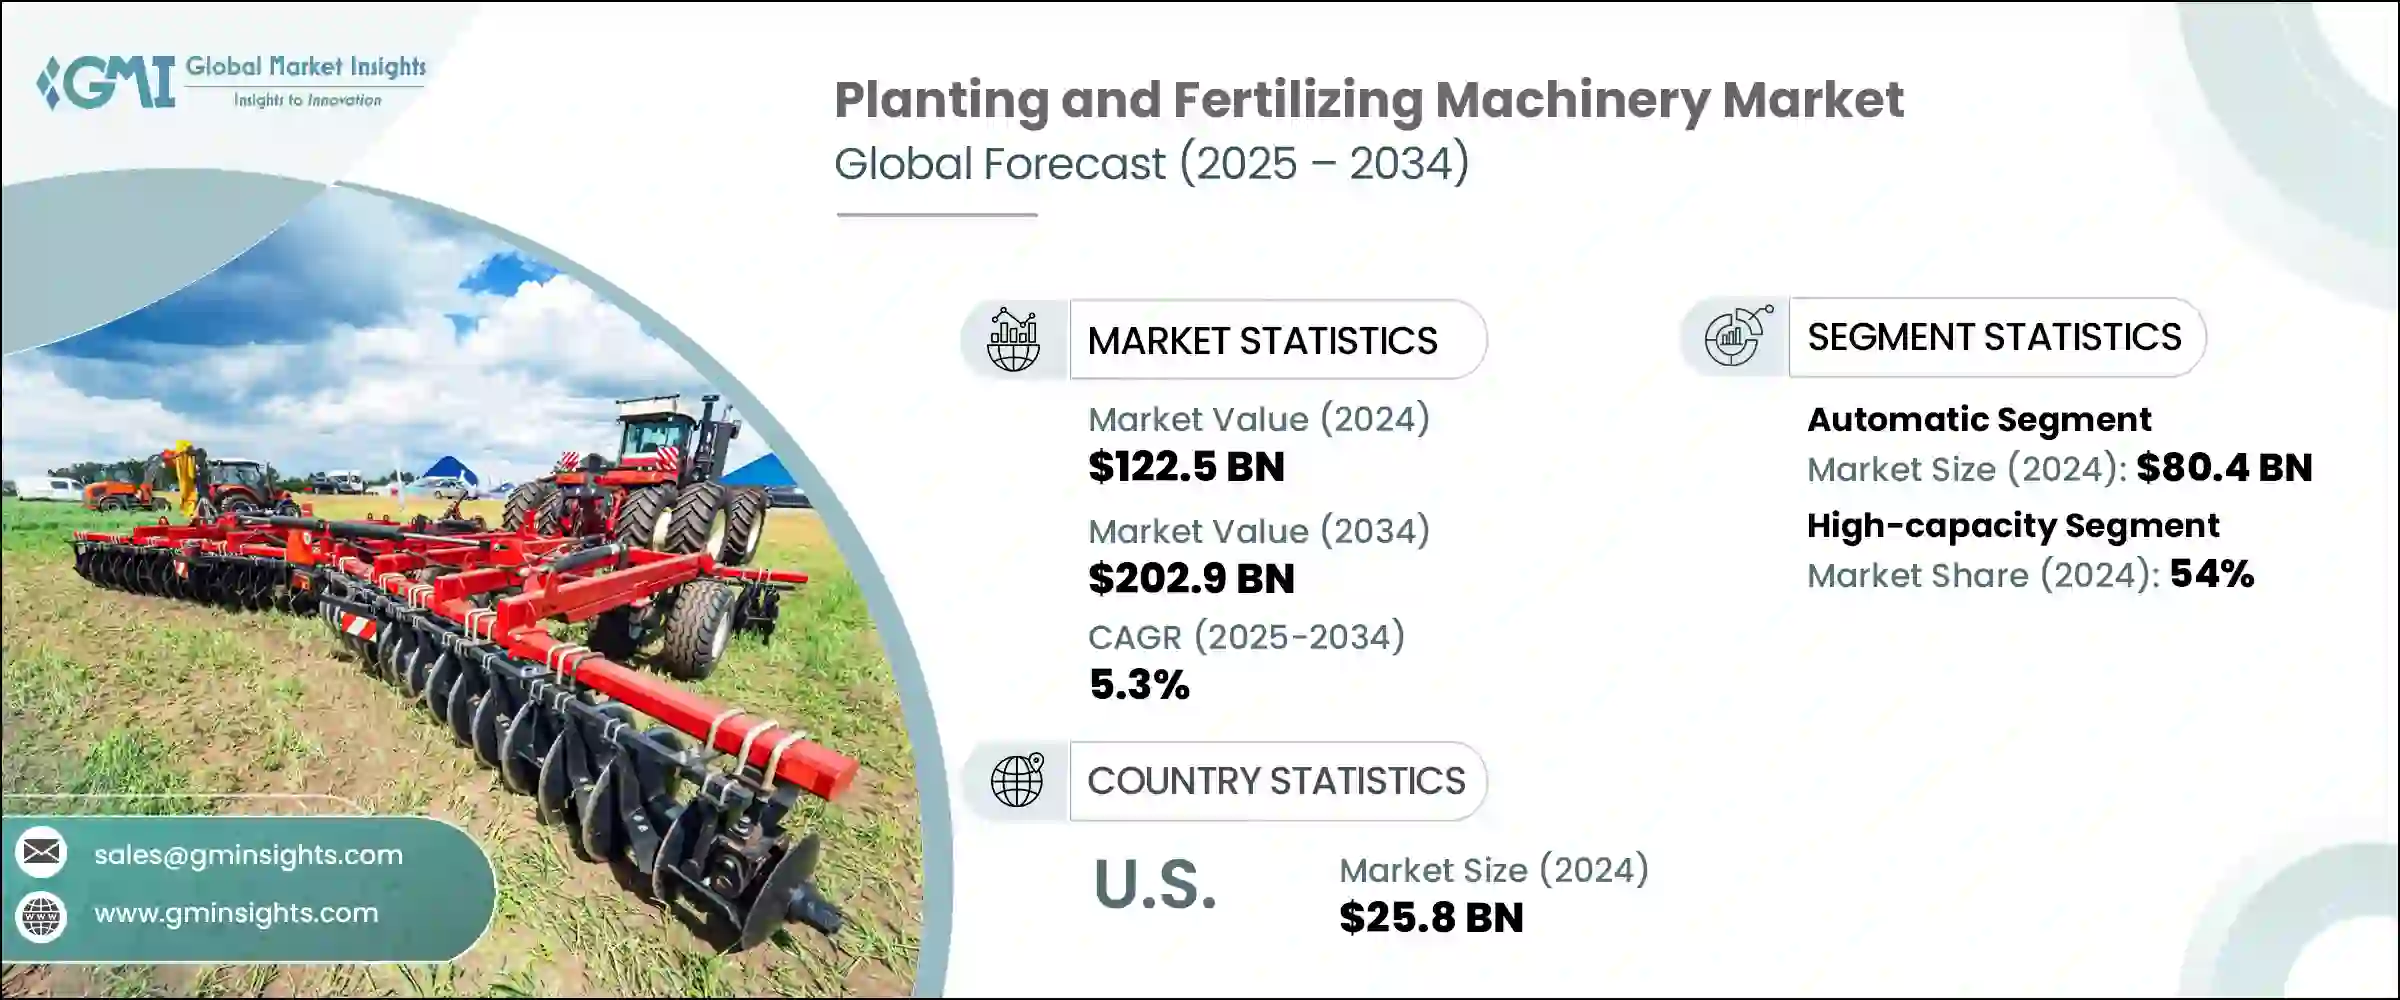
2024年,全球种植施肥机械市场规模达1,225亿美元,预计2034年将以5.3%的复合年增长率成长,达到2,029亿美元。这一增长主要归因于农业实践的持续转型,传统的手工作业正日益被现代机械化系统所取代。在许多发展中和转型经济体中,劳动成本的上升和持续的劳动力短缺迫使农场经营者转向能够更有效率、更精准地完成任务的机械。由于对及时作业和更高产量的需求,对能够加快播种施肥速度并减少人力投入的设备的需求正在快速增长。
机械化在促进永续农业实践方面也发挥着至关重要的作用。先进的播种施肥机械透过精准施肥减少种子和肥料的浪费,最大限度地减少对环境的影响,同时提高整体生产力。机械化工具的吸引力不仅在于节省劳动力,还在于其能够提高投入效率——帮助种植者以更少的资源获得更高的产量。随着农业日益数据化,价值链上的利益相关者——包括製造商、农场经营者和政策制定者——对采用支持高效精准农业的机械表现出越来越浓厚的兴趣。智慧控制系统和GPS导航等数位技术的融合进一步增强了这类设备的功能,使其成为现代农业的基石。全球粮食需求的成长,加上以更少的资源生产更多产品的需求,使得投资播种施肥机械成为许多国家的战略重点。
| 市场范围 | |
|---|---|
| 起始年份 | 2024 |
| 预测年份 | 2025-2034 |
| 起始值 | 1225亿美元 |
| 预测值 | 2029亿美元 |
| 复合年增长率 | 5.3% |
2024年,自动化种植和施肥机械市场规模将达到804亿美元,位居榜首,预计预测期内复合年增长率将达到5.7%。随着农场企业采用更精准、容错率更低的解决方案,这个细分市场将持续受到青睐。自动化机械配备了先进的技术,支援即时决策、变数施肥和基于地理位置的操作。这些特性有助于实现更均匀的种植、优化肥料分配并提高作物产量,使自动化成为寻求可持续规模化农场的理想选择。
自动化机械因其能够减少对劳动力的依赖和营运效率低下而受到农民的青睐。这些系统能够更好地控制田间状况,促进智慧投入品的使用,并支援更高水准的作物管理,从而带来更高的回报和长期成本节约。因此,预计未来几年该领域将占据更大的市场份额。
以容量计算,2024年,大容量机械占据最大市场份额,达到54%,预计2025年至2034年期间的复合年增长率为5.6%。市场对大容量设备的日益青睐反映了大规模农业经营的持续趋势,这种经营模式要求更快的执行速度和更高的产量。这些机械旨在在广阔的土地上高效运行,减少停机时间并最大限度地扩大田间覆盖范围。其卓越的设计以及与现代控制系统的集成,使其能够快速部署并提升田间作业性能,成为寻求实现更高产量目标的商业农场的必备工具。
从区域角度来看,美国在2024年北美市场占据主导地位,占据约76%的区域份额,创造了258亿美元的收入。在基础设施、科学研究和促进农业创新的政策的支持下,美国国内市场对精准农业的转型表现出极大的热情。美国农民正在采用配备即时感测器、GPS追踪和半自主自主系统的先进机械,这些机械降低了操作的劳动强度,并提高了生产效率。向技术驱动型农业的转变也有助于生产者最大限度地降低因种子和化肥过量使用而产生的成本,同时满足环境保护和资源利用方面的监管要求。
全球种植和施肥机械市场的主要参与者正在积极推行併购、合作等策略性倡议,以维持市场领先地位。他们还在研发方面投入巨资,以开发符合不断变化的客户需求和技术进步的机械产品。透过扩大产品组合和全球影响力,这些公司正致力于满足对更聪明、更有效率的农业解决方案日益增长的需求。他们的努力正在推动创新,并提供可扩展的解决方案,以支持全球粮食安全目标。
目录
第一章:方法论与范围
第二章:执行摘要
第三章:行业洞察
- 产业生态系统分析
- 供应商格局
- 利润率
- 每个阶段的增值
- 影响价值链的因素
- 产业衝击力
- 成长动力
- 全球粮食需求不断成长
- 农业机械化
- 产业陷阱与挑战
- 初始资本投入高
- 环境和监管压力
- 机会
- 成长动力
- 成长潜力分析
- 未来市场趋势
- 技术和创新格局
- 当前的技术趋势
- 新兴技术
- 价格趋势
- 按地区
- 按产品
- 监管格局
- 标准和合规性要求
- 区域监理框架
- 认证标准
- 波特的分析
- PESTEL分析
第四章:竞争格局
- 介绍
- 公司市占率分析
- 按地区
- 北美洲
- 欧洲
- 亚太地区
- 拉丁美洲
- MEA
- 公司矩阵分析
- 主要市场参与者的竞争分析
- 竞争定位矩阵
- 关键进展
- 併购
- 伙伴关係与合作
- 新产品发布
- 扩张计划
第五章:市场估计与预测:按类型,2021 - 2034 年
- 主要趋势
- 种植机械
- 广播播种机
- 气力播种机
- 种植园主
- 条播机
- 其他(移植者等)
- 施肥机械
- 广播传播者
- 撒播机
- 液体喷雾器
- 颗粒施药器
- 其他(灌溉系统等)
第六章:市场估计与预测:按运营,2021 - 2034 年
- 主要趋势
- 手动的
- 自动的
第七章:市场估计与预测:依产能,2021 - 2034 年
- 主要趋势
- 容量低
- 中等容量
- 高容量
第八章:市场估计与预测:依最终用途,2021 - 2034 年
- 主要趋势
- 家庭农场
- 大型商业农场
第九章:市场估计与预测:按配销通路,2021 - 2034 年
- 主要趋势
- 直销
- 间接销售
第十章:市场估计与预测:按地区,2021 - 2034 年
- 主要趋势
- 北美洲
- 我们
- 加拿大
- 欧洲
- 德国
- 英国
- 法国
- 西班牙
- 义大利
- 荷兰
- 亚太地区
- 中国
- 日本
- 印度
- 澳洲
- 韩国
- 拉丁美洲
- 巴西
- 墨西哥
- 阿根廷
- 中东和非洲
- 南非
- 沙乌地阿拉伯
- 阿联酋
第 11 章:公司简介
- AGCO
- Amazon
- CLAAS
- CNH Industrial
- Deutz-Fahr Group
- CNH Industrial
- Kinze Manufacturing
- Kubota
- Kverneland
- Lemken
- Mahindra & Mahindra
- Maschio Gaspardo
- Salford Group
- Vaderstad
- Yanmar
The Global Planting and Fertilizing Machinery Market was valued at USD 122.5 billion in 2024 and is estimated to grow at a CAGR of 5.3% to reach USD 202.9 billion by 2034. This growth is primarily attributed to the ongoing transformation of agricultural practices, as traditional manual methods are increasingly being replaced by modern mechanized systems. In many developing and transitioning economies, rising labor costs and persistent labor shortages are compelling farm operators to shift towards machinery that can perform tasks more efficiently and with greater accuracy. The demand for equipment that can accelerate seeding and fertilization while reducing human input is growing rapidly, driven by the need for timely operations and higher yields.
Mechanization is also playing a vital role in promoting sustainable agricultural practices. Advanced planting and fertilizing machines reduce seed and fertilizer waste through precise application, minimizing environmental impact while improving overall productivity. The appeal of mechanized tools lies not just in labor savings, but in their ability to enhance input efficiency-helping growers produce more using fewer resources. As agriculture becomes increasingly data-driven, stakeholders across the value chain-including manufacturers, farm operators, and policymakers-are showing stronger interest in adopting machinery that supports high-efficiency and precision farming. The integration of digital technologies, such as smart control systems and GPS guidance, is further enhancing the capabilities of this equipment, making it a cornerstone of modern agriculture. Increased global food demand, coupled with the need to produce more with less, is making investment in planting and fertilizing machinery a strategic priority for many countries.
| Market Scope | |
|---|---|
| Start Year | 2024 |
| Forecast Year | 2025-2034 |
| Start Value | $122.5 Billion |
| Forecast Value | $202.9 Billion |
| CAGR | 5.3% |
Within the market, in 2024, automatic planting and fertilizing machinery led the market with a revenue of USD 80.4 billion and is projected to grow at a CAGR of 5.7% over the forecast period. This segment continues to gain traction as farm businesses adopt solutions that offer greater precision and less margin for error. Automatic machines are equipped with advanced technologies that support real-time decision-making, variable-rate application, and geolocation-based operations. These features contribute to more uniform planting, optimized fertilizer distribution, and increased crop yields, making automation an appealing option for farms aiming to scale sustainably.
Farmers are steadily favoring automated machinery due to its ability to reduce labor dependency and operational inefficiencies. These systems allow better control over field conditions, promote smart input use, and support a higher level of crop management, which translates into better returns and long-term cost savings. As a result, this segment is expected to capture even greater market share in the coming years.
Based on capacity, in 2024, high-capacity machinery accounted for the largest share of the market, commanding 54%, and is forecasted to grow at a CAGR of 5.6% between 2025 and 2034. The growing preference for high-capacity equipment reflects the ongoing trend toward large-scale farming operations that demand faster execution and higher throughput. These machines are designed to operate efficiently across vast tracts of land, reducing downtime and maximizing field coverage. Their superior design and integration with modern control systems allow for rapid deployment and enhanced field performance, making them essential tools for commercial farms looking to meet increasing production targets.
From a regional perspective, the United States represented a dominant force in the North American market in 2024, holding approximately 76% of the regional share and generating USD 25.8 billion in revenue. The domestic market has embraced the transition to precision-based agriculture with strong enthusiasm, supported by infrastructure, research, and policy that promote agricultural innovation. Farmers in the U.S. are adopting advanced machinery that features real-time sensors, GPS-enabled tracking, and semi-autonomous autonomous systems that make operations less labor-intensive and more productive. The shift toward technology-driven agriculture is also helping producers minimize costs associated with excess seed and fertilizer usage while meeting regulatory expectations around environmental conservation and resource use.
Key players in the global planting and fertilizing machinery market are actively pursuing strategic initiatives such as mergers, acquisitions, and collaborative ventures to stay ahead of market trends. They are also investing significantly in R&D to develop machinery that aligns with evolving customer needs and technological advancements. By expanding their product portfolios and global reach, these companies are working to meet the growing demand for smarter, more efficient agricultural solutions. Their efforts are helping drive innovation and offer scalable solutions that support global food security objectives.
Table of Contents
Chapter 1 Methodology & Scope
- 1.1 Market scope and definition
- 1.2 Research design
- 1.2.1 Research approach
- 1.2.2 Data collection methods
- 1.3 Data mining sources
- 1.3.1 Global
- 1.3.2 Regional/Country
- 1.4 Base estimates and calculations
- 1.4.1 Base year calculation
- 1.4.2 Key trends for market estimation
- 1.5 Primary research and validation
- 1.5.1 Primary sources
- 1.6 Forecast model
- 1.7 Research assumptions and limitations
Chapter 2 Executive Summary
- 2.1 Industry 3600 synopsis
- 2.2 Key market trends
- 2.2.1 Regional
- 2.2.2 Type
- 2.2.3 Operation
- 2.2.4 Capacity
- 2.2.5 End use
- 2.2.6 Distribution channel
- 2.3 CXO perspectives: Strategic imperatives
- 2.3.1 Key decision points for industry executives
- 2.3.2 Critical success factors for market players
- 2.4 Future outlook and strategic recommendations
Chapter 3 Industry Insights
- 3.1 Industry ecosystem analysis
- 3.1.1 Supplier landscape
- 3.1.2 Profit margin
- 3.1.3 Value addition at each stage
- 3.1.4 Factor affecting the value chain
- 3.2 Industry impact forces
- 3.2.1 Growth drivers
- 3.2.1.1 Rising global food demand
- 3.2.1.2 Mechanization of agriculture
- 3.2.2 Industry pitfalls & challenges
- 3.2.2.1 High initial capital investment
- 3.2.2.2 Environmental and regulatory pressure
- 3.2.3 Opportunities
- 3.2.1 Growth drivers
- 3.3 Growth potential analysis
- 3.4 Future market trends
- 3.5 Technology and innovation landscape
- 3.5.1 Current technological trends
- 3.5.2 Emerging technologies
- 3.6 Price trends
- 3.6.1 By region
- 3.6.2 By product
- 3.7 Regulatory landscape
- 3.7.1 Standards and compliance requirements
- 3.7.2 Regional regulatory frameworks
- 3.7.3 Certification standards
- 3.8 Porter's analysis
- 3.9 PESTEL analysis
Chapter 4 Competitive Landscape, 2024
- 4.1 Introduction
- 4.2 Company market share analysis
- 4.2.1 By region
- 4.2.2 North America
- 4.2.3 Europe
- 4.2.4 Asia Pacific
- 4.2.5 Latin America
- 4.2.6 MEA
- 4.3 Company matrix analysis
- 4.4 Competitive analysis of major market players
- 4.5 Competitive positioning matrix
- 4.6 Key developments
- 4.6.1 Mergers & acquisitions
- 4.6.2 Partnerships & collaborations
- 4.6.3 New product launches
- 4.6.4 Expansion plans
Chapter 5 Market Estimates & Forecast, By Type, 2021 - 2034 ($Billion, Thousand Units)
- 5.1 Key trends
- 5.2 Planting machinery
- 5.2.1 Broadcast seeders
- 5.2.2 Air seeders
- 5.2.3 Planters
- 5.2.4 Drill seeders
- 5.2.5 Others(transplanters, etc.)
- 5.3 Fertilizing machinery
- 5.3.1 Broadcast spreaders
- 5.3.2 Drop spreaders
- 5.3.3 Liquid sprayers
- 5.3.4 Granular applicators
- 5.3.5 Others(fertigation systems, etc.)
Chapter 6 Market Estimates & Forecast, By Operation, 2021 - 2034 ($Billion, Thousand Units)
- 6.1 Key trends
- 6.2 Manual
- 6.3 Automatic
Chapter 7 Market Estimates & Forecast, By Capacity, 2021 - 2034 ($Billion, Thousand Units)
- 7.1 Key trends
- 7.2 Low capacity
- 7.3 Mid capacity
- 7.4 High capacity
Chapter 8 Market Estimates & Forecast, By End Use, 2021 - 2034 ($Billion, Thousand Units)
- 8.1 Key trends
- 8.2 Family-owned farms
- 8.3 Large-scale commercial farms
Chapter 9 Market Estimates & Forecast, By Distribution Channel, 2021 - 2034 ($Billion, Thousand Units)
- 9.1 Key trends
- 9.2 Direct sales
- 9.3 Indirect sales
Chapter 10 Market Estimates & Forecast, By Region, 2021 - 2034 ($Billion, Thousand Units)
- 10.1 Key trends
- 10.2 North America
- 10.2.1 U.S.
- 10.2.2 Canada
- 10.3 Europe
- 10.3.1 Germany
- 10.3.2 UK
- 10.3.3 France
- 10.3.4 Spain
- 10.3.5 Italy
- 10.3.6 Netherlands
- 10.4 Asia Pacific
- 10.4.1 China
- 10.4.2 Japan
- 10.4.3 India
- 10.4.4 Australia
- 10.4.5 South Korea
- 10.5 Latin America
- 10.5.1 Brazil
- 10.5.2 Mexico
- 10.5.3 Argentina
- 10.6 Middle East and Africa
- 10.6.1 South Africa
- 10.6.2 Saudi Arabia
- 10.6.3 UAE
Chapter 11 Company Profiles
- 11.1 AGCO
- 11.2 Amazon
- 11.3 CLAAS
- 11.4 CNH Industrial
- 11.5 Deutz-Fahr Group
- 11.6 CNH Industrial
- 11.7 Kinze Manufacturing
- 11.8 Kubota
- 11.9 Kverneland
- 11.10 Lemken
- 11.11 Mahindra & Mahindra
- 11.12 Maschio Gaspardo
- 11.13 Salford Group
- 11.14 Vaderstad
- 11.15 Yanmar
 自走式蔬菜移植市场:按类型、引擎功率、种植行数、价格范围、通路、最终用户和应用划分-2026-2032年全球预测农业植物保护无人机市场:按无人机类型、组件、作物类型、应用、最终用户划分,全球预测(2026-2032)
 2026年全球播种机市场报告2026年全球施肥机械市场报告2026年全球肥料施用与植物保护设备市场报告
 种植设备市场规模、份额和成长分析(按设备类型、动力来源、行类型、最终用途、分销通路和地区划分)-2026-2033年产业预测蔬菜种植机器人市场(依动力源、商业农场、自主机器人、露天农场、播种和机械臂)——2026-2032年全球预测
 水稻插秧机市场:依产品类型(骑乘式插秧机、步行式插秧机)、驱动方式(自走式、手排式)、容量(4行以下、4-8行)、导航系统与应用领域划分-全球预测至2035年
 全球作物保护设备市场预测(至2032年):按设备类型、作物类型、动力来源、分销管道、应用、最终用户和地区划分种植设备市场按产品类型、播种机制、操作类型、农场规模、行距、动力来源、应用和销售管道划分-2025-2032 年全球预测