


 |
市场调查报告书
商品编码
1797732
LCR 电錶市场机会、成长动力、产业趋势分析及 2025 - 2034 年预测LCR Meters Market Opportunity, Growth Drivers, Industry Trend Analysis, and Forecast 2025 - 2034 |
||||||
2024年,全球LCR测量仪市场规模达15.2亿美元,预计2034年将以3.3%的复合年增长率成长,达到21亿美元。高效能电子系统的日益普及以及消费性电子产品和物联网设备的日益普及,推动了这一稳定成长。随着各行各业持续专注于开发紧凑型高性能电子产品,对先进LCR测量工具的需求也随之激增。 LCR测量仪的整合对于测试组件的精度、可靠性和长期稳定性至关重要。
材料和电路设计的创新使这些仪器能够提供更高的精度、更好的热稳定性和更低的能耗。此外,能源效率、环保合规性以及向符合RoHS标准和无铅元件的转变等全球趋势,正在强化LCR测试在多个行业中的重要性。
| 市场范围 | |
|---|---|
| 起始年份 | 2024 |
| 预测年份 | 2025-2034 |
| 起始值 | 15.2亿美元 |
| 预测值 | 21亿美元 |
| 复合年增长率 | 3.3% |
随着智慧製造、电商物流和汽车电子的发展,製造商越来越依赖先进的 LCR 解决方案,在日益小型化的设计和节能配置中进行品质控制、系统验证和元件匹配。生产环境向自动化、互联互通和即时资料监控的转变,需要能够无缝整合到数位品质保证工作流程中的高精度测试设备。 LCR 表在确保电感器、电容器和电阻器等被动元件的可靠性方面发挥着至关重要的作用,尤其是在这些元件尺寸越来越小且用于更复杂的电路架构的情况下。
桌上型 LCR 表市场在 2024 年的营收为 6.688 亿美元。桌上型 LCR 表以其卓越的精度和先进的阻抗分析能力而闻名,是电信、汽车和半导体等各行各业实验室和测试设施的关键组件。这些设备提供更宽的频率范围并保持严格的测量公差,非常适合在各种测试条件下验证性能。与便携式 LCR 表相比,桌上型 LCR 表提供更深入的分析、更高的资料解析度和更快的测试週期,帮助专业人员确保高度复杂的系统和组件的品质。
2024年,电容测试领域在LCR表市场中占据重要地位,达到4.291亿美元。电容测量仍然是电子测试中至关重要的功能,因为它直接影响电路的设计和可靠性。随着复杂电容器在电信、消费性电子和汽车应用等微型设备中的应用日益广泛,对能够分析多层陶瓷电容器 (MLCC) 的精密仪器的需求激增。製造商依靠高精度LCR表在早期设计或最终生产阶段识别偏差并预防组件的潜在故障。此测试可确保稳定的电气行为,有助于满足各行业的性能和监管基准。
2024年,美国LCR电錶市场规模达3.0066亿美元,这得益于其强大的技术基础设施以及在航太、汽车和电子等领域的领先地位。半导体生产、电动车研发和5G网路扩展对先进测试仪器的日益依赖,进一步增强了对高频、自动化和高精度LCR电錶的需求。美国也受惠于大量的研发投入,这些投入正在推动下一代LCR工具在产品创新、系统整合和品质控制工作流程中的应用。随着电子设计标准日益严格,市场正转向更智慧、整合软体的LCR电錶,这些电錶已针对高级材料测试和设备校准进行了最佳化。
LCR 表产业的竞争格局包括众多参与者,例如 IET Labs, Inc.、Keysight Technologies、Hioki EE Corporation、GW Instek、Chroma ATE Inc.、Yokogawa Electric Corporation、B&K Precision Corporation、Extech Instruments、Fluke Corporation、Agilent Technologies、Newton4th Ltd (Nui YL)、Kikusui Electron. Co., Ltd.、Aplab Limited、Applent Instruments Inc.、Victor Instruments、Scientific Mes-Technik Pvt. Ltd. 与 Tonghui Electronics Co., Ltd.。
为了扩大影响力并强化市场定位,LCR 表产业的主要公司正专注于创新、策略合作伙伴关係和以客户为中心的开发。许多公司正在投资研发,以推出具有自动化测试功能和增强资料分析功能的紧凑型多功能仪表。此外,各公司还与原始设备製造商 (OEM)、研究机构和半导体製造商结盟,以提供针对特定测试需求的客製化整合解决方案。
目录
第一章:方法论与范围
第二章:执行摘要
第三章:行业洞察
- 产业生态系统分析
- 供应商概况
- 利润率
- 成本结构
- 每个阶段的增值
- 影响价值链的因素
- 中断
- 产业衝击力
- 成长动力
- 对先进电子产品(电动车、5G、物联网)的需求不断增长
- 测量和自动化技术的进步
- 越来越重视产品可靠性和品质控制
- 加大半导体和航太领域的研发力度
- 智慧製造和工业4.0的扩展
- 产业陷阱与挑战
- 永续材料成本高
- 回收基础设施缺口
- 成长动力
- 成长潜力分析
- 监管格局
- 北美洲
- 欧洲
- 亚太地区
- 拉丁美洲
- 中东和非洲
- 波特的分析
- PESTEL分析
- 技术和创新格局
- 当前的技术趋势
- 新兴技术
- 价格趋势
- 历史价格分析(2021-2024)
- 价格趋势驱动因素
- 区域价格差异
- 价格预测(2025-2034年)
- 定价策略
- 新兴商业模式
- 合规性要求
- 永续性措施
- 永续材料评估
- 碳足迹分析
- 循环经济实施
- 永续性认证和标准
- 永续性投资报酬率分析
- 全球消费者情绪分析
- 专利分析
第四章:竞争格局
- 介绍
- 公司市占率分析
- 按地区
- 北美洲
- 欧洲
- 亚太地区
- 拉丁美洲
- 中东和非洲
- 市场集中度分析
- 按地区
- 关键参与者的竞争基准
- 财务绩效比较
- 收入
- 利润率
- 研发
- 产品组合比较
- 产品范围广度
- 科技
- 创新
- 地理位置比较
- 全球足迹分析
- 服务网路覆盖
- 各地区市场渗透率
- 竞争定位矩阵
- 领导者
- 挑战者
- 追踪者
- 利基市场参与者
- 战略展望矩阵
- 财务绩效比较
- 2021-2024 年关键发展
- 併购
- 伙伴关係和合作
- 技术进步
- 扩张和投资策略
- 永续发展倡议
- 数位转型倡议
- 新兴/新创企业竞争对手格局
第五章:市场估计与预测:按类型,2021 - 2034 年
- 主要趋势
- 手持式 LCR 表
- 桌上型 LCR 表
- 便携式LCR表
- 模组化/自动 LCR 表
第六章:市场估计与预测:按测量参数,2021 - 2034 年
- 主要趋势
- L(电感)
- C(电容)
- R(阻力)
- Q(品质因数)
- D(耗散因数)
- 阻抗
- 相位角
- 导纳 (Y)、电导 (G)、电纳 (B)
第七章:市场估计与预测:按频率范围类型,2021 - 2034 年
- 主要趋势
- 低频(<1 kHz)
- 中频(1 kHz - 1 MHz)
- 高频(> 1 MHz)
第八章:市场估计与预测:按最终用途产业,2021 - 2034 年
- 主要趋势
- 製造业
- 汽车
- 卫生保健
- 半导体和电子产品
- 航太与国防
- 学术和研究机构
- 实用工具
- 其他(例如再生能源、物联网设备製造商)
第九章:市场估计与预测:按地区,2021 - 2034 年
- 主要趋势
- 北美洲
- 我们
- 加拿大
- 欧洲
- 德国
- 英国
- 法国
- 西班牙
- 义大利
- 荷兰
- 亚太地区
- 中国
- 印度
- 日本
- 澳洲
- 韩国
- 拉丁美洲
- 巴西
- 墨西哥
- 阿根廷
- 中东和非洲
- 沙乌地阿拉伯
- 南非
- 阿联酋
第十章:公司简介
- Keysight Technologies
- Hioki EE Corporation
- Chroma ATE Inc.
- IET Labs, Inc.
- GW Instek (Good Will Instrument Co., Ltd.)
- B&K Precision Corporation
- Yokogawa Electric Corporation
- Fluke Corporation
- Agilent Technologies
- Extech Instruments
- Scientific Mes-Technik Pvt. Ltd.
- Newton4th Ltd (N4L)
- Kikusui Electronics Corporation
- Preen AC Power Corp.
- Applent Instruments Inc.
- DER EE Electrical Instrument Corp.
- TECPEL Co., Ltd.
- Victor Instruments (Shenzhen Victor Hi-Tech Co. Ltd.)
- Tonghui Electronics Co., Ltd.
- Aplab Limited
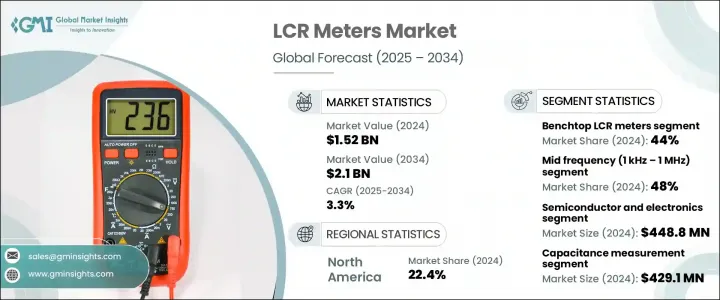
The Global LCR Meters Market was valued at USD 1.52 billion in 2024 and is estimated to grow at a CAGR of 3.3% to reach USD 2.1 billion by 2034. This steady growth is being fueled by the rising adoption of high-efficiency electronic systems and the increasing penetration of consumer electronics and IoT-enabled devices. As industries continue to focus on developing compact, high-performance electronics, the demand for advanced LCR measurement tools is surging. The integration of LCR meters is becoming vital in testing components for precision, reliability, and long-term stability.
Innovations in materials and circuit design are enabling these instruments to offer enhanced accuracy, better thermal stability, and lower energy usage. Additionally, global trends such as energy efficiency, environmental compliance, and the shift toward RoHS-compliant and lead-free components are reinforcing the importance of LCR testing across multiple industries.
| Market Scope | |
|---|---|
| Start Year | 2024 |
| Forecast Year | 2025-2034 |
| Start Value | $1.52 Billion |
| Forecast Value | $2.1 Billion |
| CAGR | 3.3% |
As smart manufacturing, e-commerce logistics, and automotive electronics evolve, manufacturers increasingly depend on advanced LCR solutions for quality control, system validation, and component matching in increasingly miniaturized designs and energy-optimized configurations. The shift toward automation, connectivity, and real-time data monitoring in production environments demands highly accurate testing equipment that can seamlessly integrate into digital quality assurance workflows. LCR meters play a critical role in ensuring the reliability of passive components like inductors, capacitors, and resistors, especially as these parts become smaller and are used in more complex circuit architectures.
The benchtop LCR meters segment generated USD 668.8 million in 2024. Known for their exceptional precision and advanced impedance analysis, benchtop models are a critical component in laboratories and testing facilities across various industries, including telecommunications, automotive, and semiconductors. These devices offer broader frequency ranges and maintain tight measurement tolerances, making them highly suitable for validating performance under diverse testing conditions. Compared to portable models, benchtop LCR meters provide deeper analysis, better data resolution, and faster test cycle times, helping professionals ensure quality assurance in highly complex systems and components.
In 2024, the capacitance testing segment captured significant value in the LCR meters market, reaching USD 429.1 million. Capacitance measurement continues to be a vital function in electronic testing as it directly affects the design and reliability of circuits. With growing use of complex capacitors in miniaturized devices across telecom, consumer electronics, and automotive applications, demand for precision instruments capable of analyzing multilayer ceramic capacitors (MLCCs) has surged. Manufacturers rely on high-accuracy LCR meters to identify deviations and prevent potential failures in components during early design or final production stages. This testing ensures stable electrical behavior, helping meet performance and regulatory benchmarks across various industry verticals.
United States LCR Meters Market was valued at USD 300.66 million in 2024, driven by robust technological infrastructure and leadership across sectors like aerospace, automotive, and electronics. The growing reliance on advanced testing instruments in semiconductor production, EV development, and 5G network expansion has reinforced the demand for LCR meters that offer high frequency, automation, and measurement accuracy. The U.S. also benefits from extensive R&D investments, which are pushing the adoption of next-gen LCR tools in product innovation, system integration, and quality control workflows. As electronic design standards become increasingly stringent, the market is shifting toward smarter, software-integrated LCR meters optimized for advanced material testing and device calibration.
The competitive landscape of the LCR Meters Industry includes a wide range of players, such as IET Labs, Inc., Keysight Technologies, Hioki E.E. Corporation, GW Instek, Chroma ATE Inc., Yokogawa Electric Corporation, B&K Precision Corporation, Extech Instruments, Fluke Corporation, Agilent Technologies, Newton4th Ltd (N4L), Kikusui Electronics Corporation, Preen AC Power Corp., DER EE Electrical Instrument Corp., TECPEL Co., Ltd., Aplab Limited, Applent Instruments Inc., Victor Instruments, Scientific Mes-Technik Pvt. Ltd., and Tonghui Electronics Co., Ltd.
To expand their presence and strengthen market positioning, key companies in the LCR meters industry are focusing on innovation, strategic partnerships, and customer-centric development. Many are investing in R&D to introduce compact, multi-functional meters with automated testing capabilities and enhanced data analysis. Companies are also forming alliances with OEMs, research institutes, and semiconductor manufacturers to offer integrated solutions tailored to specific testing needs.
Table of Contents
Chapter 1 Methodology and Scope
- 1.1 Market scope and definition
- 1.2 Research design
- 1.2.1 Research approach
- 1.2.2 Data collection methods
- 1.3 Data mining sources
- 1.3.1 Global
- 1.3.2 Regional/Country
- 1.4 Base estimates and calculations
- 1.4.1 Base year calculation
- 1.4.2 Key trends for market estimation
- 1.5 Primary research and validation
- 1.5.1 Primary sources
- 1.6 Forecast model
- 1.7 Research assumptions and limitations
Chapter 2 Executive Summary
- 2.1 Industry snapshot
- 2.2 Key market trends
- 2.2.1 Market type trends
- 2.2.2 Material trends
- 2.2.3 Application trends
- 2.2.4 Regional
- 2.3 TAM Analysis, 2025-2034 (USD Million & Units)
- 2.4 CXO perspectives: Strategic imperatives
- 2.4.1 Executive decision points
- 2.4.2 critical success factors
- 2.5 Future outlook and strategic recommendations
Chapter 3 Industry Insights
- 3.1 Industry ecosystem analysis
- 3.1.1 Supplier Landscape
- 3.1.2 Profit Margin
- 3.1.3 Cost structure
- 3.1.4 Value addition at each stage
- 3.1.5 Factor affecting the value chain
- 3.1.6 Disruptions
- 3.2 Industry impact forces
- 3.2.1 Growth drivers
- 3.2.1.1 Rising demand for advanced electronics (EVs, 5G, IoT)
- 3.2.1.2 Advancements in measurement and automation technologies
- 3.2.1.3 Growing focus on product reliability and quality control
- 3.2.1.4 Increasing R&D in semiconductors and aerospace sectors
- 3.2.1.5 Expansion of smart manufacturing and Industry 4.0
- 3.2.2 Industry pitfalls and challenges
- 3.2.2.1 High costs of sustainable materials
- 3.2.2.2 Recycling infrastructure gaps
- 3.2.1 Growth drivers
- 3.3 Growth potential analysis
- 3.4 Regulatory landscape
- 3.4.1 North America
- 3.4.2 Europe
- 3.4.3 Asia Pacific
- 3.4.4 Latin America
- 3.4.5 Middle East & Africa
- 3.5 Porter's analysis
- 3.6 PESTEL analysis
- 3.7 Technology and innovation landscape
- 3.7.1 Current technological trends
- 3.7.2 Emerging technologies
- 3.8 Price trends
- 3.8.1 Historical price analysis (2021-2024)
- 3.8.2 Price trend drivers
- 3.8.3 Regional price variations
- 3.8.4 Price forecast (2025-2034)
- 3.9 Pricing strategies
- 3.10 Emerging business models
- 3.11 Compliance requirements
- 3.12 Sustainability measures
- 3.12.1 Sustainable materials assessment
- 3.12.2 Carbon footprint analysis
- 3.12.3 Circular economy implementation
- 3.12.4 Sustainability certifications and standards
- 3.12.5 Sustainability roi analysis
- 3.13 Global consumer sentiment analysis
- 3.14 Patent analysis
Chapter 4 Competitive Landscape, 2024
- 4.1 Introduction
- 4.2 Company market share analysis
- 4.2.1 By region
- 4.2.1.1 North America
- 4.2.1.2 Europe
- 4.2.1.3 Asia Pacific
- 4.2.1.4 Latin America
- 4.2.1.5 Middle East & Africa
- 4.2.2 Market Concentration Analysis
- 4.2.1 By region
- 4.3 Competitive benchmarking of key players
- 4.3.1 Financial performance comparison
- 4.3.1.1 Revenue
- 4.3.1.2 Profit margin
- 4.3.1.3 R&D
- 4.3.2 Product portfolio comparison
- 4.3.2.1 Product range breadth
- 4.3.2.2 Technology
- 4.3.2.3 Innovation
- 4.3.3 Geographic presence comparison
- 4.3.3.1 Global footprint analysis
- 4.3.3.2 Service network coverage
- 4.3.3.3 Market penetration by region
- 4.3.4 Competitive positioning matrix
- 4.3.4.1 Leaders
- 4.3.4.2 Challengers
- 4.3.4.3 Followers
- 4.3.4.4 Niche players
- 4.3.5 Strategic outlook matrix
- 4.3.1 Financial performance comparison
- 4.4 Key developments, 2021-2024
- 4.4.1 Mergers and acquisitions
- 4.4.2 Partnerships and collaborations
- 4.4.3 Technological advancements
- 4.4.4 Expansion and investment strategies
- 4.4.5 Sustainability initiatives
- 4.4.6 Digital transformation initiatives
- 4.5 Emerging/ startup competitors landscape
Chapter 5 Market Estimates and Forecast, By Type, 2021 - 2034 (USD Million & Units)
- 5.1 Key trends
- 5.2 Handheld LCR Meters
- 5.3 Benchtop LCR Meters
- 5.4 Portable LCR Meters
- 5.5 Modular/Automatic LCR Meters
Chapter 6 Market Estimates and Forecast, By Measurement Parameters, 2021 - 2034 (USD Million & Units)
- 6.1 Key trends
- 6.2 L (Inductance)
- 6.3 C (Capacitance)
- 6.4 R (Resistance)
- 6.5 Q (Quality Factor)
- 6.6 D (Dissipation Factor)
- 6.7 Impedance
- 6.8 Phase Angle
- 6.9 Admittance (Y), Conductance (G), Susceptance (B)
Chapter 7 Market Estimates and Forecast, By Frequency Range Type, 2021 - 2034 (USD Million & Units)
- 7.1 Key trends
- 7.2 Low Frequency (< 1 kHz)
- 7.3 Mid Frequency (1 kHz - 1 MHz)
- 7.4 High Frequency (> 1 MHz)
Chapter 8 Market Estimates and Forecast, By End Use Industry, 2021 - 2034 (USD Million & Units)
- 8.1 Key trends
- 8.2 Manufacturing
- 8.3 Automotive
- 8.4 Healthcare
- 8.5 Semiconductors & electronics
- 8.6 Aerospace & defense
- 8.7 Academic & research institutions
- 8.8 Utilities
- 8.9 Others (e.g., renewable energy, iot device manufacturers)
Chapter 9 Market Estimates and Forecast, By Region, 2021 - 2034 (USD Million & Units)
- 9.1 Key trends
- 9.2 North America
- 9.2.1 U.S.
- 9.2.2 Canada
- 9.3 Europe
- 9.3.1 Germany
- 9.3.2 UK
- 9.3.3 France
- 9.3.4 Spain
- 9.3.5 Italy
- 9.3.6 Netherlands
- 9.4 Asia Pacific
- 9.4.1 China
- 9.4.2 India
- 9.4.3 Japan
- 9.4.4 Australia
- 9.4.5 South Korea
- 9.5 Latin America
- 9.5.1 Brazil
- 9.5.2 Mexico
- 9.5.3 Argentina
- 9.6 Middle East and Africa
- 9.6.1 Saudi Arabia
- 9.6.2 South Africa
- 9.6.3 UAE
Chapter 10 Company Profiles
- 10.1 Keysight Technologies
- 10.2 Hioki E.E. Corporation
- 10.3 Chroma ATE Inc.
- 10.4 IET Labs, Inc.
- 10.5 GW Instek (Good Will Instrument Co., Ltd.)
- 10.6 B&K Precision Corporation
- 10.7 Yokogawa Electric Corporation
- 10.8 Fluke Corporation
- 10.9 Agilent Technologies
- 10.10 Extech Instruments
- 10.11 Scientific Mes-Technik Pvt. Ltd.
- 10.12 Newton4th Ltd (N4L)
- 10.13 Kikusui Electronics Corporation
- 10.14 Preen AC Power Corp.
- 10.15 Applent Instruments Inc.
- 10.16 DER EE Electrical Instrument Corp.
- 10.17 TECPEL Co., Ltd.
- 10.18 Victor Instruments (Shenzhen Victor Hi-Tech Co. Ltd.)
- 10.19 Tonghui Electronics Co., Ltd.
- 10.20 Aplab Limited


