


 |
市场调查报告书
商品编码
1797783
风暴追踪应用市场机会、成长动力、产业趋势分析及 2025 - 2034 年预测Storm Tracking Apps Market Opportunity, Growth Drivers, Industry Trend Analysis, and Forecast 2025 - 2034 |
||||||
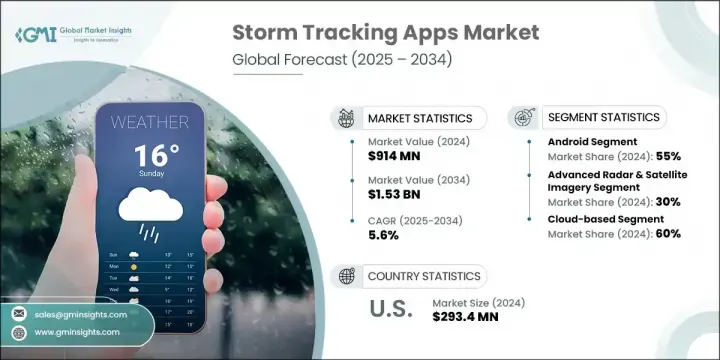
2024 年全球风暴追踪应用市场价值为 9.14 亿美元,预计到 2034 年将以 5.6% 的复合年增长率成长,达到 15.3 亿美元。随着极端天气事件变得越来越频繁和严重,风暴追踪应用程式已经从基本的警报系统发展成为风险管理和紧急准备的重要工具。政府和私人孵化器之间的合作正在加速应用程式的创新和采用。提供先进雷达追踪和分层订阅模式的高级应用程式引领市场,迎合了需要精确、数据丰富功能的专业人士和气象爱好者的需求。许多平台提供高保真风暴模型、即时闪电检测和历史追踪资料,并越来越多地与智慧穿戴设备和家庭自动化系统整合。
人工智慧和机器学习在雷达、卫星和感测器资料处理中的应用,正在彻底改变风暴追踪,使其能够实现更快、更精准的天气预报。这些先进技术即时筛选大量资料,识别人工分析可能遗漏的模式和异常。这不仅提高了预报的准确性,还缩短了发布预警所需的时间,使社区和紧急应变人员能够更有效地做好准备。因此,用户可以获得及时可靠的信息,从而降低风险,并提高恶劣天气事件期间的安全性。此外,人工智慧驱动的洞察使应用程式能够个性化警报和建议,增强参与度,并确保关键更新在最需要的时候传达给合适的用户。
| 市场范围 | |
|---|---|
| 起始年份 | 2024 |
| 预测年份 | 2025-2034 |
| 起始值 | 9.14亿美元 |
| 预测值 | 15.3亿美元 |
| 复合年增长率 | 5.6% |
2024年,Android 市场占据了 55% 的市场份额,预计到 2034 年将以 5% 的复合年增长率成长。 Android 的主导地位得益于其全球广泛采用、价格实惠以及丰富的硬体选择。热门的风暴追踪应用程式针对 Android 进行了最佳化,具有可自订的小部件和离线功能。由于用户群的快速成长,该平台的下载量最高,尤其是在亚太和拉丁美洲等地区。
先进的雷达和卫星影像领域在2024年占了30%的市场份额,预计2025年至2034年的复合年增长率将达到6%。这项技术几乎是所有顶级风暴追踪应用程式的基石,提供即时视觉化和高解析度雷达迭加图。这些功能使用户能够在飓风、龙捲风和山洪暴发等重大天气事件期间做出明智的决策。
2024年,美国风暴追踪应用市场占85%的市场份额,产值达2.934亿美元。强大的气象监测基础设施、频繁的恶劣天气以及对及时预警的强烈需求,共同支撑着这个市场领先地位。关键组织和产业领袖的参与也促进了联邦、州和地方机构之间的合作。
引领风暴追踪应用程式市场的领先公司包括 Radarscope LLC、The Weather Company、Severe WX Warn、AccuWeather Inc.、DTN LLC、Apalon LLC、CARROT Weather、ACME AtronOmatic、Weatherbug 和 The Scripps Company。为了在风暴追踪应用市场站稳脚跟,各公司正大力整合尖端人工智慧和机器学习技术,以提供更准确、更及时的预报。开发具有高级雷达迭加和即时闪电追踪等独家功能的高级订阅模式有助于实现产品差异化。与政府机构和紧急服务机构建立策略伙伴关係,可提升可信度和使用者信任度。扩展跨平台相容性(尤其是 Android 和 iOS 之间的相容性)可扩大其覆盖范围,同时改善使用者介面和自订选项可提高参与度。
目录
第一章:方法论
- 市场范围和定义
- 研究设计
- 研究方法
- 资料收集方法
- 资料探勘来源
- 全球的
- 地区/国家
- 基础估算与计算
- 基准年计算
- 市场评估的主要趋势
- 初步研究和验证
- 主要来源
- 预测模型
- 研究假设和局限性
第二章:执行摘要
第三章:行业洞察
- 产业生态系统分析
- 供应商格局
- 利润率分析
- 成本结构
- 每个阶段的增值
- 影响价值链的因素
- 中断
- 产业衝击力
- 成长动力
- 智慧型手机和行动互联网的普及
- 极端天气发生频率和严重程度不断增加
- 对即时警报和个人化功能的需求
- 提高灾害防范意识
- 产业陷阱与挑战
- 数据准确性和及时性挑战
- 成本高且市场饱和
- 市场机会
- 透过订阅模式对高阶应用功能的需求不断增长
- 与机构和气象部门的合作
- 服务欠缺的热带地区的扩张潜力
- 加强与智慧城市和公共基础设施的整合
- 成长动力
- 监管格局
- 北美洲
- 欧洲
- 亚太地区
- 拉丁美洲
- 中东和非洲
- 波特的分析
- PESTEL分析
- 技术和创新格局
- 当前的技术趋势
- 新兴技术
- 客户洞察和采用趋势
- 最终用途细分与偏好
- 使用模式和应用程式功能需求
- 区域采用率和障碍
- 定价策略与货币化模型
- 免费增值模式与订阅模式
- 应用程式内广告和合作收入
- 企业与消费者定价差异
- 环境和社会影响
- 在气候变迁意识和减灾方面的作用
- 主要参与者的社会责任倡议
- 专利分析
- 用例
- 最佳情况
第四章:竞争格局
- 介绍
- 公司市占率分析
- 北美洲
- 欧洲
- 亚太地区
- 拉丁美洲
- MEA
- 主要市场参与者的竞争分析
- 竞争定位矩阵
- 战略展望矩阵
- 关键进展
- 併购
- 伙伴关係与合作
- 新产品发布
- 扩张计划和资金
第五章:市场估计与预测:按作业系统,2021 - 2034 年
- 主要趋势
- 安卓
- iOS
- 其他的
第六章:市场估计与预测:依功能划分,2021 - 2034 年
- 主要趋势
- 基本风暴警报
- 先进的雷达和卫星图像
- 即时 GPS 追踪和风暴路径预测
- 整合应急通讯工具
- 自订天气通知和预报
- 其他的
第七章:市场估计与预测:按部署模式,2021 - 2034 年
- 主要趋势
- 基于云端
- 本地
- 杂交种
第八章:市场估计与预测:按解决方案,2021 - 2034 年
- 主要趋势
- 实时雷达和卫星应用程式
- 风暴预报和预报应用程式
- 多灾害预警平台
- 航空和海上风暴监测应用程式
- 穿戴式及智慧型装置集成
- 其他的
第九章:市场估计与预测:依最终用途,2021 - 2034 年
- 主要趋势
- 普通大众
- 政府机构
- 农业和耕作
- 航空和航空公司
- 海运和航运
- 物流和供应链
- 其他的
第十章:市场估计与预测:按地区,2021 - 2034 年
- 主要趋势
- 北美洲
- 我们
- 加拿大
- 欧洲
- 德国
- 英国
- 法国
- 义大利
- 西班牙
- 俄罗斯
- 亚太地区
- 中国
- 印度
- 日本
- 澳洲
- 韩国
- 菲律宾
- 印尼
- 新加坡
- 拉丁美洲
- 巴西
- 墨西哥
- 阿根廷
- MEA
- 南非
- 沙乌地阿拉伯
- 阿联酋
- 奈及利亚
第 11 章:公司简介
- Global Players
- Professional and Specialized Players
- Consumer-Focused Players
- Government and Emergency Management
- Technology and Data Providers
- Emerging and Niche Players
- International Players
The Global Storm Tracking Apps Market was valued at USD 914 million in 2024 and is estimated to grow at a CAGR of 5.6% to reach USD 1.53 billion by 2034. With extreme weather events becoming more frequent and severe, storm tracking apps have evolved from basic alert systems into essential tools for risk management and emergency preparedness. Collaboration between governments and private incubators is accelerating app innovation and adoption. Premium applications offering advanced radar tracking and tiered subscription models lead the market, catering to professionals and weather enthusiasts who demand precise, data-rich features. Many platforms provide high-fidelity storm models, real-time lightning detection, and historical tracking data, and are increasingly integrating with smart wearables and home automation systems.
The application of artificial intelligence and machine learning in processing radar, satellite, and sensor data is revolutionizing storm tracking by enabling faster and more precise weather predictions. These advanced technologies sift through vast amounts of data in real time, identifying patterns and anomalies that human analysis might miss. This not only boosts the accuracy of forecasts but also shortens the time needed to issue warnings, allowing communities and emergency responders to prepare more effectively. As a result, users benefit from timely, reliable information that helps reduce risks and improve safety during severe weather events. Furthermore, AI-driven insights allow apps to personalize alerts and recommendations, enhancing engagement and ensuring that critical updates reach the right people when they need them most.
| Market Scope | |
|---|---|
| Start Year | 2024 |
| Forecast Year | 2025-2034 |
| Start Value | $914 Million |
| Forecast Value | $1.53 Billion |
| CAGR | 5.6% |
The Android segment accounted for a 55% share in 2024 and is expected to grow at a CAGR of 5% through 2034. Android's dominance is fueled by its widespread global adoption, affordability, and extensive hardware variety. Popular storm tracking applications are optimized for Android, featuring customizable widgets and offline capabilities. The platform sees the highest download volumes, particularly in regions like Asia-Pacific and Latin America, driven by a rapidly expanding user base.
The advanced radar and satellite imagery segment held a 30% share in 2024 and is projected to grow at a CAGR of 6% from 2025 to 2034. This technology is the cornerstone of nearly all top storm tracking apps, offering real-time visualization and high-resolution radar overlays. Features like these empower users to make informed decisions during critical weather events such as hurricanes, tornadoes, and flash floods.
United States Storm Tracking Apps Market held an 85% share in 2024, generating USD 293.4 million. This leadership position is supported by robust weather monitoring infrastructure, frequent severe weather occurrences, and a strong demand for timely alerts. The presence of key organizations and industry leaders also promotes collaboration across federal, state, and local agencies.
Leading companies shaping the Storm Tracking Apps Market include Radarscope LLC, The Weather Company, Severe WX Warn, AccuWeather Inc., DTN LLC, Apalon LLC, CARROT Weather, ACME AtronOmatic, Weatherbug, and The Scripps Company. To build a stronger foothold in the Storm Tracking Apps Market, companies are focusing heavily on integrating cutting-edge AI and machine learning technologies to deliver more accurate and timely forecasts. Developing premium, subscription-based models with exclusive features like advanced radar overlays and real-time lightning tracking helps differentiate offerings. Strategic partnerships with government agencies and emergency services enhance credibility and user trust. Expanding cross-platform compatibility, especially between Android and iOS, broadens their reach, while improving user interface and customization options boosts engagement.
Table of Contents
Chapter 1 Methodology
- 1.1 Market scope and definition
- 1.2 Research design
- 1.2.1 Research approach
- 1.2.2 Data collection methods
- 1.3 Data mining sources
- 1.3.1 Global
- 1.3.2 Regional/Country
- 1.4 Base estimates and calculations
- 1.4.1 Base year calculation
- 1.4.2 Key trends for market estimation
- 1.5 Primary research and validation
- 1.5.1 Primary sources
- 1.6 Forecast model
- 1.7 Research assumptions and limitations
Chapter 2 Executive Summary
- 2.1 Industry 3600 synopsis, 2021 - 2034
- 2.2 Key market trends
- 2.2.1 Regional
- 2.2.2 Operating system
- 2.2.3 Functionality
- 2.2.4 Deployment mode
- 2.2.5 Solution
- 2.2.6 End Use
- 2.3 TAM Analysis, 2025-2034
- 2.4 CXO perspectives: Strategic imperatives
- 2.4.1 Executive decision points
- 2.4.2 Critical success factors
- 2.5 Future outlook and strategic recommendations
Chapter 3 Industry Insights
- 3.1 Industry ecosystem analysis
- 3.1.1 Supplier landscape
- 3.1.2 Profit margin analysis
- 3.1.3 Cost structure
- 3.1.4 Value addition at each stage
- 3.1.5 Factor affecting the value chain
- 3.1.6 Disruptions
- 3.2 Industry impact forces
- 3.2.1 Growth drivers
- 3.2.1.1 Smartphone & mobile internet proliferation
- 3.2.1.2 Growing frequency & severity of extreme weather
- 3.2.1.3 Demand for real-time alerts & personalized features
- 3.2.1.4 Rising awareness of disaster preparedness
- 3.2.2 Industry pitfalls and challenges
- 3.2.2.1 Data accuracy & timeliness challenges
- 3.2.2.2 High cost & market saturation
- 3.2.3 Market opportunities
- 3.2.3.1 Rising demand for premium app features via subscription models
- 3.2.3.2 Partnerships with agencies & meteorological services
- 3.2.3.3 Expansion potential in underserved tropical regions
- 3.2.3.4 Increase in integration with smart cities and public infrastructure
- 3.2.1 Growth drivers
- 3.3 Regulatory landscape
- 3.3.1 North America
- 3.3.2 Europe
- 3.3.3 Asia Pacific
- 3.3.4 Latin America
- 3.3.5 Middle East & Africa
- 3.4 Porter's analysis
- 3.5 PESTEL analysis
- 3.6 Technology and Innovation landscape
- 3.6.1 Current technological trends
- 3.6.2 Emerging technologies
- 3.7 Customer insights & adoption trends
- 3.7.1 End use segmentation and preferences
- 3.7.2 Usage patterns and app feature demand
- 3.7.3 Regional adoption rates and barriers
- 3.8 Pricing strategies & monetization models
- 3.8.1 Freemium vs. subscription models
- 3.8.2 In-app advertising and partnership revenues
- 3.8.3 Enterprise vs. consumer pricing differentiation
- 3.9 Environmental and social impact
- 3.9.1 Role in climate change awareness and disaster mitigation
- 3.9.2 Social responsibility initiatives by key players
- 3.10 Patent analysis
- 3.11 Use cases
- 3.12 Best-case scenario
Chapter 4 Competitive Landscape, 2024
- 4.1 Introduction
- 4.2 Company market share analysis
- 4.2.1 North America
- 4.2.2 Europe
- 4.2.3 Asia Pacific
- 4.2.4 LATAM
- 4.2.5 MEA
- 4.3 Competitive analysis of major market players
- 4.4 Competitive positioning matrix
- 4.5 Strategic outlook matrix
- 4.6 Key developments
- 4.6.1 Mergers & acquisitions
- 4.6.2 Partnerships & collaborations
- 4.6.3 New Product Launches
- 4.6.4 Expansion Plans and funding
Chapter 5 Market Estimates & Forecast, By Operating System, 2021 - 2034 ($Bn)
- 5.1 Key trends
- 5.2 Android
- 5.3 IOS
- 5.4 Others
Chapter 6 Market Estimates & Forecast, By Functionality, 2021 - 2034 ($Bn)
- 6.1 Key trends
- 6.2 Basic storm alerts
- 6.3 Advanced radar and satellite imagery
- 6.4 Real-time GPS tracking and storm path prediction
- 6.5 Integrated emergency communication tools
- 6.6 Custom weather notifications and forecasting
- 6.7 Others
Chapter 7 Market Estimates & Forecast, By Deployment Mode, 2021 - 2034 ($Bn)
- 7.1 Key trends
- 7.2 Cloud-based
- 7.3 On-premises
- 7.4 Hybrid
Chapter 8 Market Estimates & Forecast, By Solution, 2021 - 2034 ($Bn)
- 8.1 Key trends
- 8.2 Real-time radar and satellite apps
- 8.3 Storm prediction and forecasting apps
- 8.4 Multi-hazard alerting platforms
- 8.5 Aviation and maritime storm monitoring apps
- 8.6 Wearable and smart device integration
- 8.7 Others
Chapter 9 Market Estimates & Forecast, By End Use, 2021 - 2034 ($Bn)
- 9.1 Key trends
- 9.2 General public
- 9.3 Government agencies
- 9.4 Agriculture and farming
- 9.5 Aviation and airlines
- 9.6 Maritime and shipping
- 9.7 Logistics and supply chain
- 9.8 Others
Chapter 10 Market Estimates & Forecast, By Region, 2021 - 2034 ($Bn)
- 10.1 Key trends
- 10.2 North America
- 10.2.1 US
- 10.2.2 Canada
- 10.3 Europe
- 10.3.1 Germany
- 10.3.2 UK
- 10.3.3 France
- 10.3.4 Italy
- 10.3.5 Spain
- 10.3.6 Russia
- 10.4 Asia Pacific
- 10.4.1 China
- 10.4.2 India
- 10.4.3 Japan
- 10.4.4 Australia
- 10.4.5 South Korea
- 10.4.6 Philippines
- 10.4.7 Indonesia
- 10.4.8 Singapore
- 10.5 Latin America
- 10.5.1 Brazil
- 10.5.2 Mexico
- 10.5.3 Argentina
- 10.6 MEA
- 10.6.1 South Africa
- 10.6.2 Saudi Arabia
- 10.6.3 UAE
- 10.6.4 Nigeria
Chapter 11 Company Profiles
- 11.1 Global Players
- 11.1.1 AccuWeather.lNC
- 11.1.2 ACME AtronOmatic
- 11.1.3 Apalon LLC
- 11.1.4 CARROT Weather
- 11.1.5 DTN LLC
- 11.1.6 Severe WX Warn
- 11.1.7 The Scripps Company
- 11.1.8 The weather company
- 11.1.9 Weatherbug
- 11.1.10 SpotWX
- 11.1.11 SteamSpy
- 11.1.12 Tomorrow.io
- 11.1.13 Tropical Tidbits
- 11.1.14 Ventusky
- 11.2 Professional and Specialized Players
- 11.2.1 RadarScope
- 11.2.2 RadarOmega
- 11.2.3 Storm Shield
- 11.3 Consumer-Focused Players
- 11.3.1 Clime Weather Service
- 11.3.2 Windy.app
- 11.3.3 RainViewer
- 11.4 Government and Emergency Management
- 11.4.1 FEMA (Federal Emergency Management Agency)
- 11.4.2 State Emergency Management Agencies
- 11.5 Technology and Data Providers
- 11.5.1 Tomorrow.io
- 11.5.2 National Weather Service (NWS)
- 11.6 Emerging and Niche Players
- 11.6.1 WeatherBug
- 11.6.2 MyRadar
- 11.6.3 Dark Sky (Apple)
- 11.6.4 Weatherology
- 11.7 International Players
- 11.7.1 MeteoGroup (DTN)
- 11.7.2 Foreca


