


 |
市场调查报告书
商品编码
1801821
饭店收入管理与定价分析市场机会、成长动力、产业趋势分析及 2025 - 2034 年预测Hospitality Revenue Management and Pricing Analytics Market Opportunity, Growth Drivers, Industry Trend Analysis, and Forecast 2025 - 2034 |
||||||
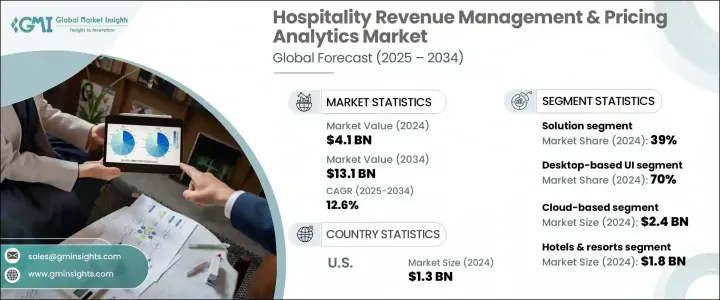
2024年,全球饭店收益管理与定价分析市场规模达41亿美元,预计年复合成长率将达12.6%,2034年将达到131亿美元。对敏捷、数据驱动的定价模型的需求日益增长,正在重塑酒店业的运作方式。由于竞争加剧和宾客偏好的转变,标准定价方法正迅速过时。取而代之的是,该行业正转向由机器学习、人工智慧和云端收益管理平台支援的动态定价。
这些技术使饭店能够更好地预测需求、评估竞争性定价并做出更明智的定价决策,不仅提高入住率,还能提高每间可用客房收入 (RevPAR)。饭店利用整合的 RMS 解决方案和行动互动工具进行宾客服务和忠诚度追踪,同时优化能源利用并提升宾客体验。这种数位转型透过连结预订系统、在地服务和个人化宾客沟通,既能为宾客带来便利,又能促进收入成长。
| 市场范围 | |
|---|---|
| 起始年份 | 2024 |
| 预测年份 | 2025-2034 |
| 起始值 | 41亿美元 |
| 预测值 | 131亿美元 |
| 复合年增长率 | 12.6% |
2024年,基于云端的细分市场创造了24亿美元的市场份额。这些系统提供即时分析和自动化策略调整,为不同地区的营运商提供实际的洞察。其灵活性尤其有利于大型酒店集团和多品牌营运。与通路管理器、中央预订系统 (CRS) 和物业管理系统 (PMS) 等其他核心系统的集成,创建了一个统一的技术生态系统,实现了无缝的资料共享和价格控制。这些平台还能增强直接预订和第三方预订管道的价格管理,进而提高利润率和营运敏捷性。
2024年,饭店及度假村板块的收入达到18亿美元。该行业竞争激烈,客流量巨大,需要精准的定价策略来最大化客房入住率和总收入。饭店管理着各种各样的收入来源——从住宿到餐饮服务、健康中心和活动场地——因此,所有营运领域都需要同步定价和先进的需求预测。由于重视每间客房的收入和每个部门的获利能力,高级分析技术的应用至关重要。
2024年,美国饭店收入管理和定价分析市场在创新和尖端技术的推动下创造了可观的收入。美国各地领先的酒店品牌已在预测分析、人工智慧驱动的决策工具和即时定价模型方面投入大量资金。这些系统会评估入住率模式、顾客预订行为、市场动态和竞争价格,进而产生动态定价模型。美国酒店已创建以分析为先的文化,以支持更明智的业务决策并提升营运绩效。
推动饭店收益管理和定价分析市场创新的关键参与者包括 SAP SE、Lybra、华为、甲骨文、Atomize RMS、FLYR Hospitality 和 BEONx。这些公司凭藉着先进的技术和智慧定价工具,在市场格局的演变中发挥了重要作用。为了在饭店收益管理和定价分析市场中占据更强大的地位,各大公司已采取了各种策略倡议。其中,主要重点是开发基于人工智慧的平台,以实现即时决策和动态定价优化。许多公司正在增强其基于云端的 RMS 产品,以确保可扩展性、更快的更新速度以及与现有酒店系统(如 PMS 和 CRS)的整合。
目录
第一章:方法论与范围
第二章:执行摘要
第三章:行业洞察
- 产业生态系统分析
- 供应商格局
- 技术供应商和开发商
- 系统整合商和顾问
- 数据提供者和市场情报
- 旅馆经营者和收益经理
- 分销合作伙伴和通路
- 成本结构
- 利润率
- 每个阶段的增值
- 影响供应链的因素
- 破坏者
- 供应商格局
- 对部队的影响
- 成长动力
- 饭店业的数位转型
- 竞争压力与利润优化
- 客人对动态定价的期望
- 配销通路复杂性管理
- 产业陷阱与挑战
- 员工培训与管理
- 实施和维护成本高
- 市场机会
- 新冠疫情后的恢復与适应
- 永续性和 ESG 整合
- 成长动力
- 成长潜力分析
- 波特的分析
- PESTEL分析
- 技术与创新格局
- 现有技术
- 新兴技术
- 专利分析
- 监管格局
- 北美洲
- 欧洲
- 亚太地区
- 拉丁美洲
- 中东和非洲
- 实施方法
- 分阶段推出策略
- 试点计画框架
- 大爆炸实施方法
- 混合实施模型
- 风险缓解策略
- 变更管理框架
- 利害关係人的参与与支持
- 培训和技能发展
- 流程再造与优化
- 绩效衡量
- 持续改善流程
- 资料整合与迁移
- 历史资料分析与清理
- 即时资料馈送集成
- 第三方资料来源集成
- 数据品质保证流程
- 备份和復原过程
- 成功因素和最佳实践
- 高阶主管支持和领导
- 跨职能团队协作
- 供应商合作与支持
- 用户采用和参与
- 效能监控和优化
- 实施挑战和解决方案
- 技术整合的复杂性
- 数据孤岛和不一致
- 员工抵触情绪和训练差距
- 预算限制和投资报酬率压力
- 时间轴和资源管理
- 可持续性分析
- 永续实践
- 减少废弃物的策略
- 生产中的能源效率
- 环保倡议
- 碳足迹考量
第四章:竞争格局
- 介绍
- 公司市占率分析
- 北美洲
- 欧洲
- 亚太地区
- 拉丁美洲
- 中东和非洲
- 竞争定位矩阵
- 战略展望矩阵
- 关键进展
- 併购
- 伙伴关係与合作
- 新产品发布
- 扩张计划和资金
第五章:市场估计与预测:按组件,2021 - 2034 年
- 主要趋势
- 解决方案
- 收益管理系统(RMS)
- 预测和需求建模
- 计费和付款
- 商业智慧和报告
- 定价分析平台
- 通路管理
- 其他的
- 服务
- 专业服务
- 咨询与策略
- 部署与集成
- 支援与维护
- 託管服务
- 专业服务
- 解决方案
第六章:市场估计与预测:依平台,2021 - 2034 年
- 主要趋势
- 基于桌面的使用者介面
- 行动/平板电脑 RMS 应用
第七章:市场估计与预测:依部署模型,2021 - 2034 年
- 主要趋势
- 基于云端
- 本地
- 杂交种
第八章:市场估计与预测:依所有权划分,2021 - 2034 年
- 主要趋势
- 独立的
- 连锁店和特许经营店
- 租赁和管理
第九章:市场估计与预测:按应用,2021 - 2034 年
- 主要趋势
- 客房收益管理
- 餐饮收入管理
- 水疗和健康收入管理
- 活动和会议收入管理
- 辅助收入管理
- 全面收益管理
第十章:市场估计与预测:依最终用途,2021 - 2034 年
- 主要趋势
- 饭店及度假村
- 餐厅及食品服务
- 邮轮公司和赌场
- 短期租赁
- 长期住宿饭店及公寓饭店
第 11 章:市场估计与预测:按地区,2021 年至 2034 年
- 北美洲
- 我们
- 加拿大
- 欧洲
- 英国
- 德国
- 法国
- 义大利
- 西班牙
- 比利时
- 荷兰
- 瑞典
- 亚太地区
- 中国
- 印度
- 日本
- 澳洲
- 新加坡
- 韩国
- 越南
- 泰国
- 菲律宾
- 印尼
- 拉丁美洲
- 巴西
- 墨西哥
- 阿根廷
- MEA
- 南非
- 沙乌地阿拉伯
- 阿联酋
第十二章:公司简介
- Aiosell
- Mews
- BEONx
- Cendyn
- Cloudbeds
- Duetto
- eZee Mint
- FLYR Hospitality
- Hotellistat
- Huawei
- IDeaS Revenue Solutions
- Infor
- Lighthouse Intelligence
- Lybra
- Oracle
- PriceLabs
- Revnomix Solutions
- RevPar Guru
- RoomPriceGenie
- SAP SE
The Global Hospitality Revenue Management & Pricing Analytics Market was valued at USD 4.1 billion in 2024 and is estimated to grow at a CAGR of 12.6% to reach USD 13.1 billion by 2034. The increasing need for agile, data-driven pricing models is reshaping how hospitality businesses operate. Standard pricing methods are quickly becoming outdated due to rising competition and shifting guest preferences. Instead, the industry is gravitating toward dynamic pricing supported by machine learning, artificial intelligence, and cloud-powered revenue management platforms.
These technologies enable hotels to better forecast demand, evaluate competitive pricing, and make smarter pricing decisions that not only improve occupancy but also drive higher revenue per available room (RevPAR). Properties leveraging integrated RMS solutions with mobile engagement tools for guest services and loyalty tracking are also optimizing energy use and enhancing guest experiences. This digital shift supports both guest convenience and revenue growth by connecting reservation systems, local services, and personalized guest communication.
| Market Scope | |
|---|---|
| Start Year | 2024 |
| Forecast Year | 2025-2034 |
| Start Value | $4.1 Billion |
| Forecast Value | $13.1 Billion |
| CAGR | 12.6% |
The cloud-based segment generated USD 2.4 billion share in 2024. These systems offer real-time analytics and automated strategy adjustments, giving operators across various locations actionable insights. Their flexibility is particularly beneficial for larger hotel groups and multi-brand operations. Integration with other core systems like channel managers, central reservation systems (CRS), and property management systems (PMS) creates a unified technology ecosystem, allowing for seamless data sharing and pricing control. These platforms also enhance rate management across direct and third-party booking channels, improving both profit margins and operational agility.
The hotels and resorts segment generated USD 1.8 billion in 2024. This sector faces aggressive competition and operates at high volume, requiring precision in pricing strategies to maximize room occupancy and overall revenue. Hotels manage a diverse set of revenue streams-from accommodations to food services, wellness centers, and event spaces-which necessitate synchronized pricing and advanced demand prediction across all operational areas. The emphasis on revenue per room and profitability per department makes the use of advanced analytics indispensable.
United States Hospitality Revenue Management & Pricing Analytics Market generated significant revenues in 2024 driven by innovation and adopting cutting-edge technologies. Leading hotel brands across the US have heavily invested in predictive analytics, AI-driven decision-making tools, and real-time pricing models. These systems assess occupancy patterns, customer booking behaviors, market dynamics, and competitive rates to generate dynamic pricing models. US-based hotels have created an analytics-first culture that supports smarter business decisions and enhances operational performance.
Key players driving innovation in Hospitality Revenue Management & Pricing Analytics Market include SAP SE, Lybra, Huawei, Oracle, Atomize RMS, FLYR Hospitality, and BEONx. These companies are instrumental in evolving the market landscape with advanced technologies and intelligent pricing tools. To establish a stronger presence in the hospitality revenue management and pricing analytics market, major companies have embraced a variety of strategic initiatives. A primary focus is on developing AI-powered platforms that enable real-time decision-making and dynamic pricing optimization. Many firms are enhancing their cloud-based RMS offerings to ensure scalability, faster updates, and integration with existing hotel systems such as PMS and CRS.
Table of Contents
Chapter 1 Methodology & Scope
- 1.1 Research design
- 1.1.1 Research approach
- 1.1.2 Data collection methods
- 1.2 Data mining sources
- 1.2.1 Global
- 1.2.2 Regional/Country
- 1.3 Base estimates & calculations
- 1.3.1 Base year calculation
- 1.3.2 Key trends for market estimation
- 1.4 Forecast model
- 1.5 Primary research and validation
- 1.5.1 Primary sources
- 1.6 Research assumptions and limitations
Chapter 2 Executive Summary
- 2.1 Industry 360° synopsis
- 2.2 Key market trends
- 2.2.1 Regional
- 2.2.2 Offering
- 2.2.3 Platform
- 2.2.4 Deployment model
- 2.2.5 Ownership
- 2.2.6 Application
- 2.2.7 End use
- 2.3 TAM Analysis, 2025-2034
- 2.4 CXO perspectives: Strategic imperatives
- 2.4.1 Key decision points for industry executives
- 2.4.2 Critical success factors for market players
- 2.5 Future outlook and strategic recommendations
Chapter 3 Industry Insights
- 3.1 Industry ecosystem analysis
- 3.1.1 Supplier landscape
- 3.1.1.1 Technology vendors and developers
- 3.1.1.2 System integrators and consultants
- 3.1.1.3 Data providers and market intelligence
- 3.1.1.4 Hotel operators and revenue managers
- 3.1.1.5 Distribution partners and channels
- 3.1.2 Cost structure
- 3.1.3 Profit margin
- 3.1.4 Value addition at each stage
- 3.1.5 Factors impacting the supply chain
- 3.1.6 Disruptors
- 3.1.1 Supplier landscape
- 3.2 Impact on forces
- 3.2.1 Growth drivers
- 3.2.1.1 Digital transformation in hospitality
- 3.2.1.2 Competitive pressure and profit optimization
- 3.2.1.3 Guest expectations for dynamic pricing
- 3.2.1.4 Distribution channel complexity management
- 3.2.2 Industry pitfalls & challenges
- 3.2.2.1 Staff training and management
- 3.2.2.2 High implementation and maintenance costs
- 3.2.3 Market opportunities
- 3.2.3.1 Post-COVID recovery and adaptation
- 3.2.3.2 Sustainability and ESG integration
- 3.2.1 Growth drivers
- 3.3 Growth potential analysis
- 3.4 Porter’s analysis
- 3.5 PESTEL analysis
- 3.6 Technology & innovation landscape
- 3.6.1 Current technologies
- 3.6.2 Emerging technologies
- 3.7 Patent analysis
- 3.8 Regulatory landscape
- 3.8.1 North America
- 3.8.2 Europe
- 3.8.3 Asia Pacific
- 3.8.4 Latin America
- 3.8.5 Middle East & Africa
- 3.9 Implementation methodologies
- 3.9.1 Phased rollout strategies
- 3.9.2 Pilot program frameworks
- 3.9.3 Big bang implementation approaches
- 3.9.4 Hybrid implementation models
- 3.9.5 Risk mitigation strategies
- 3.10 Change management framework
- 3.10.1 Stakeholder engagement and buy-in
- 3.10.2 Training and skill development
- 3.10.3 Process reengineering and optimization
- 3.10.4 Performance measurement
- 3.10.5 Continuous improvement processes
- 3.11 Data integration and migration
- 3.11.1 Historical data analysis and cleansing
- 3.11.2 Real-time data feed integration
- 3.11.3 Third-party data source integration
- 3.11.4 Data quality assurance processes
- 3.11.5 Backup and recovery procedures
- 3.12 Success factors and best practices
- 3.12.1 Executive sponsorship and leadership
- 3.12.2 Cross-functional team collaboration
- 3.12.3 Vendor partnership and support
- 3.12.4 User adoption and engagement
- 3.12.5 Performance monitoring and optimization
- 3.13 Implementation challenges and solutions
- 3.13.1 Technical integration complexities
- 3.13.2 Data silos and inconsistencies
- 3.13.3 Staff resistance and training gaps
- 3.13.4 Budget constraints and ROI pressure
- 3.13.5 Timeline and resource management
- 3.14 Sustainability analysis
- 3.14.1 Sustainable practices
- 3.14.2 Waste reduction strategies
- 3.14.3 Energy efficiency in production
- 3.14.4 Eco-friendly initiatives
- 3.14.5 Carbon footprint considerations
Chapter 4 Competitive Landscape, 2024
- 4.1 Introduction
- 4.2 Company market share analysis
- 4.2.1 North America
- 4.2.2 Europe
- 4.2.3 Asia Pacific
- 4.2.4 Latin America
- 4.2.5 Middle East & Africa
- 4.3 Competitive positioning matrix
- 4.4 Strategic outlook matrix
- 4.5 Key developments
- 4.5.1 Mergers & acquisitions
- 4.5.2 Partnerships & collaborations
- 4.5.3 New Product Launches
- 4.6 Expansion Plans and funding
Chapter 5 Market Estimates & Forecast, By Component, 2021 - 2034 ($Bn)
- 5.1 Key trends
- 5.1.1 Solution
- 5.1.1.1 Revenue Management System (RMS)
- 5.1.1.2 Forecasting & demand modeling
- 5.1.1.3 Billing and payment
- 5.1.1.4 Business intelligence and reporting
- 5.1.1.5 Pricing analytics platforms
- 5.1.1.6 Channel management
- 5.1.1.7 Others
- 5.1.2 Services
- 5.1.2.1 Professional services
- 5.1.2.1.1 Consulting & strategy
- 5.1.2.1.2 Deployment & integration
- 5.1.2.1.3 Support & maintenance
- 5.1.2.2 Managed services
- 5.1.2.1 Professional services
- 5.1.1 Solution
Chapter 6 Market Estimates & Forecast, By Platform, 2021 - 2034 ($Bn)
- 6.1 Key trends
- 6.2 Desktop-based UI
- 6.3 Mobile/Tablet RMS Apps
Chapter 7 Market Estimates & Forecast, By Deployment Model, 2021 - 2034 ($Bn)
- 7.1 Key trends
- 7.2 Cloud-based
- 7.3 On-premises
- 7.4 Hybrid
Chapter 8 Market Estimates & Forecast, By Ownership, 2021 - 2034 ($Bn)
- 8.1 Key trends
- 8.2 Independent
- 8.3 Chain and franchises
- 8.4 Leased and managed
Chapter 9 Market Estimates & Forecast, By Application, 2021 - 2034 ($Bn)
- 9.1 Key trends
- 9.2 Room revenue management
- 9.3 Food and beverage revenue management
- 9.4 Spa and wellness revenue management
- 9.5 Event and meeting revenue management
- 9.6 Ancillary revenue management
- 9.7 Total revenue management
Chapter 10 Market Estimates & Forecast, By End Use, 2021 - 2034 ($Bn)
- 10.1 Key trends
- 10.2 Hotels & resorts
- 10.3 Restaurants & food services
- 10.4 Cruise lines & casinos
- 10.5 Short-term rentals
- 10.6 Extended stay and apartment hotels
Chapter 11 Market Estimates & Forecast, By Region, 2021 - 2034 ($Bn)
- 11.1 North America
- 11.1.1 U.S.
- 11.1.2 Canada
- 11.2 Europe
- 11.2.1 UK
- 11.2.2 Germany
- 11.2.3 France
- 11.2.4 Italy
- 11.2.5 Spain
- 11.2.6 Belgium
- 11.2.7 Netherlands
- 11.2.8 Sweden
- 11.3 Asia Pacific
- 11.3.1 China
- 11.3.2 India
- 11.3.3 Japan
- 11.3.4 Australia
- 11.3.5 Singapore
- 11.3.6 South Korea
- 11.3.7 Vietnam
- 11.3.8 Thailand
- 11.3.9 Philippines
- 11.3.10 Indonesia
- 11.4 Latin America
- 11.4.1 Brazil
- 11.4.2 Mexico
- 11.4.3 Argentina
- 11.5 MEA
- 11.5.1 South Africa
- 11.5.2 Saudi Arabia
- 11.5.3 UAE
Chapter 12 Company Profiles
- 12.1 Aiosell
- 12.2 Mews
- 12.3 BEONx
- 12.4 Cendyn
- 12.5 Cloudbeds
- 12.6 Duetto
- 12.7 eZee Mint
- 12.8 FLYR Hospitality
- 12.9 Hotellistat
- 12.10 Huawei
- 12.11 IDeaS Revenue Solutions
- 12.12 Infor
- 12.13 Lighthouse Intelligence
- 12.14 Lybra
- 12.15 Oracle
- 12.16 PriceLabs
- 12.17 Revnomix Solutions
- 12.18 RevPar Guru
- 12.19 RoomPriceGenie
- 12.20 SAP SE
 2026年全球倡议软体市场报告
 通讯管理系统市场:按组件类型、产业和组织规模划分 - 2026-2032 年全球预测2026年全球排放管理软体市场报告2026年全球数位饭店市场报告中央厨房管理软体市场按产品类型、功能和最终用户划分,全球预测(2026-2032)
 全球笔记管理软体市场规模、份额、趋势和成长分析报告(2026-2034)社会工作个案管理软体全球市场报告(2026年)
 休閒管理软体市场-全球产业规模、份额、趋势、机会及预测(依设施类型、部署方式、最终用途、地区及竞争格局划分,2021-2031年)伺服器管理软体市场 - 全球产业规模、份额、趋势、机会、预测:按部署方式、组织规模、垂直市场、地区和竞争格局划分,2021-2031 年供应商关係管理软体市场 - 全球产业规模、份额、趋势、机会、预测(按部署模式、公司规模、产业垂直领域、地区和竞争格局划分,2021-2031 年)