


 |
市场调查报告书
商品编码
1833384
商业显示市场机会、成长动力、产业趋势分析及2025-2034年预测Commercial Display Market Opportunity, Growth Drivers, Industry Trend Analysis, and Forecast 2025 - 2034 |
||||||
2024 年全球商业显示市场价值为 260.6 亿美元,预计将以 7% 的复合年增长率成长,到 2034 年达到 511.6 亿美元。
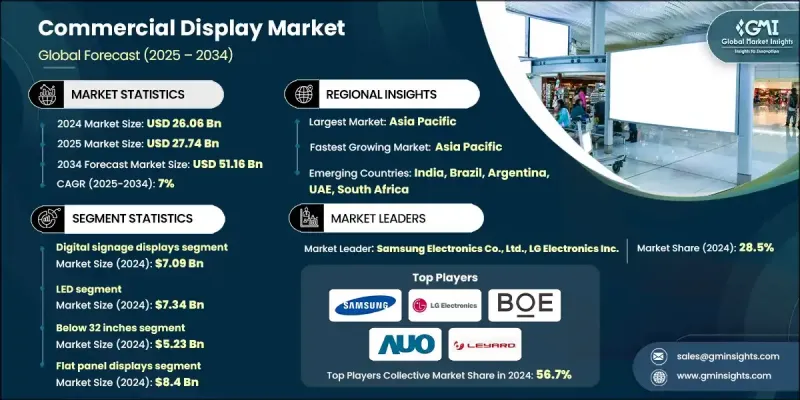
这一成长轨迹得益于商用显示器在数位基础设施中日益重要的作用,尤其是在教育和医疗保健等领域,互动式智慧显示解决方案正在改变人们的参与和沟通方式。随着各机构对其营运和公共服务框架进行现代化改造,对动态即时内容交付系统的需求变得至关重要。如今,智慧显示器不仅在零售和广告领域被视为关键工具,在面向大众的服务领域也日益受到重视。这正推动着智慧显示器在更广泛的垂直领域的应用。此外,在企业大厅、园区和交通枢纽等面向客户的环境中,人们越来越倾向于沉浸式和个人化体验,这正在重新定义显示技术的范围,并推动市场持续成长。
| 市场范围 | |
|---|---|
| 起始年份 | 2024 |
| 预测年份 | 2025-2034 |
| 起始值 | 260.6亿美元 |
| 预测值 | 511.6亿美元 |
| 复合年增长率 | 7% |
2024年,数位看板显示器市场规模达到70.9亿美元,成为商用显示器产业最突出的产品类别。由于交通运输、零售和企业通讯等产业对适应性内容交付平台的需求旺盛,该领域持续蓬勃发展。随着城市基础设施不断发展以支持更智慧的环境,对大型标牌和资讯系统的投资迅速增长。这些显示器使企业和机构能够轻鬆地提供基于位置的内容、事件通知和互动式讯息。
2024年,LED显示器市场规模达73.4亿美元。其广受欢迎源自于其高能源效率、耐用性以及在室内外环境中的多功能性。 LED显示器凭藉其在视讯墙、标牌系统和高解析度广告方面的可扩展性,继续占据市场主导地位。从交通枢纽到市中心和零售店面,LED显示器正成为企业在高人流量和环境光环境下吸引眼球的首选解决方案。其适应性强、使用寿命长,使其在连续使用环境中特别引人注目。
2024年,美国商用显示器市场规模达55.7亿美元,预计到2034年复合年增长率将达7.5%。由于快餐店、零售连锁店、公共交通和娱乐场所等行业的广泛应用,美国在商用显示器的应用方面继续保持领先地位。围绕无障碍设施和公共资讯标准的监管指导日益增多,进一步加速了其在教育机构、机场和政府大楼的部署。这些发展推动了对支援即时通讯、安全更新和互动式导航的先进显示系统的需求,这些系统既要具备功能性,又要符合现代数位基础设施的要求。
影响全球商用显示器市场的主要公司包括松下公司、索尼公司、海信视觉科技股份有限公司、明基电通股份有限公司、达科电子株式会社、三星电子株式会社、佳世达株式会社、夏普株式会社、日本电气株式会社、E Ink Holdings Inc.、巴可公司、美国科视数位系统公司、LG电子公司、台达电子株式会社、优派株式会社、利亚德光电股份有限公司、友达光电株式会社、三菱电机株式会社、平达系统株式会社、京东方科技集团有限公司、Elo Touch Solutions, Inc.、深圳市有限公司。
商业显示器产业的领导者正在大力投资下一代技术,例如微型LED、OLED和互动式触控萤幕,以满足不断变化的客户需求。许多企业专注于扩展其产品组合,以涵盖针对智慧零售、公共基础设施和企业环境的节能、模组化和超高清显示系统。与科技公司和政府机构的策略合作也十分常见,使企业能够参与国家数位转型计画。
目录
第一章:方法论与范围
第 2 章:执行摘要
第三章:行业洞察
- 产业生态系统分析
- 供应商概况
- 利润率
- 成本结构
- 每个阶段的增值
- 影响价值链的因素
- 中断
- 产业衝击力
- 成长动力
- 零售、旅馆和交通运输业对数位看板的需求不断增长
- 采用高解析度显示器(4K/8K)和先进技术(OLED、microLED)
- 人工智慧与基于云端的内容管理的集成
- 智慧城市基础设施和公共服务自动化的成长
- 互动式显示器在教育和医疗保健领域的应用日益增多
- 产业陷阱与挑战
- 供应链中断和生产成本高昂
- 缺乏熟练的安装和维护专业人员
- 市场机会
- 智慧城市与交通枢纽的扩张
- 与楼宇管理和 POS 系统集成
- 基于 SaaS 的内容平台的成长
- 医疗保健和汽车产业的应用
- 成长动力
- 成长潜力分析
- 监管格局
- 北美洲
- 欧洲
- 亚太地区
- 拉丁美洲
- 中东和非洲
- 波特的分析
- PESTEL分析
- 技术和创新格局
- 当前的技术趋势
- 新兴技术
- 价格趋势
- 按地区
- 按产品
- 定价策略
- 新兴商业模式
- 合规性要求
- 永续性措施
- 消费者情绪分析
- 专利和智慧财产权分析
- 地缘政治与贸易动态
第四章:竞争格局
- 公司简介 市占率分析
- 公司市占率分析
- 按地区
- 北美洲
- 欧洲
- 亚太地区
- 市场集中度分析
- 关键参与者的竞争基准化分析
- 财务绩效比较
- 收入
- 利润率
- 研发
- 产品组合比较
- 产品范围广度
- 科技
- 创新
- 地理分布比较
- 全球足迹分析
- 服务网路覆盖
- 各地区市场渗透率
- 竞争定位矩阵
- 领导者
- 挑战者
- 追踪者
- 利基市场参与者
- 战略展望矩阵
- 财务绩效比较
- 2021-2024 年关键发展
- 併购
- 伙伴关係与合作
- 技术进步
- 扩张和投资策略
- 永续发展倡议
- 数位转型计划
- 新兴/新创企业竞争对手格局
第五章:市场估计与预测:依产品类型,2021 - 2034 年
- 主要趋势
- 数位看板显示器
- 互动式白板
- 视讯墙
- 自助服务终端
- 其他的
第六章:市场估计与预测:按技术,2021 - 2034 年
- 主要趋势
- 引领
- 液晶显示器
- OLED
- 其他的
第七章:市场估计与预测:按显示器尺寸,2021 - 2034
- 主要趋势
- 低于 32 英寸
- 32-52英寸
- 52吋以上
第八章:市场估计与预测:按面板类型,2021-2034
- 主要趋势
- 平面显示器(FPD)
- 曲面面板显示器
- 柔性/透明显示器
第九章:市场估计与预测:依最终用途,2021-2034
- 主要趋势
- 饭店业
- 零售
- 运输
- 卫生保健
- 银行和金融服务
- 其他的
第 10 章:市场估计与预测:按地区,2021 年至 2034 年
- 主要趋势
- 北美洲
- 我们
- 加拿大
- 欧洲
- 德国
- 英国
- 法国
- 义大利
- 西班牙
- 荷兰
- 亚太地区
- 中国
- 印度
- 日本
- 韩国
- 澳洲
- 拉丁美洲
- 巴西
- 墨西哥
- 阿根廷
- 中东和非洲
- 阿联酋
- 沙乌地阿拉伯
- 南非
第 11 章:公司简介
- 全球参与者:
- AU Optronics Corp.
- BenQ Corporation
- BOE Technology Group Co., Ltd.
- Leyard Optoelectronic Co., Ltd.
- LG Electronics Inc.
- Mitsubishi Electric Corporation
- NEC Corporation
- Panasonic Corporation
- Samsung Electronics Co., Ltd.
- Sharp Corporation
- Sony Corporation
- 区域参与者:
- Barco NV
- Christie Digital Systems USA, Inc.
- Daktronics, Inc.
- Delta Electronics, Inc.
- Innolux Corporation
- Planar Systems, Inc.
- ViewSonic Corporation
- 新兴参与者:
- E Ink Holdings Inc.
- Elo Touch Solutions, Inc.
- Hisense Visual Technology Co., Ltd.
- Qisda Corporation
- Shenzhen Absen Optoelectronic Co., Ltd.
The Global Commercial Display Market was valued at USD 26.06 billion in 2024 and is estimated to grow at a CAGR of 7% to reach USD 51.16 billion by 2034.
This growth trajectory is fueled by the expanding role of commercial displays in digital infrastructure, especially within sectors like education and healthcare, where interactive and intelligent display solutions are transforming engagement and communication. As institutions modernize their operations and public service frameworks, the need for dynamic, real-time content delivery systems becomes essential. Smart displays are now seen as critical tools not just in retail and advertising, but increasingly in public-facing services. This is encouraging adoption across broader verticals. Moreover, the growing shift toward immersive and personalized experiences in customer-facing environments such as corporate lobbies, campuses, and transportation hubs is redefining the scope of display technologies and contributing to this sustained market momentum.
| Market Scope | |
|---|---|
| Start Year | 2024 |
| Forecast Year | 2025-2034 |
| Start Value | $26.06 billion |
| Forecast Value | $51.16 Billion |
| CAGR | 7% |
The digital signage displays segment generated USD 7.09 billion in 2024, making it the most prominent product category within the commercial display industry. This segment continues to thrive due to high demand for adaptable content delivery platforms across industries like transportation, retail, and enterprise communications. As urban infrastructure evolves to support more intelligent environments, investments in large-format signage and information systems have grown rapidly. These displays allow businesses and institutions to deliver location-based content, event notifications, and interactive messages with ease.
The LED displays segment generated USD 7.34 billion in 2024. Their widespread popularity stems from their high energy efficiency, durability, and performance versatility across indoor and outdoor environments. The LED segment continues to dominate because of its scalability for video walls, signage systems, and high-resolution advertising. From transportation terminals to city centers and retail storefronts, LED displays are becoming the preferred solution for businesses looking to capture attention in both high-traffic and ambient light environments. Their adaptability and long service life make them particularly appealing for continuous-use settings.
U.S. Commercial Display Market generated USD 5.57 billion in 2024, supported by a CAGR of 7.5% through 2034. The country continues to lead in adoption due to widespread integration in industries such as quick-service restaurants, retail chains, public transit, and entertainment venues. Increasing regulatory guidance around accessibility and public information standards further accelerates deployment in educational institutions, airports, and government buildings. These developments drive demand for advanced display systems that support real-time communication, safety updates, and interactive navigation, offering both functionality and compliance with modern digital infrastructure requirements.
Major companies shaping the Global Commercial Display Market include Panasonic Corporation, Sony Corporation, Hisense Visual Technology Co., Ltd., BenQ Corporation, Daktronics, Inc., Samsung Electronics Co., Ltd., Qisda Corporation, Sharp Corporation, NEC Corporation, E Ink Holdings Inc., Barco NV, Christie Digital Systems USA, Inc., LG Electronics Inc., Delta Electronics, Inc., ViewSonic Corporation, Leyard Optoelectronic Co., Ltd., AU Optronics Corp., Mitsubishi Electric Corporation, Planar Systems, Inc., BOE Technology Group Co., Ltd., Elo Touch Solutions, Inc., Shenzhen Absen Optoelectronic Co., Ltd., and Innolux Corporation.
Leading companies in the commercial display industry are investing heavily in next-generation technologies such as micro-LED, OLED, and interactive touchscreens to cater to evolving customer demands. Many focus on expanding their product portfolios to include energy-efficient, modular, and ultra-HD display systems tailored for smart retail, public infrastructure, and enterprise environments. Strategic collaborations with tech firms and government bodies are also common, enabling players to participate in national digital transformation programs.
Table of Contents
Chapter 1 Methodology and Scope
- 1.1 Market scope and definition
- 1.2 Research design
- 1.2.1 Research approach
- 1.2.2 Data collection methods
- 1.3 Data mining sources
- 1.3.1 Global
- 1.3.2 Regional/Country
- 1.4 Base estimates and calculations
- 1.4.1 Base year calculation
- 1.4.2 Key trends for market estimation
- 1.5 Primary research and validation
- 1.5.1 Primary sources
- 1.6 Forecast model
- 1.7 Research assumptions and limitations
Chapter 2 Executive Summary
- 2.1 Industry 360° synopsis
- 2.2 Key market trends
- 2.2.1 Business trends
- 2.2.2 Product type trends
- 2.2.3 Technology trends
- 2.2.4 Display Size trends
- 2.2.5 Panel Type trends
- 2.2.6 End Use trends
- 2.2.7 Regional trends
- 2.3 TAM Analysis, 2025-2034 (USD Billion)
- 2.4 CXO perspectives: Strategic imperatives
- 2.5 Executive decision points
- 2.6 Critical Success Factors
- 2.7 Future Outlook and Strategic Recommendations
Chapter 3 Industry Insights
- 3.1 Industry ecosystem analysis
- 3.1.1 Supplier Landscape
- 3.1.2 Profit Margin
- 3.1.3 Cost structure
- 3.1.4 Value addition at each stage
- 3.1.5 Factor affecting the value chain
- 3.1.6 Disruptions
- 3.2 Industry impact forces
- 3.2.1 Growth drivers
- 3.2.1.1 Escalating demand for digital signage across retail, hospitality, and transportation
- 3.2.1.2 Adoption of high-resolution displays (4K/8K) and advanced technologies (OLED, microLED)
- 3.2.1.3 Integration of AI and cloud-based content management
- 3.2.1.4 Growth in smart city infrastructure and public service automation
- 3.2.1.5 Rising use of interactive displays in education and healthcare
- 3.2.2 Industry pitfalls and challenges
- 3.2.2.1 Supply chain disruptions and high production costs
- 3.2.2.2 Shortage of skilled professionals for installation and maintenance
- 3.2.3 Market Opportunities
- 3.2.3.1 Expansion in smart cities and transportation hubs
- 3.2.3.2 Integration with building management and POS systems
- 3.2.3.3 Growth in SaaS-based content platforms
- 3.2.3.4 Adoption in healthcare and automotive sectors
- 3.2.1 Growth drivers
- 3.3 Growth potential analysis
- 3.4 Regulatory landscape
- 3.4.1 North America
- 3.4.2 Europe
- 3.4.3 Asia Pacific
- 3.4.4 Latin America
- 3.4.5 Middle East & Africa
- 3.5 Porter’s analysis
- 3.6 PESTEL analysis
- 3.7 Technological and Innovation landscape
- 3.7.1 Current technological trends
- 3.7.2 Emerging technologies
- 3.8 Price Trends
- 3.8.1 By region
- 3.8.2 By product
- 3.9 Pricing strategies
- 3.10 Emerging business models
- 3.11 Compliance requirements
- 3.12 Sustainability measures
- 3.13 Consumer sentiment analysis
- 3.14 Patent and IP analysis
- 3.15 Geopolitical and trade dynamics
Chapter 4 Competitive Landscape, 2024
- 4.1 Introduction Company market share analysis
- 4.2 Company market share analysis
- 4.2.1 By region
- 4.2.1. North America
- 4.2.2. Europe
- 4.2.3. Asia Pacific
- 4.2.2 Market concentration analysis
- 4.3 Competitive Benchmarking of key Players
- 4.3.1 Financial Performance Comparison
- 4.3.1.1. Revenue
- 4.3.1.2. Profit Margin
- 4.3.1.3. R&D
- 4.3.2 Product Portfolio Comparison
- 4.3.2.1. Product Range Breadth
- 4.3.2.2. Technology
- 4.3.2.3. Innovation
- 4.3.3 Geographic Presence Comparison
- 4.3.3.1. Global Footprint Analysis
- 4.3.3.2. Service Network Coverage
- 4.3.3.3. Market Penetration by Region
- 4.3.4 Competitive Positioning Matrix
- 4.3.4.1. Leaders
- 4.3.4.2. Challengers
- 4.3.4.3. Followers
- 4.3.4.4. Niche Players
- 4.3.5 Strategic outlook matrix
- 4.3.1 Financial Performance Comparison
- 4.4 Key developments, 2021-2024
- 4.4.1 Mergers and Acquisitions
- 4.4.2 Partnerships and Collaborations
- 4.4.3 Technological Advancements
- 4.4.4 Expansion and Investment Strategies
- 4.4.5 Sustainability Initiatives
- 4.4.6 Digital Transformation Initiatives
- 4.5 Emerging/ Startup Competitors Landscape
Chapter 5 Market Estimates & Forecast, By Product Type, 2021 - 2034 (USD Billion & Units)
- 5.1 Key trends
- 5.2 Digital signage displays
- 5.3 Interactive whiteboards
- 5.4 Video walls
- 5.5 Kiosks
- 5.6 Others
Chapter 6 Market estimates & forecast, By Technology, 2021 - 2034 (USD Billion & Units)
- 6.1 Key trends
- 6.2 LED
- 6.3 LCD
- 6.4 OLED
- 6.5 Others
Chapter 7 Market estimates & forecast, By Display Size, 2021 - 2034 (USD Billion & Units)
- 7.1 Key trends
- 7.2 Below 32 inches
- 7.3 32-52 inches
- 7.4 Above 52 inches
Chapter 8 Market Estimates and Forecast, By Panel Type, 2021-2034 ( USD Billion & Units)
- 8.1 Key trends
- 8.2 Flat panel displays (FPD)
- 8.3 Curved panel displays
- 8.4 Flexible/transparent displays
Chapter 9 Market Estimates and Forecast, By End Use, 2021-2034 ( USD Billion & Units)
- 9.1 Key trends
- 9.2 Hospitality
- 9.3 Retail
- 9.4 Transportation
- 9.5 Healthcare
- 9.6 Banking & financial services
- 9.7 Others
Chapter 10 Market Estimates and Forecast, By Region, 2021 - 2034 (USD Billion & Units)
- 10.1 Key trends
- 10.2 North America
- 10.2.1 U.S.
- 10.2.2 Canada
- 10.3 Europe
- 10.3.1 Germany
- 10.3.2 U.K.
- 10.3.3 France
- 10.3.4 Italy
- 10.3.5 Spain
- 10.3.6 Netherlands
- 10.4 Asia Pacific
- 10.4.1 China
- 10.4.2 India
- 10.4.3 Japan
- 10.4.4 South Korea
- 10.4.5 Australia
- 10.5 Latin America
- 10.5.1 Brazil
- 10.5.2 Mexico
- 10.5.3 Argentina
- 10.6 Middle East & Africa
- 10.6.1 UAE
- 10.6.2 Saudi Arabia
- 10.6.3 South Africa
Chapter 11 Company Profile
- 11.1 Global Players:
- 11.1.1 AU Optronics Corp.
- 11.1.2 BenQ Corporation
- 11.1.3 BOE Technology Group Co., Ltd.
- 11.1.4 Leyard Optoelectronic Co., Ltd.
- 11.1.5 LG Electronics Inc.
- 11.1.6 Mitsubishi Electric Corporation
- 11.1.7 NEC Corporation
- 11.1.8 Panasonic Corporation
- 11.1.9 Samsung Electronics Co., Ltd.
- 11.1.10 Sharp Corporation
- 11.1.11 Sony Corporation
- 11.2 Regional Players:
- 11.2.1 Barco NV
- 11.2.2 Christie Digital Systems USA, Inc.
- 11.2.3 Daktronics, Inc.
- 11.2.4 Delta Electronics, Inc.
- 11.2.5 Innolux Corporation
- 11.2.6 Planar Systems, Inc.
- 11.2.7 ViewSonic Corporation
- 11.3 Emerging Players:
- 11.3.1 E Ink Holdings Inc.
- 11.3.2 Elo Touch Solutions, Inc.
- 11.3.3 Hisense Visual Technology Co., Ltd.
- 11.3.4 Qisda Corporation
- 11.3.5 Shenzhen Absen Optoelectronic Co., Ltd.
 工业IoT显示器市场规模、份额和成长分析:按应用、连接方式、显示器类型、面板尺寸和地区划分-2026-2033年产业预测
 工业IoT显示器市场分析及预测(至2035年):依类型、产品类型、服务、技术、组件、应用、形状、材质、设备及部署方式划分
 2026年全球加固型工业显示器市场报告2026年全球商用显示器市场报告2026年全球工业显示器市场报告
 商业显示器市场-全球产业规模、份额、趋势、机会及预测(依产品、技术、组件、地区及竞争格局划分),2021-2031年工业显示器市场 - 全球产业规模、份额、趋势、机会及预测(按类型、应用、技术、面板尺寸、最终用途、地区和竞争格局划分),2021-2031年
 商业显示器市场依产品类型、技术类型、显示器尺寸、应用、国家及地区划分-全球产业分析、市场规模、市场占有率及2025-2032年预测
 日本商用显示器市场规模、份额、趋势及预测(按产品类型、技术、组件、面板类型、尺寸、应用和地区划分),2026-2034年
 工业显示器市场规模、份额及成长分析(按类型、应用、产业及地区划分)-2026年至2033年产业预测