


 |
市场调查报告书
商品编码
1833400
工业显示器市场机会、成长动力、产业趋势分析及2025-2034年预测Industrial Display Market Opportunity, Growth Drivers, Industry Trend Analysis, and Forecast 2025 - 2034 |
||||||
2024 年全球工业显示器市场价值为 59.5 亿美元,预计将以 6% 的复合年增长率成长,到 2034 年达到 104.1 亿美元。
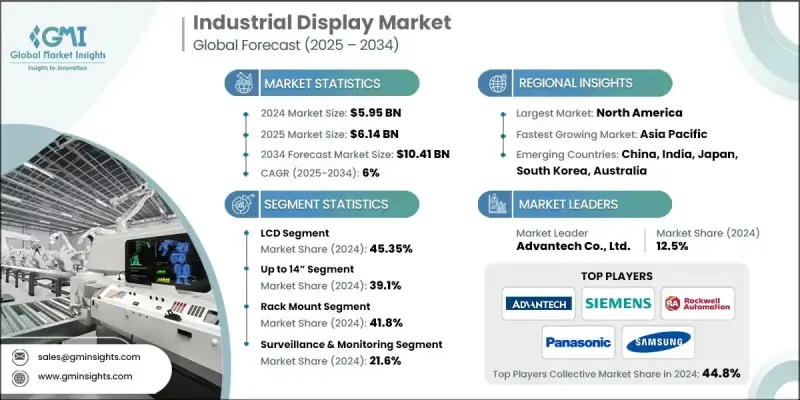
製造业、石油天然气、汽车和能源产业对自动化和数位控制的依赖日益增长,这推动了对工业显示器作为HMI系统重要组件的需求。这些介面可协助操作员即时监控、控制和排除设备故障,进而提高效率和安全性。
| 市场范围 | |
|---|---|
| 起始年份 | 2024 |
| 预测年份 | 2025-2034 |
| 起始值 | 59.5亿美元 |
| 预测值 | 104.1亿美元 |
| 复合年增长率 | 6% |
LCD需求不断成长
2024年,LCD市场占据了相当大的份额,这得益于其成本效益、视觉清晰度以及在各种工业环境中的适应性。 LCD技术因其尺寸多样、节能高效以及与传统和现代系统的兼容性,仍然是一个受欢迎的选择。製造商正在增强其LCD产品,增加触控功能、阳光下可读性和坚固外壳等特性,以支援在恶劣工作条件下的关键任务应用。
向 14 吋显示器转变
14英寸及以下的显示器市场在2024年保持了可持续的份额,这得益于其紧凑的外形和适合空间受限的安装。这些较小的萤幕越来越多地应用于嵌入式系统,而清晰度、可靠性和低功耗对于嵌入式系统至关重要。该领域的公司专注于高解析度面板、无边框玻璃设计和无风扇集成,以吸引那些寻求时尚耐用显示解决方案的原始设备製造商 (OEM)。
机架安装获得青睐
2024年,机架式显示器市场实现了可观的成长,主要得益于伺服器机房、自动化控制中心和军事应用。这一增长主要源于对能够安全安装在标准化机柜内的高效显示器的需求。这些显示器因其坚固的设计、简单的维护以及易于与机架式系统整合而备受青睐。
北美将成为推动力地区
2024年,北美工业显示器市场占据了相当大的份额。该地区在工业自动化、航太、能源和製造业领域拥有雄厚的基础,推动了对可靠高效能显示器解决方案的持续需求。工业4.0技术的普及和智慧基础设施投资的增加进一步推动了市场的成长。除美国外,加拿大在扩大交通运输和采矿业应用方面也发挥关键作用。
工业显示器市场的主要参与者有施耐德电气、Winmate Inc.、京东方科技集团股份有限公司、控创股份公司、罗克韦尔自动化公司、LG Display 有限公司、Pepperl+Fuchs SE、艺卓公司、松下控股公司、北尔电子集团、西门子股份公司、Sparton Corporation、三星电机公司、三菱株式会社、华华有限公司。
为了巩固在工业显示器市场的立足点,各公司正优先考虑产品客製化、模组化设计和软体整合。其中,重点是开发能够承受振动、极端温度和污染的坚固耐用的显示器,使其成为恶劣工业环境的理想选择。各公司也正在触控萤幕创新、多语言介面和远端显示监控方面进行投资,以提升用户体验并减少维护需求。
目录
第一章:方法论与范围
第二章:执行摘要
第三章:行业洞察
- 产业生态系统分析
- 供应商概况
- 利润率
- 成本结构
- 每个阶段的增值
- 影响价值链的因素
- 中断
- 产业衝击力
- 成长动力
- 製造业和工业流程自动化程度不断提高
- 工业运作中的成本效益和耐用性
- 快速城市化和基础设施发展
- 智慧工厂和IIOT部署的扩展
- 产业陷阱与挑战
- 先进显示技术的初始成本高
- 与遗留系统的兼容性和整合问题
- 成长动力
- 成长潜力分析
- 监管格局
- 北美洲
- 欧洲
- 亚太地区
- 拉丁美洲
- 中东和非洲
- 波特的分析
- PESTEL分析
- 技术和创新格局
- 当前的技术趋势
- 新兴技术
- 价格趋势
- 历史价格分析(2021-2024)
- 价格趋势驱动因素
- 区域价格差异
- 价格预测(2025-2034)
- 定价策略
- 新兴商业模式
- 合规性要求
- 永续性措施
- 永续材料评估
- 碳足迹分析
- 循环经济实施
- 永续性认证和标准
- 永续性投资报酬率分析
- 全球消费者情绪分析
- 专利分析
第四章:竞争格局
- 介绍
- 公司市占率分析
- 按地区
- 北美洲
- 欧洲
- 亚太地区
- 拉丁美洲
- 中东和非洲
- 市场集中度分析
- 按地区
- 关键参与者的竞争基准
- 财务绩效比较
- 收入
- 利润率
- 研发
- 产品组合比较
- 产品范围广度
- 科技
- 创新
- 地理位置比较
- 全球足迹分析
- 服务网路覆盖
- 各地区市场渗透率
- 竞争定位矩阵
- 领导者
- 挑战者
- 追踪者
- 利基市场参与者
- 战略展望矩阵
- 财务绩效比较
- 2021-2024 年关键发展
- 併购
- 伙伴关係与合作
- 技术进步
- 扩张和投资策略
- 永续发展倡议
- 数位转型倡议
- 新兴/新创企业竞争对手格局
第五章:市场估计与预测:按显示类型,2021 - 2034
- 主要趋势
- LCD(液晶显示器)
- LED(发光二极体)
- OLED(有机LED)
- 电子纸显示器
- CRT(阴极射线管)
第六章:市场估计与预测:按面板尺寸,2021 - 2034
- 主要趋势
- 最大 14 英寸
- 14英寸 - 21英寸
- 21英寸 - 40英寸
- 40吋以上
第七章:市场估计与预测:按安装类型 2021 - 2034
- 主要趋势
- 机架安装
- 面板安装
- 开放式框架
- 壁挂式
- VESA 支架
第 8 章:市场估计与预测:按应用,2021 - 2034 年
- 主要趋势
- 人机介面(HMI)
- 数位看板
- 监视和监控
- 互动式资讯亭
- 控制室
- 工业自动化
- 医疗设备展示
- 其他的
第九章:市场估计与预测:按垂直产业,2021 - 2034 年
- 主要趋势
- 製造业
- 汽车
- 电子和半导体
- 机械设备
- 纺织品
- 其他的
- 石油和天然气
- 能源与电力
- 采矿和金属
- 运输与物流(工业运作)
- 食品和饮料加工
- 其他的
第 10 章:市场估计与预测:按地区,2021 年至 2034 年
- 主要趋势
- 北美洲
- 我们
- 加拿大
- 欧洲
- 德国
- 英国
- 法国
- 西班牙
- 义大利
- 荷兰
- 亚太地区
- 中国
- 印度
- 日本
- 澳洲
- 韩国
- 拉丁美洲
- 巴西
- 墨西哥
- 阿根廷
- 中东和非洲
- 沙乌地阿拉伯
- 南非
- 阿联酋
第 11 章:公司简介
- 全球参与者
- Advantech Co., Ltd.
- AU Optronics Corporation
- BOE Technology Group Co., Ltd.
- Dell Technologies Inc.
- EIZO Corporation
- Hewlett-Packard Enterprise (HPE)
- Kontron AG
- Kyocera Corporation
- LG Display Co., Ltd.
- Mitsubishi Electric Corporation
- Panasonic Holdings Corporation
- Pepperl+Fuchs SE
- Rockwell Automation, Inc.
- Samsung Electronics Co., Ltd.
- Schneider Electric SE
- Siemens AG
- 区域参与者
- Axiomtek Co., Ltd.
- Beijer Electronics Group AB
- Crystal Group, Inc.
- Hope Industrial Systems, Inc.
- IBASE Technology Inc.
- Sparton Corporation
- Winmate Inc.
- 新兴玩家
- Litemax Electronics Inc.
- Touch International, Inc.
The Global Industrial Display Market was valued at USD 5.95 billion in 2024 and is estimated to grow at a CAGR of 6% to reach USD 10.41 billion by 2034.
The growing reliance on automation and digital control across manufacturing, oil & gas, automotive, and energy industries is boosting demand for industrial displays as essential components of HMI systems. These interfaces help operators monitor, control, and troubleshoot equipment in real time, improving efficiency and safety.
| Market Scope | |
|---|---|
| Start Year | 2024 |
| Forecast Year | 2025-2034 |
| Start Value | $5.95 billion |
| Forecast Value | $10.41 billion |
| CAGR | 6% |
Rising Demand for LCD
The LCD segment held a significant share in 2024, owing to its cost-efficiency, visual clarity, and adaptability across a wide range of industrial environments. LCD technology remains a popular choice due to its availability in various sizes, energy efficiency, and compatibility with both legacy and modern systems. Manufacturers are enhancing their LCD offerings with features such as touch capability, sunlight readability, and rugged enclosures to support mission-critical applications across harsh operating conditions.
Increasing Shift towards 14" inches Display
The displays up to 14 inches segment held a sustainable share in 2024, fueled by their compact form factor and suitability for space-constrained installations. These smaller screens are increasingly used in embedded systems, where clarity, reliability, and low power consumption are essential. Companies in this segment are focusing on high-resolution panels, edge-to-edge glass designs, and fanless integration to appeal to OEMs looking for sleek and durable display solutions.
Rack Mount to Gain Traction
The rack mount segment generated sizeable growth in 2024, backed by server rooms, automation control centers, and military applications. The growth is fueled by the need for space-efficient displays that can be securely mounted within standardized enclosures. These displays are favored for their robust design, simplified maintenance, and ease of integration with rack-based systems.
North America to Emerge as a Propelling Region
North America industrial display market held a substantial share in 2024. The region's strong base of industrial automation, aerospace, energy, and manufacturing sectors drives consistent demand for reliable and high-performance display solutions. Growth is further supported by increased adoption of Industry 4.0 technologies and rising investments in smart infrastructure. In addition to the U.S., Canada also plays a key role in expanding applications in transportation and mining.
Major players in the industrial display market are Schneider Electric SE, Winmate Inc., BOE Technology Group Co., Ltd., Kontron AG, Rockwell Automation, Inc., LG Display Co., Ltd., Pepperl+Fuchs SE, EIZO Corporation, Panasonic Holdings Corporation, Beijer Electronics Group AB, Siemens AG, Sparton Corporation, Samsung Electronics Co., Ltd., Mitsubishi Electric Corporation, Advantech Co., Ltd., AU Optronics Corporation.
To solidify their foothold in the industrial display market, companies are prioritizing product customization, modular design, and software integration. A major focus is on developing ruggedized displays that can withstand vibration, temperature extremes, and contamination, making them ideal for harsh industrial settings. Firms are also investing in touchscreen innovations, multi-language interfaces, and remote display monitoring to enhance user experience and reduce maintenance needs.
Table of Contents
Chapter 1 Methodology and Scope
- 1.1 Market scope and definition
- 1.2 Research design
- 1.2.1 Research approach
- 1.2.2 Data collection methods
- 1.3 Data mining sources
- 1.3.1 Global
- 1.3.2 Regional/Country
- 1.4 Base estimates and calculations
- 1.4.1 Base year calculation
- 1.4.2 Key trends for market estimation
- 1.5 Primary research and validation
- 1.5.1 Primary sources
- 1.6 Forecast model
- 1.7 Research assumptions and limitations
Chapter 2 Executive Summary
- 2.1 Industry snapshot
- 2.2 Key market trends
- 2.2.1 Business trends
- 2.2.2 Display type trends
- 2.2.3 Panel size trends
- 2.2.4 Mounting type trends
- 2.2.5 Application trends
- 2.2.6 Verticals trends
- 2.2.7 Regional trends
- 2.3 TAM Analysis, 2025-2034 (USD Billion)
- 2.4 CXO perspective: Strategic imperatives
- 2.4.1 Executive decision points
- 2.4.2 critical success factors
- 2.5 Future outlook and strategic recommendations
Chapter 3 Industry Insights
- 3.1 Industry ecosystem analysis
- 3.1.1 Supplier Landscape
- 3.1.2 Profit Margin
- 3.1.3 Cost structure
- 3.1.4 Value addition at each stage
- 3.1.5 Factor affecting the value chain
- 3.1.6 Disruptions
- 3.2 Industry impact forces
- 3.2.1 Growth drivers
- 3.2.1.1 Rising automation in manufacturing and industrial processes
- 3.2.1.2 Cost-effectiveness and durability in industrial operations
- 3.2.1.3 Rapid urbanization and infrastructure development
- 3.2.1.4 Expansion of smart factories and IIOT deployments
- 3.2.2 Industry pitfalls and challenges
- 3.2.2.1 High initial cost of advanced display technologies
- 3.2.2.2 Compatibility and integration issues with legacy systems
- 3.2.1 Growth drivers
- 3.3 Growth potential analysis
- 3.4 Regulatory landscape
- 3.4.1 North America
- 3.4.2 Europe
- 3.4.3 Asia Pacific
- 3.4.4 Latin America
- 3.4.5 Middle East & Africa
- 3.5 Porter’s analysis
- 3.6 PESTEL analysis
- 3.7 Technology and innovation landscape
- 3.7.1 Current technological trends
- 3.7.2 Emerging technologies
- 3.8 Price trends
- 3.8.1 Historical price analysis (2021-2024)
- 3.8.2 Price trend drivers
- 3.8.3 Regional price variations
- 3.8.4 Price forecast (2025-2034)
- 3.9 Pricing strategies
- 3.10 Emerging business models
- 3.11 Compliance requirements
- 3.12 Sustainability measures
- 3.12.1 Sustainable materials assessment
- 3.12.2 Carbon footprint analysis
- 3.12.3 Circular economy implementation
- 3.12.4 Sustainability certifications and standards
- 3.12.5 Sustainability ROI analysis
- 3.13 Global consumer sentiment analysis
- 3.14 Patent analysis
Chapter 4 Competitive Landscape, 2024
- 4.1 Introduction
- 4.2 Company market share analysis
- 4.2.1 By region
- 4.2.1.1 North America
- 4.2.1.2 Europe
- 4.2.1.3 Asia Pacific
- 4.2.1.4 Latin America
- 4.2.1.5 Middle East & Africa
- 4.2.2 Market Concentration Analysis
- 4.2.1 By region
- 4.3 Competitive benchmarking of key players
- 4.3.1 Financial performance comparison
- 4.3.1.1 Revenue
- 4.3.1.2 Profit margin
- 4.3.1.3 R&D
- 4.3.2 Product portfolio comparison
- 4.3.2.1 Product range breadth
- 4.3.2.2 Technology
- 4.3.2.3 Innovation
- 4.3.3 Geographic presence comparison
- 4.3.3.1 Global footprint analysis
- 4.3.3.2 Service network coverage
- 4.3.3.3 Market penetration by region
- 4.3.4 Competitive positioning matrix
- 4.3.4.1 Leaders
- 4.3.4.2 Challengers
- 4.3.4.3 Followers
- 4.3.4.4 Niche players
- 4.3.5 Strategic outlook matrix
- 4.3.1 Financial performance comparison
- 4.4 Key developments, 2021-2024
- 4.4.1 Mergers and acquisitions
- 4.4.2 Partnerships and collaborations
- 4.4.3 Technological advancements
- 4.4.4 Expansion and investment strategies
- 4.4.5 Sustainability initiatives
- 4.4.6 Digital transformation initiatives
- 4.5 Emerging/ startup competitors landscape
Chapter 5 Market Estimates and Forecast, By Display Type, 2021 - 2034 (USD Million & Units)
- 5.1 Key trends
- 5.2 LCD (Liquid Crystal Display)
- 5.3 LED (Light Emitting Diode)
- 5.4 OLED (Organic LED)
- 5.5 E-paper displays
- 5.6 CRT (Cathode Ray Tube)
Chapter 6 Market Estimates and Forecast, By Panel Size, 2021 - 2034 (USD Million & Units)
- 6.1 Key trends
- 6.2 Up to 14”
- 6.3 14” - 21”
- 6.4 21” - 40”
- 6.5 Above 40”
Chapter 7 Market Estimates and Forecast, By Mounting Type 2021 - 2034 (USD Million & Units)
- 7.1 Key trends
- 7.2 Rack mount
- 7.3 Panel mount
- 7.4 Open frame
- 7.5 Wall mount
- 7.6 VESA mount
Chapter 8 Market Estimates and Forecast, By Application, 2021 - 2034 (USD Million & Units)
- 8.1 Key trends
- 8.2 HMI (Human-Machine Interface)
- 8.3 Digital signage
- 8.4 Surveillance & monitoring
- 8.5 Interactive kiosks
- 8.6 Control rooms
- 8.7 Industrial automation
- 8.8 Medical equipment displays
- 8.9 Others
Chapter 9 Market Estimates and Forecast, By Verticals, 2021 - 2034 (USD Million & Units)
- 9.1 Key trends
- 9.2 Manufacturing
- 9.2.1 Automotive
- 9.2.2 Electronics & semiconductors
- 9.2.3 Machinery & equipment
- 9.2.4 Textiles
- 9.2.5 Others
- 9.3 Oil & gas
- 9.4 Energy & power
- 9.5 Mining & metals
- 9.6 Transportation & logistics (industrial operations)
- 9.7 Food & beverage processing
- 9.8 Others
Chapter 10 Market Estimates and Forecast, By Region, 2021 - 2034 (USD Million)
- 10.1 Key trends
- 10.2 North America
- 10.2.1 U.S.
- 10.2.2 Canada
- 10.3 Europe
- 10.3.1 Germany
- 10.3.2 UK
- 10.3.3 France
- 10.3.4 Spain
- 10.3.5 Italy
- 10.3.6 Netherlands
- 10.4 Asia Pacific
- 10.4.1 China
- 10.4.2 India
- 10.4.3 Japan
- 10.4.4 Australia
- 10.4.5 South Korea
- 10.5 Latin America
- 10.5.1 Brazil
- 10.5.2 Mexico
- 10.5.3 Argentina
- 10.6 Middle East and Africa
- 10.6.1 Saudi Arabia
- 10.6.2 South Africa
- 10.6.3 UAE
Chapter 11 Company Profiles
- 11.1 Global Players
- 11.1.1 Advantech Co., Ltd.
- 11.1.2 AU Optronics Corporation
- 11.1.3 BOE Technology Group Co., Ltd.
- 11.1.4 Dell Technologies Inc.
- 11.1.5 EIZO Corporation
- 11.1.6 Hewlett-Packard Enterprise (HPE)
- 11.1.7 Kontron AG
- 11.1.8 Kyocera Corporation
- 11.1.9 LG Display Co., Ltd.
- 11.1.10 Mitsubishi Electric Corporation
- 11.1.11 Panasonic Holdings Corporation
- 11.1.12 Pepperl+Fuchs SE
- 11.1.13 Rockwell Automation, Inc.
- 11.1.14 Samsung Electronics Co., Ltd.
- 11.1.15 Schneider Electric SE
- 11.1.16 Siemens AG
- 11.2 Regional Players
- 11.2.1 Axiomtek Co., Ltd.
- 11.2.2 Beijer Electronics Group AB
- 11.2.3 Crystal Group, Inc.
- 11.2.4 Hope Industrial Systems, Inc.
- 11.2.5 IBASE Technology Inc.
- 11.2.6 Sparton Corporation
- 11.2.7 Winmate Inc.
- 11.3 Emerging Players
- 11.3.1 Litemax Electronics Inc.
- 11.3.2 Touch International, Inc.
 工业IoT显示器市场规模、份额和成长分析:按应用、连接方式、显示器类型、面板尺寸和地区划分-2026-2033年产业预测
 工业IoT显示器市场分析及预测(至2035年):依类型、产品类型、服务、技术、组件、应用、形状、材质、设备及部署方式划分
 2026年全球加固型工业显示器市场报告2026年全球商用显示器市场报告2026年全球工业显示器市场报告
 商业显示器市场-全球产业规模、份额、趋势、机会及预测(依产品、技术、组件、地区及竞争格局划分),2021-2031年工业显示器市场 - 全球产业规模、份额、趋势、机会及预测(按类型、应用、技术、面板尺寸、最终用途、地区和竞争格局划分),2021-2031年
 商业显示器市场依产品类型、技术类型、显示器尺寸、应用、国家及地区划分-全球产业分析、市场规模、市场占有率及2025-2032年预测
 日本商用显示器市场规模、份额、趋势及预测(按产品类型、技术、组件、面板类型、尺寸、应用和地区划分),2026-2034年
 工业显示器市场规模、份额及成长分析(按类型、应用、产业及地区划分)-2026年至2033年产业预测