


 |
市场调查报告书
商品编码
1846265
工业显示器:市场份额分析、行业趋势、统计数据和成长预测(2025-2030 年)Industrial Display - Market Share Analysis, Industry Trends & Statistics, Growth Forecasts (2025 - 2030) |
||||||
※ 本网页内容可能与最新版本有所差异。详细情况请与我们联繫。
预计到 2025 年,工业显示器市场规模将达到 58.9 亿美元,到 2030 年将达到 76.7 亿美元,预测期内复合年增长率为 5.42%。
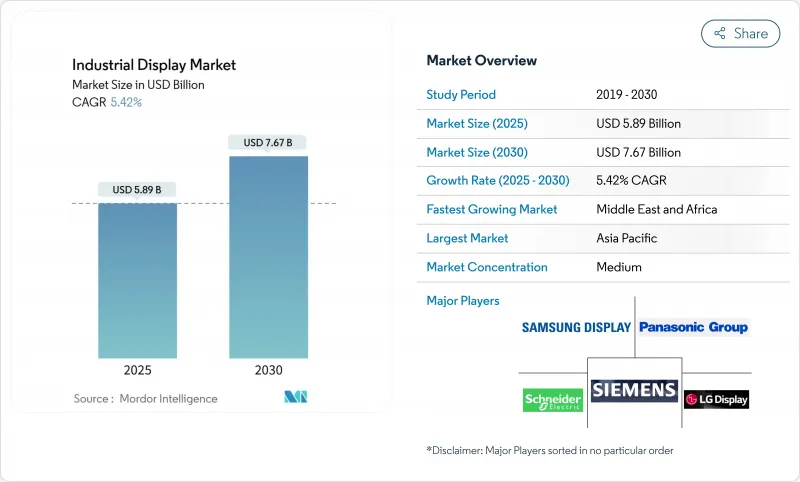
营运商正从基础读数转向连接工厂车间资产、边缘网关和云端分析平台的多层视觉化中心。虽然人机介面 (HMI)主机仍占据采购主导地位,但随着能源公司集中监控分散式基础设施,远端资产和管道视觉化正经历最快的成长。儘管 LCD 面板保持着成本领先优势,但 OLED 和 AMOLED 模组正经历着快速成长,因为控制室需要低功耗和高对比度以实现 24 小时运作。半导体短缺导致 LCD 控制器前置作业时间延长,促使整合商拓展其技术蓝图并进行策略性组件储备。从区域来看,亚太地区正在利用组件製造的规模经济,而中东和非洲则正在加速对大型油气计划防爆视觉化技术的资本投资。
全球工业显示器市场趋势与洞察
工业IoT在离散型和流程型工厂的应用日益广泛
边缘运算人机介面 (HMI) 现在可以处理来自以乙太网路为基础的毫秒延迟数据,从而实现预测性维护仪表板,最大限度地减少计划外停机。罗克韦尔自动化公司将工业物联网 (IIoT) 架构视为 2025 年的主要数位化路径,并指出控制器和视觉化终端之间的紧密耦合至关重要。 HMS Networks 指出,到 2024 年,工业乙太网将占新节点安装量的 71%,这将推动对支援 PROFINET、EtherNet/IP 和 EtherCAT 协定堆迭的显示器的需求。
危险化学品设施对多功能人机介面的需求激增
ISA-TR101.02-2019 技术报告现已将影响所有采购简报的可用性和效能基准正式纳入规范。 VarTech Systems 等供应商提供通过 C1D1 和 C1D2 认证的面板,这些面板支援多点触控、语音控制,亮度超过 1000 尼特,兼顾安全性和功能性。这些规范有助于确保化学和製药应用中批次间的一致性,因为在这些应用中,操作员的介入必须在微秒级以内。
安装和维护成本高昂
防爆外壳、三防胶和专用安装套件都会增加系统的初始成本。 Comark 公司估计,符合 IECEx 标准可能会使海上平台的资本预算翻倍,同时使工程进度延长数季。
细分市场分析
2024年,防护等级为IP65-67的坚固型外壳将占据工业显示器市场31.5%的份额,这反映了其在钻井、采矿和军事平台等关键应用领域的广泛应用。受石化联合企业集中控制室投资的推动,电视墙预计将以5.9%的年增长率成长。高亮度开放式框架模组正被整合到自助服务终端机壳中,而面板安装单元仍然是机器级人机介面(HMI)的首选产品。工业显示器市场持续涌现兼具防破坏结构和模组化I/O的产品,以实现快速更换和最大限度减少停机时间。船用级产品符合MIL-STD-167振动阈值和盐雾通讯协定,将工业显示器市场拓展至海军船舰和海上钻机。用于电厂多参数仪錶板的条状和拉伸萤幕属于小众产品,因此销量较低但平均售价较高。
二级供应商正将坚固耐用性与窄边框设计结合,打造适用于现场控制面板和指挥中心的跨界产品。巴可公司为企业影院提供的4000块雷射萤幕合约凸显了其製造规模化能力,最终将推动工业电视墙的发展。混合型外壳整合了冗余电源和边缘网关,符合IEC 60079-2025安全标准,同时拓展了可维护工业显示器的市场。
2024年,人机介面(HMI)工作站将占总收入的46.8%,但随着管道和垫片遥测资料迁移到集中式网路营运中心(NOC),远端资产视觉化(复合年增长率6.4%)将超越HMI。随着卫星和低功耗广域网路(LPWAN)连接在沙漠和海上地区的普及,用于远端监控的工业显示器市场规模预计将稳定成长。精实工厂中的安灯板和维护人员使用的互动式服务站增强了以人性化的可视化工作流程,缩短了故障维修週期。控制室电视墙代表了高阶产品,采用无边框液晶显示器和新兴的微型LED阵列,营造出身临其境型的情境察觉环境。与人工智慧主导的分析平台集成,鼓励操作员根据萤幕上直接显示的指导性提示采取行动,从而减少操作员疲劳和出错的可能性。
OnePetro公司在现场试验中展示的分散式太阳能显示器证明了其在无电网覆盖地区的可行性,从而扩大了偏远矿区工业显示器市场的安装基础。随着网路安全日益受到重视,显示器越来越多地与硬体信任根模组配合使用,以保护萤幕上的资料流。
区域分析
亚太地区预计到2024年将占全球销售额的37%,主要得益于中国大力推动工厂自动化以及日本在精密零件领域的领先地位。三星显示器和LG显示器均拥有世界一流的OLED工厂,巩固了其在亚太地区工业显示器市场的供应优势。零件方面:各国政府正透过提供资本投资税额扣抵抵免来支持面板工厂的扩张,从而确保即使在半导体短缺时期也能保证面板供应稳定。
到2030年,中东和非洲将以6.3%的复合年增长率成为成长最快的地区。沿岸地区数十亿美元的油气计划依赖于符合IEC 60079-2025认证的本质安全型显示屏,这扩大了防爆硬体的工业显示器市场规模。各国国家石油公司将中央国家石油公司(NOC)与区域微控制室结合,需要能够在沙漠高温下保持高亮度的同步电视墙。
在北美,一股维修正席捲着那些寻求提升能源效率和网路安全的古老工厂。工厂纷纷采用基于IP技术的玻璃面板,取代传统的CRT和电阻式触控面板,这推动了工业显示器市场的发展。在欧洲,以符合EN ISO 9241-210可用性指南的人体工学人机介面(HMI)布局为重点的工业4.0蓝图正在推进,旨在提升操作人员的社会福利。南美洲的采矿和水力发电产业正在进口能够承受高海拔和高湿度环境的坚固耐用面板,进一步拓展了其收益的地理范围。
其他福利:
- Excel格式的市场预测(ME)表
- 3个月的分析师支持
目录
第一章 引言
- 研究假设和市场定义
- 调查范围
第二章调查方法
第三章执行摘要
第四章 市场情势
- 市场概览
- 市场驱动因素
- 工业IoT在离散型和流程型工厂的应用日益广泛
- 危险化学品设施对多功能人机介面的需求激增
- 在整个汽车生产线部署精益生产数位电子看板(安灯)
- 北美老旧工厂迎来电气化和自动化改装浪潮
- 适用于油田作业的户外等级阳光下可视微型OLED/微型LED面板
- IECEx-2022 强制要求海上显示硬体本质安全
- 市场限制
- 高成本
- 预计2023-2024年由于晶片短缺,LCD控制器前置作业时间将延长。
- 传统PLC介面的碎片化限制了显示器的互通性。
- 全天候控制室运作会加速控制面板老化,进而增加整体拥有成本。
- 生态系分析
- 监理与技术展望
- 波特五力分析
- 新进入者的威胁
- 买方的议价能力
- 供应商的议价能力
- 替代品的威胁
- 竞争对手之间的竞争强度
第五章 市场规模与成长预测(金额)
- 按类型
- 加固型显示器
- 开放式框架显示器
- 面板安装显示器
- 船舰和海军展览
- 工业电视墙
- 条形/拉伸显示器
- 透过使用
- 人机介面(HMI)
- 远端资产和管道监测
- 互动式服务站和操作员终端
- 工厂数位电子看板和内部电路板
- 控制室电视墙
- 依技术
- LCD
- LED背光液晶显示器
- OLED/AMOLED
- 电子纸和反射式显示器
- 微型LED
- 按面板尺寸
- 小于14英寸
- 14英寸至21英寸
- 21英寸至40英寸
- 40吋或以上
- 按行业
- 製造业
- 能源和电力
- 石油和天然气
- 采矿和金属
- 化学和製药
- 运输/物流
- 其他(用水和污水、国防)
- 按地区
- 北美洲
- 美国
- 加拿大
- 墨西哥
- 欧洲
- 德国
- 英国
- 法国
- 北欧的
- 其他欧洲国家
- 南美洲
- 巴西
- 其他南美
- 亚太地区
- 中国
- 日本
- 印度
- 东南亚
- 其他亚太地区
- 中东和非洲
- 中东
- 波湾合作理事会成员国
- 土耳其
- 其他中东地区
- 非洲
- 南非
- 其他非洲国家
- 北美洲
第六章 竞争情势
- 市场集中度
- 策略性倡议(併购、合资、合约)
- 市占率分析
- 公司简介
- Samsung Display Co., Ltd.
- LG Display Co., Ltd.
- Panasonic Holdings Corp.
- Sharp Corp.
- Emerson Electric Co.
- Schneider Electric SE
- Siemens AG
- Rockwell Automation Inc.
- NEC Display Solutions, Ltd.
- Advantech Co., Ltd.
- Barco NV
- WinMate Inc.
- Planar Systems, Inc.
- AU Optronics Corp.
- Bosch Rexroth AG
- Mitsubishi Electric Corp.
- Honeywell International Inc.
- Kontron AG
- iBASE Technology Inc.
- Beijer Electronics Group AB
- Delta Electronics, Inc.
第七章 市场机会与未来展望
The industrial display market size stands at USD 5.89 billion in 2025 and is projected to reach USD 7.67 billion by 2030, reflecting a 5.42% CAGR over the forecast period.
Operators are moving from basic read-outs to multi-layered visualization hubs that connect plant-floor assets, edge gateways and cloud analytics platforms. Human-machine interface (HMI) consoles continue to dominate procurement, yet remote asset and pipeline visualization is scaling the fastest as energy firms centralize oversight of dispersed infrastructure. LCD panels preserve cost leadership, while OLED and AMOLED modules post the quickest growth as control rooms demand lower power draw and superior contrast for round-the-clock duty. Semiconductor shortages lengthen LCD controller lead times, pushing integrators to diversify technology roadmaps and pursue strategic component reserves. Regionally, Asia-Pacific leverages economies of scale in component fabrication, whereas the Middle East and Africa accelerates capital expenditure on explosion-proof visualization for oil and gas megaprojects.
Global Industrial Display Market Trends and Insights
Increasing Adoption of Industrial IoT in Discrete and Process Plants
Edge-ready HMIs now process millisecond latency data from Ethernet-based networks, enabling predictive maintenance dashboards that minimize unplanned shutdowns. Rockwell Automation identifies IIoT architecture as the principal digitization pathway for 2025, citing tighter coupling between controllers and visualization endpoints. HMS Networks confirms momentum, noting that Industrial Ethernet supplied 71% of new node installations in 2024, catalyzing demand for displays that support PROFINET, EtherNet/IP and EtherCAT stacks.
Demand Surge for Multi-featured HMI in Hazardous Chemical Facilities
The ISA-TR101.02-2019 technical report codifies usability and performance benchmarks that now influence every procurement brief. Suppliers such as VarTech Systems deliver C1D1 and C1D2 certified panels offering multi-touch, voice control and >1,000 nit brightness, aligning safety with functionality. These specifications support batch-to-batch integrity in chemicals and pharmaceuticals where micro-seconds matter for operator intervention.
High Cost of Implementation and Maintenance
Explosion-proof enclosures, conformal coatings, and specialized mounting kits elevate upfront system outlays. Comark Corporation projects that IECEx compliance can double equipment budgets for offshore platforms while extending engineering schedules by several quarters.
Other drivers and restraints analyzed in the detailed report include:
- Lean-Manufacturing Digital Signage (Andon) Roll-outs Across Automotive Lines
- Retrofit Wave of Aging North-American Factories for Electrification and Automation
- Prolonged LCD Controller Lead-Times Amid Chip Shortage
For complete list of drivers and restraints, kindly check the Table Of Contents.
Segment Analysis
Rugged housings rated to IP65-67 secured a 31.5% slice of the industrial display market in 2024, reflecting critical-duty requirements in drilling, mining and military platforms. Video walls are projected to compound at 5.9% annually, fueled by centralized control-room investment across petrochemical complexes. High-brightness open-frame modules integrate into kiosk enclosures, while panel-mount units remain the workhorse for machine-level HMIs. The industrial display market repeatedly favors vendors that combine shock resistance with modular I/O, ensuring rapid swap-out and minimal downtime. Marine-grade variants meet MIL-STD-167 vibration thresholds and salt-spray protocols, extending the industrial display market footprint to naval vessels and offshore rigs. Bar-type and stretch screens address multi-parameter dashboards in power plants, a niche translating to higher ASPs despite lower volumes.
Second-tier suppliers are blending ruggedization with narrow-bezel architectures, creating cross-over products that serve both field panels and command centers. Barco's enterprise cinema contract for 4,000 laser screens underscores manufacturing scalability that later translates into industrial video walls. Hybrid enclosures now embed redundant power supplies and edge gateways, aligning with IEC 60079-2025 safety clauses while enlarging the serviceable industrial display market.
HMI stations delivered 46.8% of 2024 revenue, but remote asset visualization will outpace at a 6.4% CAGR as pipeline and well-pad telemetry shifts to centralized NOCs. The industrial display market size for remote monitoring is forecast to expand steadily as satellite and LPWAN connectivity proliferate in deserts and offshore locations. Andon boards in lean plants and interactive kiosks for maintenance crews reinforce human-centric visual workflows that shorten fault-to-fix cycles. Control-room video walls constitute the premium class where bezel-less LCD or emerging Micro-LED arrays craft immersive situational awareness environments. Integration with AI-driven analytics platforms means operators now act on prescriptive prompts rendered directly on the screen, reducing operator fatigue and error incidence.
Distributed solar-powered screens demonstrated by OnePetro field trials prove viability in regions lacking grid access, widening the install base of the industrial display market in remote extraction zones. As cybersecurity rises in priority, displays are increasingly paired with hardware-root-of-trust modules to secure on-screen data flows, a requirement accentuated in cross-border pipeline operations.
The Industrial Display Market Report is Segmented by Type (Rugged Displays, Open Frame Monitors, and More), Application (Human-Machine Interface, Remote Asset and Pipeline Monitoring, and More), Technology (LCD, LED Backlit LCD, and More), Panel Size (Up To 14 Inch, 14 Inch - 21 Inch, and More), End-Use Industry (Manufacturing, Energy and Power, and More), and Geography. The Market Forecasts are Provided in Terms of Value (USD).
Geography Analysis
Asia-Pacific commanded 37% revenue in 2024, underpinned by China's factory automation drive and Japan's leadership in precision components. Samsung Display and LG Display operate global-scale OLED fabs, cementing the region's supply advantage across the industrial display market. Component governments back capex tax credits that accelerate panel plant expansions, ensuring steady panel availability even during semiconductor shortages.
The Middle East and Africa is poised for the fastest 6.3% CAGR to 2030. Multi-billion-dollar hydrocarbon projects across the Gulf rely on intrinsically safe screens certified under IEC 60079-2025, enlarging the industrial display market size for explosion-proof hardware. National oil companies pair centralized NOCs with regional micro-control rooms, demanding synchronized video walls that sustain high brightness amid desert temperatures.
North America witnesses a retrofit wave across mid-century factories seeking energy efficiencies and cybersecurity hardening. Proactive replacement of CRTs and resistive-touch panels with IP-based glass surfaces boosts the industrial display market as factories embrace digital performance boards. Europe advances Industry 4.0 blueprints with a focus on ergonomic HMI layouts compliant with EN ISO 9241-210 usability guidance, promoting operator well-being. South America's mining and hydroelectric sectors import hardy panels rated for high altitude and humidity, further diversifying geographic revenue.
- Samsung Display Co., Ltd.
- LG Display Co., Ltd.
- Panasonic Holdings Corp.
- Sharp Corp.
- Emerson Electric Co.
- Schneider Electric SE
- Siemens AG
- Rockwell Automation Inc.
- NEC Display Solutions, Ltd.
- Advantech Co., Ltd.
- Barco NV
- WinMate Inc.
- Planar Systems, Inc.
- AU Optronics Corp.
- Bosch Rexroth AG
- Mitsubishi Electric Corp.
- Honeywell International Inc.
- Kontron AG
- iBASE Technology Inc.
- Beijer Electronics Group AB
- Delta Electronics, Inc.
Additional Benefits:
- The market estimate (ME) sheet in Excel format
- 3 months of analyst support
TABLE OF CONTENTS
1 INTRODUCTION
- 1.1 Study Assumptions and Market Definition
- 1.2 Scope of the Study
2 RESEARCH METHODOLOGY
3 EXECUTIVE SUMMARY
4 MARKET LANDSCAPE
- 4.1 Market Overview
- 4.2 Market Drivers
- 4.2.1 Increasing Adoption of Industrial IoT in Discrete and Process Plants
- 4.2.2 Demand Surge for Multi-featured HMI in Hazardous Chemical Facilities
- 4.2.3 Lean-Manufacturing Digital Signage (Andon) Roll-outs Across Automotive Lines
- 4.2.4 Retrofit Wave of Aging North-American Factories for Electrification and Automation
- 4.2.5 Outdoor-Grade Sunlight-Readable Micro-OLED/Micro-LED Panels for Oilfield Operations
- 4.2.6 IECEx-2022 Mandate for Intrinsically Safe Offshore Display Hardware
- 4.3 Market Restraints
- 4.3.1 High Cost of Implementation and Maintenance
- 4.3.2 Prolonged LCD Controller Lead-Times Amid 2023-24 Chip Shortage
- 4.3.3 Legacy PLC Interface Fragmentation Limiting Display Interoperability
- 4.3.4 Accelerated Panel Burn-in in 24/7 Control-Room Duty Raising TCO
- 4.4 Indusrty Ecosystem Analysis
- 4.5 Regulatory and Technological Outlook
- 4.6 Porter's Five Forces Analysis
- 4.6.1 Threat of New Entrants
- 4.6.2 Bargaining Power of Buyers
- 4.6.3 Bargaining Power of Suppliers
- 4.6.4 Threat of Substitutes
- 4.6.5 Intensity of Competitive Rivalry
5 MARKET SIZE AND GROWTH FORECASTS (VALUES)
- 5.1 By Type
- 5.1.1 Rugged Displays
- 5.1.2 Open Frame Monitors
- 5.1.3 Panel-Mount Monitors
- 5.1.4 Marine and Naval-Grade Displays
- 5.1.5 Industrial Video Walls
- 5.1.6 Bar-Type/Stretch Displays
- 5.2 By Application
- 5.2.1 Human-Machine Interface (HMI)
- 5.2.2 Remote Asset and Pipeline Monitoring
- 5.2.3 Interactive Kiosks and Operator Terminals
- 5.2.4 In-plant Digital Signage and Andon Boards
- 5.2.5 Control-Room Video Walls
- 5.3 By Technology
- 5.3.1 LCD
- 5.3.2 LED Backlit LCD
- 5.3.3 OLED/AMOLED
- 5.3.4 E-Paper and Reflective Displays
- 5.3.5 Micro-LED
- 5.4 By Panel Size
- 5.4.1 Up to 14 inch
- 5.4.2 14 inch - 21 inch
- 5.4.3 21 inch - 40 inch
- 5.4.4 40 inch and Above
- 5.5 By End-Use Industry
- 5.5.1 Manufacturing
- 5.5.2 Energy and Power
- 5.5.3 Oil and Gas
- 5.5.4 Mining and Metals
- 5.5.5 Chemical and Pharmaceutical
- 5.5.6 Transportation and Logistics
- 5.5.7 Others (Water and Wastewater, Defense)
- 5.6 By Geography
- 5.6.1 North America
- 5.6.1.1 United States
- 5.6.1.2 Canada
- 5.6.1.3 Mexico
- 5.6.2 Europe
- 5.6.2.1 Germany
- 5.6.2.2 United Kingdom
- 5.6.2.3 France
- 5.6.2.4 Nordics
- 5.6.2.5 Rest of Europe
- 5.6.3 South America
- 5.6.3.1 Brazil
- 5.6.3.2 Rest of South America
- 5.6.4 Asia-Pacific
- 5.6.4.1 China
- 5.6.4.2 Japan
- 5.6.4.3 India
- 5.6.4.4 South-East Asia
- 5.6.4.5 Rest of Asia-Pacific
- 5.6.5 Middle East and Africa
- 5.6.5.1 Middle East
- 5.6.5.1.1 Gulf Cooperation Council Countries
- 5.6.5.1.2 Turkey
- 5.6.5.1.3 Rest of Middle East
- 5.6.5.2 Africa
- 5.6.5.2.1 South Africa
- 5.6.5.2.2 Rest of Africa
- 5.6.1 North America
6 COMPETITIVE LANDSCAPE
- 6.1 Market Concentration
- 6.2 Strategic Moves (M&A, JV, Agreements)
- 6.3 Market Share Analysis
- 6.4 Company Profiles (includes Global level Overview, Market level overview, Core Segments, Financials as available, Strategic Information, Market Rank/Share for key companies, Products and Services, and Recent Developments)
- 6.4.1 Samsung Display Co., Ltd.
- 6.4.2 LG Display Co., Ltd.
- 6.4.3 Panasonic Holdings Corp.
- 6.4.4 Sharp Corp.
- 6.4.5 Emerson Electric Co.
- 6.4.6 Schneider Electric SE
- 6.4.7 Siemens AG
- 6.4.8 Rockwell Automation Inc.
- 6.4.9 NEC Display Solutions, Ltd.
- 6.4.10 Advantech Co., Ltd.
- 6.4.11 Barco NV
- 6.4.12 WinMate Inc.
- 6.4.13 Planar Systems, Inc.
- 6.4.14 AU Optronics Corp.
- 6.4.15 Bosch Rexroth AG
- 6.4.16 Mitsubishi Electric Corp.
- 6.4.17 Honeywell International Inc.
- 6.4.18 Kontron AG
- 6.4.19 iBASE Technology Inc.
- 6.4.20 Beijer Electronics Group AB
- 6.4.21 Delta Electronics, Inc.
7 MARKET OPPORTUNITIES AND FUTURE OUTLOOK
- 7.1 White-space and Unmet-Need Assessment
 工业IoT显示器市场规模、份额和成长分析:按应用、连接方式、显示器类型、面板尺寸和地区划分-2026-2033年产业预测
 工业IoT显示器市场分析及预测(至2035年):依类型、产品类型、服务、技术、组件、应用、形状、材质、设备及部署方式划分
 2026年全球加固型工业显示器市场报告2026年全球商用显示器市场报告2026年全球工业显示器市场报告
 商业显示器市场-全球产业规模、份额、趋势、机会及预测(依产品、技术、组件、地区及竞争格局划分),2021-2031年工业显示器市场 - 全球产业规模、份额、趋势、机会及预测(按类型、应用、技术、面板尺寸、最终用途、地区和竞争格局划分),2021-2031年
 商业显示器市场依产品类型、技术类型、显示器尺寸、应用、国家及地区划分-全球产业分析、市场规模、市场占有率及2025-2032年预测
 日本商用显示器市场规模、份额、趋势及预测(按产品类型、技术、组件、面板类型、尺寸、应用和地区划分),2026-2034年
 工业显示器市场规模、份额及成长分析(按类型、应用、产业及地区划分)-2026年至2033年产业预测