


 |
市场调查报告书
商品编码
1844253
自助服务分析市场机会、成长动力、产业趋势分析及 2025 - 2034 年预测Self-Service Analytics Market Opportunity, Growth Drivers, Industry Trend Analysis, and Forecast 2025 - 2034 |
||||||
2024 年全球自助服务分析市场价值为 62 亿美元,预计到 2034 年将以 16.2% 的复合年增长率增长至 230 亿美元。
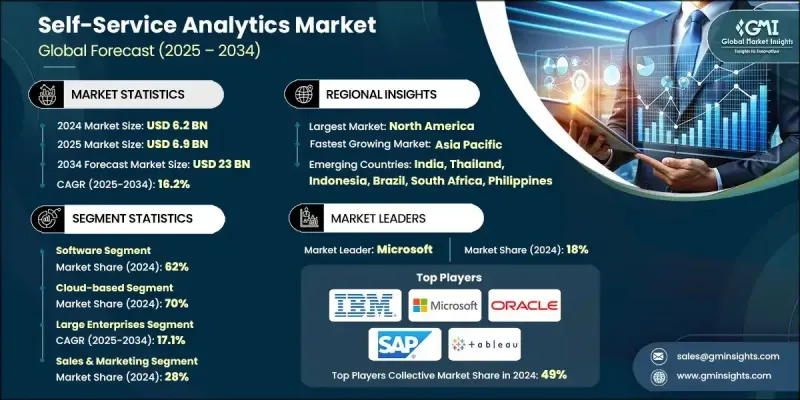
这一快速成长的动力源于企业对更快、更独立的资料存取和分析日益增长的需求。自助式分析使员工能够自主探索、视觉化和解读资料,从而消除对 IT 部门的传统依赖,并实现即时的数据驱动决策。随着企业转向敏捷运营,对支援快速洞察和竞争适应能力的工具的需求持续增长。资料民主化和跨职能资料存取的广泛推动,正在将分析转变为策略规划的核心组成部分。此外,企业也意识到自助式分析是扩展决策规模并提高营运效率的关键推动力。
| 市场范围 | |
|---|---|
| 起始年份 | 2024 |
| 预测年份 | 2025-2034 |
| 起始值 | 62亿美元 |
| 预测值 | 230亿美元 |
| 复合年增长率 | 16.2% |
随着自动化、物联网整合和永续云端技术的不断进步,越来越多的公司正在采用智慧自助式分析平台。这些系统可以减轻IT负担,降低营运成本,并支援跨部门的预测性和即时分析。随着节能云端运算的日益普及,各行各业都越来越多地采用这种技术,并优先考虑合规性、效能和长期数位转型。对永续性和治理改进的追求也使自助式分析成为企业资料策略中负责任创新的前沿。
2024年,软体领域占据62%的市场份额,预计到2034年将以16.7%的复合年增长率成长。软体的主导地位归功于人工智慧工具、高级视觉化和自然语言介面的日益普及,这些技术加速了业务决策和预测。这些平台在北美、亚太和欧洲等地区广泛应用,这些地区的法规、资料可存取性和可扩展架构要求日益提高。企业之所以青睐这些软体解决方案,是因为它们易于部署、相容云,并且能够整合到混合IT生态系统中。
2024年,基于云端的部署细分市场占据了70%的份额,预计在2025年至2034年期间将以17%的复合年增长率成长。基于云端的自助服务分析之所以受欢迎,源自于其可扩展性、经济实惠性和远端存取能力,使其成为动态工作环境和即时营运的理想选择。企业正在采用云端部署模式,以实现灵活性、降低硬体依赖性和成本管理。订阅模式的广泛采用,加上对多云营运的支持,对于希望保持敏捷性和竞争力的中小型企业尤其具有吸引力。
2024年,北美自助服务分析市场占据49%的市场份额,这得益于广泛的企业数位化、强大的云端基础设施以及透过资料自主赋能团队的高度重视。美国和加拿大的组织越来越多地转向去中心化分析方法,以简化决策并减少IT瓶颈。高级分析解决方案的广泛应用使北美成为自助服务分析领域创新和快速应用的中心。
自助服务分析市场的主要参与者包括亚马逊网路服务 (AWS)、Qlik Technologies、SAS、SAP、微软、IBM、Tableau Software (Salesforce)、TIBCO Software、甲骨文和 Sisense。为了提升影响力,自助服务分析领域的领先公司正在采取多项策略措施。许多公司专注于透过人工智慧功能、自动化资料准备和自然语言查询来扩展其产品功能,以简化使用者体验。与云端生态系统的整合以及对混合基础设施的支援使公司能够满足各种企业需求。与其他技术供应商和云端平台的合作有助于扩大覆盖范围并增强相容性。
目录
第一章:方法论
- 市场范围和定义
- 研究设计
- 研究方法
- 资料收集方法
- 资料探勘来源
- 全球的
- 地区/国家
- 基础估算与计算
- 基准年计算
- 市场评估的主要趋势
- 初步研究和验证
- 主要来源
- 预测模型
- 研究假设和局限性
第 2 章:执行摘要
第三章:行业洞察
- 产业生态系统分析
- 供应商格局
- 利润率分析
- 成本结构
- 每个阶段的增值
- 影响价值链的因素
- 中断
- 产业衝击力
- 成长动力
- 对数据驱动决策的需求不断增长
- 基于云端的分析平台的扩展
- 人工智慧与自然语言处理(NLP)的融合
- 各行各业的数位转型日益加深
- 减少 IT 依赖的需求日益增加
- 产业陷阱与挑战
- 数据品质与治理问题
- 与遗留系统的整合复杂性
- 市场机会
- 人工智慧与机器学习集成
- 中小型企业采用
- 产业特定解决方案开发
- 嵌入式分析扩展
- 新兴市场渗透
- 边缘和物联网分析应用程式
- 成长动力
- 成长潜力分析
- 监管格局
- GDPR资料保护合规性
- CCPA隐私法规的影响
- NIST网路安全框架
- 行业特定的资料法规
- 国际资料传输要求
- 人工智慧治理与道德准则
- 审计与合规报告标准
- 波特的分析
- PESTEL分析
- 技术和创新格局
- 当前的技术趋势
- 人工智慧与机器学习集成
- 自然语言处理的进展
- 自动化资料准备的演变
- 即时和串流分析
- 云端原生架构创新
- 新兴技术
- 行动分析技术
- 嵌入式分析功能
- 数据视觉化创新
- API 和整合技术
- 未来科技场景
- 全自动分析
- 对话式人工智慧分析
- 扩增实境资料视觉化
- 量子计算分析
- 情境规划框架
- 当前的技术趋势
- 价格趋势分析
- 按解决方案类型分類的历史定价演变
- 区域价格差异
- 订阅与永久授权定价
- 基于用户与基于容量的定价
- 功能层级定价策略
- 总拥有成本分析
- 成本分解分析
- 软体授权和订阅费用
- 实施和整合费用
- 培训和管理成本
- 资料基础设施和储存成本
- 持续维护和支持
- 合规与治理费用
- 专利分析
- 永续性和环境方面
- 永续实践
- 减少废弃物的策略
- 生产中的能源效率
- 环保倡议
- 碳足迹考虑
- 资料治理与品质管理
- 资料存取控制和安全
- 数据品质保证协议
- 主资料管理集成
- 数据沿袭和可追溯性
- 隐私保护机制
- 审计追踪和合规性监控
- 资料管理计划
- 投资格局分析
- 分析领域的创投
- 企业投资与收购活动
- 政府 IT 现代化资金
- 学术研究投资
- 企业分析预算分配
- 以投资类型进行的投资报酬率分析
- 技术开发资金
- 客户行为分析
- 分析工具选择标准
- 使用者采用和参与模式
- 自助服务与 IT 主导的分析偏好
- 培训和支援要求
- 成功指标和关键绩效指标跟踪
- 预算分配决策
- 区域偏好差异
- 市场进入壁垒
- 技术开发的复杂性
- 资料整合和相容性挑战
- 使用者体验设计要求
- 监理合规成本
- 客户信任与品牌认知
- 合作伙伴关係和通路发展
- 风险评估框架
- 资料安全和隐私风险
- 监理合规风险
- 技术过时的风险
- 供应商锁定和依赖风险
- 数据品质与治理风险
- 用户采用和变更管理风险
- 整合和相容性风险
- 数位转型整合
- 企业分析策略协调
- 云端迁移的影响
- 数据策略与治理演变
- 敏捷分析开发
- DevOps 和 DataOps 集成
- 组织变革管理
- 使用者体验与设计
- 直觉的介面设计原则
- 拖曳功能
- 视觉化分析最佳实践
- 行动用户体验优化
- 无障碍与包容性设计
- 使用者反馈和迭代周期
第四章:竞争格局
- 介绍
- 公司市占率分析
- 北美洲
- 欧洲
- 亚太地区
- 拉丁美洲
- 多边环境协定
- 主要市场参与者的竞争分析
- 竞争定位矩阵
- 战略展望矩阵
- 关键进展
- 併购
- 伙伴关係与合作
- 新产品发布
- 扩张计划和资金
第五章:市场估计与预测:依组件划分,2021 - 2034 年
- 主要趋势
- 软体
- 数据发现和视觉化工具
- 报告工具
- 资料整合和 ETL 工具
- 进阶分析
- 服务
- 咨询
- 培训与支援
- 託管服务
第六章:市场估计与预测:依部署模式,2021 - 2034 年
- 主要趋势
- 本地
- 基于云端
第七章:市场估计与预测:依组织规模,2021 - 2034 年
- 主要趋势
- 大型企业
- 中小型企业(SME)
第 8 章:市场估计与预测:按应用,2021 - 2034 年
- 主要趋势
- 销售与行销
- 金融
- 营运与供应链
- 人力资源
- 客户服务
- 其他的
第九章:市场估计与预测:依最终用途,2021 - 2034
- 主要趋势
- 银行、金融服务和保险(BFSI)
- 零售与电子商务
- 医疗保健和生命科学
- 製造业
- IT和电信
- 政府和公共部门
- 教育
- 能源和公用事业
- 其他(接待、交通等)
第 10 章:市场估计与预测:按地区,2021 年至 2034 年
- 主要趋势
- 北美洲
- 我们
- 加拿大
- 欧洲
- 德国
- 英国
- 法国
- 义大利
- 西班牙
- 北欧人
- 俄罗斯
- 葡萄牙
- 克罗埃西亚
- 亚太地区
- 中国
- 印度
- 日本
- 澳洲
- 韩国
- 新加坡
- 泰国
- 印尼
- 菲律宾
- 拉丁美洲
- 巴西
- 墨西哥
- 阿根廷
- 多边环境协定
- 南非
- 沙乌地阿拉伯
- 阿联酋
第 11 章:公司简介
- 全球参与者
- Adobe
- Amazon Web Services
- IBM
- Microsoft
- Oracle
- Qlik Technologies
- SAP
- SAS
- Tableau Software (Salesforce)
- 区域参与者
- Alteryx
- Databricks
- Dataiku
- Domo
- Looker
- Palantir
- Sisense
- Snowflake
- ThoughtSpot
- TIBCO Software
- 新兴玩家
- Chartio
- Grafana Labs
- Hex Technologies
- Klipfolio
- Metabase
- Mode Analytics
- Observable
- Periscope Data
- Retool
- Zoho
The Global Self-Service Analytics Market was valued at USD 6.2 billion in 2024 and is estimated to grow at a CAGR of 16.2% to reach USD 23 billion by 2034.
The rapid growth is fueled by the rising demand for faster, independent data access and analysis across enterprises. Self-service analytics empowers employees to explore, visualize, and interpret data on their own, eliminating the traditional reliance on IT departments and enabling real-time, data-driven decisions. As businesses shift toward agile operations, the demand for tools that support rapid insights and competitive adaptability continues to rise. The widespread push toward data democratization and cross-functional data access is transforming analytics into a core component of strategic planning. Additionally, enterprises are recognizing self-service analytics as a crucial enabler for scaling decision-making while improving operational efficiency.
| Market Scope | |
|---|---|
| Start Year | 2024 |
| Forecast Year | 2025-2034 |
| Start Value | $6.2 Billion |
| Forecast Value | $23 Billion |
| CAGR | 16.2% |
With ongoing advancements in automation, IoT integration, and sustainable cloud technologies, more companies are incorporating intelligent self-service analytics platforms. These systems reduce the burden on IT, lower operational expenses, and enable predictive and real-time analysis across departments. As energy-efficient cloud computing becomes more prevalent, the market sees increased adoption across industries prioritizing compliance, performance, and long-term digital transformation. The push for sustainability and improved governance has also placed self-service analytics at the forefront of responsible innovation in enterprise data strategy.
In 2024, the software segment held a 62% share, with expectations to grow at a CAGR of 16.7% through 2034. Software dominance is attributed to the growing adoption of artificial intelligence tools, advanced visualizations, and natural language interfaces that accelerate business decision-making and forecasting. These platforms are used in regions such as North America, Asia-Pacific, and Europe, where regulations, data accessibility, and scalable architecture requirements are increasing. Companies prefer these software solutions due to their ease of deployment, cloud compatibility, and ability to integrate into hybrid IT ecosystems.
The cloud-based deployments segment held a 70% share in 2024 and is estimated to grow at a 17% CAGR between 2025 and 2034. The popularity of cloud-based self-service analytics stems from its scalability, affordability, and remote accessibility, making it ideal for dynamic work environments and real-time operations. Businesses are embracing cloud deployment models for flexibility, reduced hardware dependencies, and cost management. The widespread adoption of subscription models, paired with support for multi-cloud operations, is especially appealing to mid-sized and smaller organizations looking to remain agile and competitive.
North America Self-Service Analytics Market held 49% share in 2024, attributed to widespread enterprise digitization, robust cloud infrastructure, and a strong emphasis on empowering teams through data autonomy. Organizations in the U.S. and Canada are increasingly moving toward decentralized analytics approaches to streamline decisions and reduce IT bottlenecks. The widespread use of advanced analytics solutions has positioned North America as a hub for innovation and rapid adoption in the self-service analytics space.
Key players operating in the Self-Service Analytics Market include Amazon Web Services, Qlik Technologies, SAS, SAP, Microsoft, IBM, Tableau Software (Salesforce), TIBCO Software, Oracle, and Sisense. To enhance their presence, leading companies in the self-service analytics sector are adopting several strategic initiatives. Many are focusing on expanding their product capabilities with AI-powered features, automated data prep, and natural language querying to simplify the user experience. Integration with cloud ecosystems and support for hybrid infrastructures allow firms to cater to varied enterprise needs. Partnerships with other tech providers and cloud platforms help in broadening reach and enhancing compatibility.
Table of Contents
Chapter 1 Methodology
- 1.1 Market scope and definition
- 1.2 Research design
- 1.2.1 Research approach
- 1.2.2 Data collection methods
- 1.3 Data mining sources
- 1.3.1 Global
- 1.3.2 Regional/Country
- 1.4 Base estimates and calculations
- 1.4.1 Base year calculation
- 1.4.2 Key trends for market estimation
- 1.5 Primary research and validation
- 1.5.1 Primary sources
- 1.6 Forecast model
- 1.7 Research assumptions and limitations
Chapter 2 Executive Summary
- 2.1 Industry 3600 synopsis, 2021 - 2034
- 2.2 Key market trends
- 2.2.1 Regional
- 2.2.2 Components
- 2.2.3 Deployment Mode
- 2.2.4 Enterprise Size
- 2.2.5 Application
- 2.2.6 End Use
- 2.3 TAM Analysis, 2025-2034
- 2.4 CXO perspectives: Strategic imperatives
- 2.4.1 Executive decision points
- 2.4.2 Critical success factors
- 2.5 Future outlook and strategic recommendations
Chapter 3 Industry Insights
- 3.1 Industry ecosystem analysis
- 3.1.1 Supplier landscape
- 3.1.2 Profit margin analysis
- 3.1.3 Cost structure
- 3.1.4 Value addition at each stage
- 3.1.5 Factor affecting the value chain
- 3.1.6 Disruptions
- 3.2 Industry impact forces
- 3.2.1 Growth drivers
- 3.2.1.1 Rising demand for data-driven decision-making
- 3.2.1.2 Expansion of cloud-based analytics platforms
- 3.2.1.3 Integration of AI and natural language processing (NLP)
- 3.2.1.4 Growing digital transformation across industries
- 3.2.1.5 Increasing need for reduced IT dependency
- 3.2.2 Industry pitfalls and challenges
- 3.2.2.1 Data quality and governance issues
- 3.2.2.2 Integration complexity with legacy systems
- 3.2.3 Market opportunities
- 3.2.3.1 AI & machine learning integration
- 3.2.3.2 Small & medium business adoption
- 3.2.3.3 Industry-specific solution development
- 3.2.3.4 Embedded analytics expansion
- 3.2.3.5 Emerging market penetration
- 3.2.3.6 Edge & IoT analytics applications
- 3.2.1 Growth drivers
- 3.3 Growth potential analysis
- 3.4 Regulatory landscape
- 3.4.1 GDPR data protection compliance
- 3.4.2 CCPA privacy regulation impact
- 3.4.3 NIST cybersecurity framework
- 3.4.4 Industry-specific data regulations
- 3.4.5 International data transfer requirements
- 3.4.6 AI governance & ethics guidelines
- 3.4.7 Audit & compliance reporting standards
- 3.5 Porter’s analysis
- 3.6 PESTEL analysis
- 3.7 Technology and innovation landscape
- 3.7.1 Current technological trends
- 3.7.1.1 Artificial intelligence & machine learning integration
- 3.7.1.2 Natural language processing advances
- 3.7.1.3 Automated data preparation evolution
- 3.7.1.4 Real-time & streaming analytics
- 3.7.1.5 Cloud-native architecture innovation
- 3.7.2 Emerging technologies
- 3.7.2.1 Mobile analytics technology
- 3.7.2.2 Embedded analytics capabilities
- 3.7.2.3 Data visualization innovation
- 3.7.2.4 API & integration technology
- 3.7.3 Future technology scenarios
- 3.7.3.1 Fully automated analytics
- 3.7.3.2 Conversational AI analytics
- 3.7.3.3 Augmented reality data visualization
- 3.7.3.4 Quantum computing analytics
- 3.7.3.5 Scenario planning framework
- 3.7.1 Current technological trends
- 3.8 Price trends analysis
- 3.8.1 Historical pricing evolution by solution type
- 3.8.2 Regional price variations
- 3.8.3 Subscription vs perpetual license pricing
- 3.8.4 User-based vs capacity-based pricing
- 3.8.5 Feature tier pricing strategies
- 3.8.6 Total cost of ownership analysis
- 3.9 Cost breakdown analysis
- 3.9.1 Software licensing & subscription costs
- 3.9.2 Implementation & integration expenses
- 3.9.3 Training & management costs
- 3.9.4 Data infrastructure & storage costs
- 3.9.5 Ongoing maintenance & support
- 3.9.6 Compliance & governance expenses
- 3.10 Patent analysis
- 3.11 Sustainability and environmental aspects
- 3.11.1 Sustainable practices
- 3.11.2 Waste reduction strategies
- 3.11.3 Energy efficiency in production
- 3.11.4 Eco-friendly Initiatives
- 3.11.5 Carbon footprint considerations
- 3.12 Data governance & quality management
- 3.12.1 Data access control & security
- 3.12.2 Data quality assurance protocols
- 3.12.3 Master data management integration
- 3.12.4 Data lineage & traceability
- 3.12.5 Privacy protection mechanisms
- 3.12.6 Audit trail & compliance monitoring
- 3.12.7 Data stewardship programs
- 3.13 Investment landscape analysis
- 3.13.1 Venture capital investment in analytics
- 3.13.2 Corporate investment & acquisition activity
- 3.13.3 Government IT modernization funding
- 3.13.4 Academic research investment
- 3.13.5 Enterprise analytics budget allocation
- 3.13.6 ROI analysis by investment type
- 3.13.7 Technology development funding
- 3.14 Customer behavior analysis
- 3.14.1 Analytics tool selection criteria
- 3.14.2 User adoption & engagement patterns
- 3.14.3 Self-service vs IT-led analytics preferences
- 3.14.4 Training & support requirements
- 3.14.5 Success metrics & KPI tracking
- 3.14.6 Budget allocation decisions
- 3.14.7 Regional preference variations
- 3.15 Market entry barriers
- 3.15.1 Technology development complexity
- 3.15.2 Data integration & compatibility challenges
- 3.15.3 User experience design requirements
- 3.15.4 Regulatory compliance costs
- 3.15.5 Customer trust & brand recognition
- 3.15.6 Partnership & channel development
- 3.16 Risk assessment framework
- 3.16.1 Data security & privacy risks
- 3.16.2 Regulatory compliance risks
- 3.16.3 Technology obsolescence risks
- 3.16.4 Vendor lock-in & dependency risks
- 3.16.5 Data quality & governance risks
- 3.16.6 User adoption & change management risks
- 3.16.7 Integration & compatibility risks
- 3.17 Digital transformation integration
- 3.17.1 Enterprise analytics strategy alignment
- 3.17.2 Cloud migration impact
- 3.17.3 Data strategy & governance evolution
- 3.17.4 Agile analytics development
- 3.17.5 DevOps & DataOps integration
- 3.17.6 Organizational change management
- 3.18 User experience & design
- 3.18.1 Intuitive interface design principles
- 3.18.2 Drag-and-drop functionality
- 3.18.3 Visual analytics best practices
- 3.18.4 Mobile user experience optimization
- 3.18.5 Accessibility & inclusive design
- 3.18.6 User feedback & iteration cycles
Chapter 4 Competitive Landscape, 2024
- 4.1 Introduction
- 4.2 Company market share analysis
- 4.2.1 North America
- 4.2.2 Europe
- 4.2.3 Asia Pacific
- 4.2.4 LATAM
- 4.2.5 MEA
- 4.3 Competitive analysis of major market players
- 4.4 Competitive positioning matrix
- 4.5 Strategic outlook matrix
- 4.6 Key developments
- 4.6.1 Mergers & acquisitions
- 4.6.2 Partnerships & collaborations
- 4.6.3 New Product Launches
- 4.6.4 Expansion Plans and funding
Chapter 5 Market Estimates & Forecast, By Component, 2021 - 2034 (USD Mn)
- 5.1 Key trends
- 5.2 Software
- 5.2.1 Data discovery & visualization tools
- 5.2.2 Reporting tools
- 5.2.3 Data integration & ETL tools
- 5.2.4 Advanced analytics
- 5.3 Services
- 5.3.1 Consulting
- 5.3.2 Training & support
- 5.3.3 Managed services
Chapter 6 Market Estimates & Forecast, By Deployment Mode, 2021 - 2034 (USD Mn)
- 6.1 Key trends
- 6.2 On-premises
- 6.3 Cloud-based
Chapter 7 Market Estimates & Forecast, By Organization Size, 2021 - 2034 (USD Mn)
- 7.1 Key trends
- 7.2 Large enterprises
- 7.3 Small & medium enterprises (SMEs)
Chapter 8 Market Estimates & Forecast, By Application, 2021 - 2034 (USD Mn)
- 8.1 Key trends
- 8.2 Sales & marketing
- 8.3 Finance
- 8.4 Operations & supply chain
- 8.5 Human resources
- 8.6 Customer service
- 8.7 Others
Chapter 9 Market Estimates & Forecast, By End Use, 2021 - 2034 (USD Mn)
- 9.1 Key trends
- 9.2 Banking, financial services & insurance (BFSI)
- 9.3 Retail & e-commerce
- 9.4 Healthcare & life sciences
- 9.5 Manufacturing
- 9.6 It & telecom
- 9.7 Government & public sector
- 9.8 Education
- 9.9 Energy & utilities
- 9.10 Others (hospitality, transportation, etc.)
Chapter 10 Market Estimates & Forecast, By Region, 2021 - 2034 (USD Mn)
- 10.1 Key trends
- 10.2 North America
- 10.2.1 US
- 10.2.2 Canada
- 10.3 Europe
- 10.3.1 Germany
- 10.3.2 UK
- 10.3.3 France
- 10.3.4 Italy
- 10.3.5 Spain
- 10.3.6 Nordics
- 10.3.7 Russia
- 10.3.8 Portugal
- 10.3.9 Croatia
- 10.4 Asia Pacific
- 10.4.1 China
- 10.4.2 India
- 10.4.3 Japan
- 10.4.4 Australia
- 10.4.5 South Korea
- 10.4.6 Singapore
- 10.4.7 Thailand
- 10.4.8 Indonesia
- 10.4.9 Philippines
- 10.5 Latin America
- 10.5.1 Brazil
- 10.5.2 Mexico
- 10.5.3 Argentina
- 10.6 MEA
- 10.6.1 South Africa
- 10.6.2 Saudi Arabia
- 10.6.3 UAE
Chapter 11 Company Profiles
- 11.1 Global Players
- 11.1.1 Adobe
- 11.1.2 Amazon Web Services
- 11.1.3 Google
- 11.1.4 IBM
- 11.1.5 Microsoft
- 11.1.6 Oracle
- 11.1.7 Qlik Technologies
- 11.1.8 SAP
- 11.1.9 SAS
- 11.1.10 Tableau Software (Salesforce)
- 11.2 Regional Players
- 11.2.1 Alteryx
- 11.2.2 Databricks
- 11.2.3 Dataiku
- 11.2.4 Domo
- 11.2.5 Looker
- 11.2.6 Palantir
- 11.2.7 Sisense
- 11.2.8 Snowflake
- 11.2.9 ThoughtSpot
- 11.2.10 TIBCO Software
- 11.3 Emerging Players
- 11.3.1 Chartio
- 11.3.2 Grafana Labs
- 11.3.3 Hex Technologies
- 11.3.4 Klipfolio
- 11.3.5 Metabase
- 11.3.6 Mode Analytics
- 11.3.7 Observable
- 11.3.8 Periscope Data
- 11.3.9 Retool
- 11.3.10 Zoho
 2026年全球客户自助服务软体市场报告
 全球自助式分析市场:预测(至 2034 年)-按分析功能、使用者技能等级、部署方式、资料来源连接方式、最终使用者和地区分類的分析市场
 自助式分析市场 - 全球产业规模、份额、趋势、机会及预测(按部署类型、应用、垂直产业、地区和竞争格局划分,2021-2031 年)
 客户自助服务软体市场(依部署模式、组织规模、通路类型、应用程式类型和垂直领域)-2025-2032 年全球预测
 自助服务分析市场规模、份额和趋势分析报告:按组件、应用、部署、公司规模、最终用途、地区和细分市场预测,2025 年至 2033 年
 客户自助服务软体:市场占有率分析、产业趋势、统计数据和成长预测(2025-2030 年)客户自助服务软体市场规模、份额、趋势分析报告:按解决方案、按服务、按部署、按最终用途、按地区、按细分市场、预测,2025-2030 年