


 |
市场调查报告书
商品编码
1844290
智慧尘埃市场机会、成长动力、产业趋势分析及 2025 - 2034 年预测Smart Dust Market Opportunity, Growth Drivers, Industry Trend Analysis, and Forecast 2025 - 2034 |
||||||
2024 年全球智慧尘埃市场价值为 1.539 亿美元,预计到 2034 年将以 14.3% 的复合年增长率增长至 5.72 亿美元。
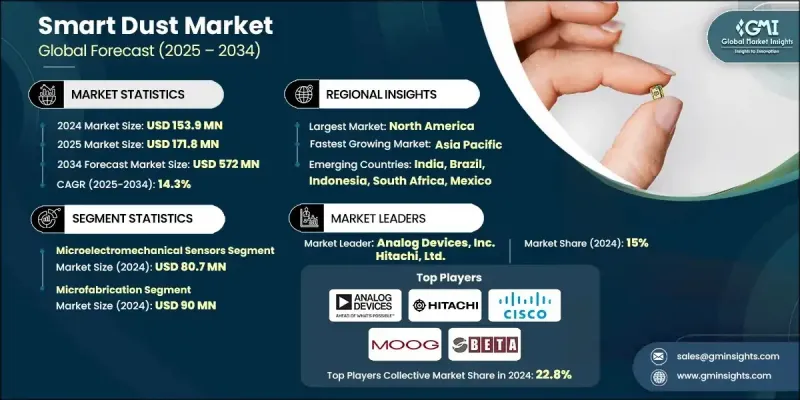
这一增长得益于几个关键因素,包括电子设备和感测器的小型化、工业物联网生态系统中部署的不断增加、环境监测需求的不断增长、无线通讯技术的突破以及医疗保健和生物医学应用的创新。随着感测器和电子元件尺寸的不断缩小,智慧微尘网路的功能正在向多个领域扩展。国家层级对微电子技术的投入正在推动超紧凑感测技术的生产。在医疗保健领域,对医学研究的投资为可植入和穿戴式微型感测器开闢了新的可能性。在智慧微尘系统中引入人工智慧和机器学习是一项重大进展,它实现了本地化资料处理,并减少了对持续外部通讯的依赖。基于人工智慧的智慧微尘现在可以进行自主决策、执行即时分析并检测操作异常。这些特性使智慧微尘特别适用于工业自动化、科学研究和远端现场操作等对时间敏感的应用,在这些应用中,边缘智慧和超低延迟至关重要。
| 市场范围 | |
|---|---|
| 起始年份 | 2024 |
| 预测年份 | 2025-2034 |
| 起始值 | 1.539亿美元 |
| 预测值 | 5.72亿美元 |
| 复合年增长率 | 14.3% |
2024年,微机电感测器 (MEMS) 市场规模达到8,070万美元。随着导航、瞄准和态势感知等国防应用对紧凑型节能感测器的需求不断增长,该市场将持续成长。 MEMS在空中和地面无人系统中的应用,使其能够在恶劣条件下实现更好的环境感知和可靠的通讯。企业要想在该领域保持竞争力,就需要开发具有更高灵敏度、更耐用性和更低功耗的国防级MEMS解决方案,以满足严格的政府标准并获得高价值的国防合约。
2024年,微加工领域的市场价值达9,000万美元。随着对微型电子产品和整合感测器的国防设备的需求不断增长,微加工技术正在推动紧凑型高精度系统的进步。这些改进正在赋能能源生产、士兵穿戴技术和自主感测器等领域的新功能。为了满足产业预期,製造商正在投资高性能微加工技术,这些技术经过专门设计,能够承受军事环境,同时满足监管要求。
2024年,美国智慧尘埃市场价值5,230万美元,这得益于战略国防专案对用于即时监控和战场分析的智慧尘埃系统的投资。美国正在投资智慧尘埃平台,这些平台能够在不危及人员生命的情况下,从危险或偏远地区传输关键资料。瞄准美国市场的製造商必须专注于开发安全、坚固耐用且高度可扩展的系统,这些系统必须与国防基础设施相容,并能适应严苛的现场条件。
全球智慧尘埃产业的主要参与者包括霍尼韦尔国际公司、穆格公司、英特尔公司、博世感测器技术有限公司、通用电气公司、Lightricity 有限公司、德州仪器公司、高通科技公司、日立有限公司、EnOcean 有限公司、Smartdust Solutions 有限公司、TE Connectivity 有限公司、意控股公司、BARM 控股半导体公司公司、思科系统公司、安森美半导体、ABB 有限公司、博通公司、Sonardyne 国际有限公司、亚德诺公司、挪威科技工业联合会 (SINTEF) 和国际商业机器公司。为了在智慧尘埃市场建立和维持竞争优势,各公司正在优先开发具有嵌入式人工智慧和即时处理能力的超低功耗、紧凑型感测器系统。他们正在投资先进的微製造技术,以生产高性能环境的国防级和医疗级组件。与政府机构、研发机构和行业参与者建立策略合作伙伴关係正在帮助製造商进入新市场并获得长期合约。
目录
第一章:方法论与范围
第二章:执行摘要
第三章:行业洞察
- 产业生态系统分析
- 供应商格局
- 利润率
- 成本结构
- 每个阶段的增值
- 影响价值链的因素
- 中断
- 产业衝击力
- 成长动力
- 感测器和电子设备的小型化
- 工业物联网 (IIoT) 的采用率不断上升
- 无线通讯协定的进步
- 医疗保健和生物医学创新
- 日益增长的环境监测需求
- 陷阱与挑战
- 高昂的实施和整合成本
- 资料安全和隐私问题
- 成长动力
- 成长潜力分析
- 监管格局
- 北美洲
- 欧洲
- 亚太地区
- 拉丁美洲
- 中东和非洲
- 波特的分析
- PESTEL分析
- 技术和创新格局
- 当前的技术趋势
- 新兴技术
- 新兴商业模式
- 合规性要求
- 专利和智慧财产权分析
- 地缘政治与贸易动态
第四章:竞争格局
- 介绍
- 公司市占率分析
- 按地区
- 北美洲
- 欧洲
- 亚太地区
- 拉丁美洲
- 中东和非洲
- 市场集中度分析
- 按地区
- 关键参与者的竞争基准
- 财务绩效比较
- 收入
- 利润率
- 研发
- 产品组合比较
- 产品范围广度
- 科技
- 创新
- 地理位置比较
- 全球足迹分析
- 服务网路覆盖
- 各地区市场渗透率
- 竞争定位矩阵
- 领导者
- 挑战者
- 追踪者
- 利基市场参与者
- 战略展望矩阵
- 财务绩效比较
- 2021-2024 年关键发展
- 併购
- 伙伴关係与合作
- 技术进步
- 扩张和投资策略
- 永续发展倡议
- 数位转型倡议
- 新兴/新创企业竞争对手格局
第五章:市场估计与预测:按类型,2021 - 2034
- 主要趋势
- 微机电感测器
- 机器人
- 其他的
第六章:市场估计与预测:按组件,2021 - 2034
- 主要趋势
- 感应器
- 电源单元
- 类比和数位 I/O 模组
- 讯号处理单元
- 控制电路
- 光传输模组
- 射频模组
- 其他的
第七章:市场估计与预测:按製造工艺,2021-2034 年
- 主要趋势
- 3D列印
- 微加工
第 8 章:市场估计与预测:按最终用途应用,2021 - 2034 年
- 主要趋势
- 军事和国防
- 监视和侦察
- 战斗态势感知
- 边境监控和追踪
- 其他的
- 医疗保健和生命科学
- 病人监护
- 生物医学研究
- 其他的
- 製造业和工业
- 製程控制自动化
- 预测性维护
- 其他的
- 电信和IT
- 能源和公用事业
- 农业
- 航太和研究机构
- 其他的
第九章:市场估计与预测:按地区,2021 - 2034
- 主要趋势
- 北美洲
- 我们
- 加拿大
- 欧洲
- 德国
- 英国
- 法国
- 西班牙
- 义大利
- 荷兰
- 亚太地区
- 中国
- 印度
- 日本
- 澳洲
- 韩国
- 拉丁美洲
- 巴西
- 墨西哥
- 阿根廷
- 中东和非洲
- 沙乌地阿拉伯
- 南非
- 阿联酋
第十章:公司简介
- 全球关键参与者
- Texas Instruments Inc.
- IBM Corporation
- Analog Devices, Inc.
- Intel Corporation
- Honeywell International Inc.
- 区域关键参与者
- 北美洲
- Broadcom Inc.
- Moog Inc.
- BetaBatt, Inc..
- 欧洲
- STMicroelectronics NV
- TE Connectivity Ltd.
- EnOcean GmbH
- SINTEF
- Asia-Pacific
- Hitachi, Ltd.
- NXP Semiconductors NV
- Bosch Sensortec GmbH
- 北美洲
- 颠覆者/利基市场参与者
- ARM Holdings plc
- Smartdust Solutions Ltd.
- Lightricity Ltd.
- CubeWorks, Inc.
- Sonardyne International Limited
- General Electric Company
- Cisco Systems, Inc.
- Onsemi
The Global Smart Dust Market was valued at USD 153.9 million in 2024 and is estimated to grow at a CAGR of 14.3% to reach USD 572 million by 2034.
The growth is owing to several key factors, including miniaturization of electronics and sensors, rising deployment in industrial IoT ecosystems, growing demand for environmental monitoring, breakthroughs in wireless communication technologies, and innovation in healthcare and biomedical applications. As sensor and electronics components continue to shrink in size, the capabilities of smart dust networks are expanding across multiple sectors. National-level investments in microelectronics are encouraging the production of ultra-compact sensing technologies. In the healthcare sector, investments in medical research are opening new possibilities for implantable and wearable micro-sensors. The introduction of artificial intelligence and machine learning within smart dust systems is a major development, enabling localized data processing and reducing reliance on continuous external communication. AI-powered smart dust can now carry out autonomous decision-making, perform real-time analytics, and detect operational anomalies. These features make smart dust especially suitable for time-sensitive applications across industrial automation, scientific research, and remote field operations where edge intelligence and ultra-low latency are critical.
| Market Scope | |
|---|---|
| Start Year | 2024 |
| Forecast Year | 2025-2034 |
| Start Value | $153.9 million |
| Forecast Value | $572 million |
| CAGR | 14.3% |
The microelectromechanical sensors (MEMS) segment generated USD 80.7 million in 2024. This segment continues to grow on the back of increased demand for compact, energy-saving sensors in defense applications such as navigation, targeting, and situational awareness. The adoption of MEMS in aerial and ground-based unmanned systems is enabling better environmental sensing and reliable communication under harsh conditions. For companies to remain competitive in this space, they need to develop defense-grade MEMS solutions with enhanced sensitivity, durability, and minimal energy consumption to meet stringent government standards and secure high-value defense contracts.
The microfabrication segment was valued at USD 90 million in 2024. With growing demand for miniaturized electronics and sensor-integrated defense equipment, microfabrication is driving advances in compact, high-precision systems. These improvements are enabling new capabilities in energy generation, soldier-wearable tech, and autonomous sensors. To meet industry expectations, manufacturers are investing in high-performance microfabrication technologies that are specifically engineered to withstand military environments while also meeting regulatory requirements.
U.S. Smart Dust Market was valued at USD 52.3 million in 2024, fueled by strategic defense programs investing in smart dust systems for real-time surveillance and battlefield analytics. The country is investing in smart dust platforms that can deliver critical data from dangerous or remote locations without endangering human lives. Manufacturers targeting the U.S. market must focus on developing secure, rugged, and highly scalable systems that are compatible with national defense infrastructure and built for demanding field conditions.
Major players in the Global Smart Dust Industry include Honeywell International Inc., Moog Inc., Intel Corporation, Bosch Sensortec GmbH, General Electric Company, Lightricity Ltd., Texas Instruments Inc., Qualcomm Technologies, Inc., Hitachi, Ltd., EnOcean GmbH, Smartdust Solutions Ltd., TE Connectivity Ltd., STMicroelectronics N.V., ARM Holdings plc, NXP Semiconductors N.V., BetaBatt, Inc., Cisco Systems, Inc., onsemi, ABB Ltd., Broadcom Inc., Sonardyne International Limited, Analog Devices, Inc., Stiftelsen for industriell og teknisk forskning (SINTEF), and International Business Machines Corporation. To build and maintain a competitive edge in the smart dust market, companies are prioritizing the development of ultra-low-power, compact sensor systems with embedded AI and real-time processing capabilities. They are investing in advanced microfabrication to produce defense-grade and medical-grade components tailored for high-performance environments. Strategic partnerships with government agencies, R&D institutions, and industry players are helping manufacturers gain access to new markets and secure long-term contracts.
Table of Contents
Chapter 1 Methodology and scope
- 1.1 Market scope and definition
- 1.2 Research design
- 1.2.1 Research approach
- 1.2.2 Data collection methods
- 1.3 Data mining sources
- 1.3.1 Global
- 1.3.2 Regional/Country
- 1.4 Base estimates and calculations
- 1.4.1 Base year calculation
- 1.4.2 Key trends for market estimation
- 1.5 Primary research and validation
- 1.5.1 Primary sources
- 1.6 Forecast model
- 1.7 Research assumptions and limitations
Chapter 2 Executive summary
- 2.1 Industry 3600 synopsis
- 2.2 Key market trends
- 2.2.1 Type trend
- 2.2.2 Component trends
- 2.2.3 Manufacturing process trends
- 2.2.4 End use application trends
- 2.2.5 Regional trends
- 2.3 TAM Analysis, 2025-2034 (USD Billion)
- 2.4 CXO perspectives: Strategic imperatives
- 2.4.1 Executive decision points
- 2.4.2 critical success factors
- 2.5 Future outlook and strategic recommendations
Chapter 3 Industry insights
- 3.1 Industry ecosystem analysis
- 3.1.1 Supplier landscape
- 3.1.2 Profit margin
- 3.1.3 Cost structure
- 3.1.4 Value addition at each stage
- 3.1.5 Factor affecting the value chain
- 3.1.6 Disruptions
- 3.2 Industry impact forces
- 3.2.1 Growth drivers
- 3.2.1.1 The miniaturization of sensors and electronics
- 3.2.1.2 Rising adoption in industrial IoT (IIoT)
- 3.2.1.3 Advancements in wireless communication protocols
- 3.2.1.4 Healthcare and biomedical innovations
- 3.2.1.5 The growing environmental monitoring needs
- 3.2.2 Pitfalls and challenges
- 3.2.2.1 High Implementation and Integration Costs
- 3.2.2.2 Data Security and Privacy Concerns
- 3.2.1 Growth drivers
- 3.3 Growth potential analysis
- 3.4 Regulatory landscape
- 3.4.1 North America
- 3.4.2 Europe
- 3.4.3 Asia Pacific
- 3.4.4 Latin America
- 3.4.5 Middle East & Africa
- 3.5 Porter’s analysis
- 3.6 PESTEL analysis
- 3.7 Technology and innovation landscape
- 3.7.1 Current technological trends
- 3.7.2 Emerging technologies
- 3.8 Emerging business models
- 3.9 Compliance requirements
- 3.10 Patent and IP analysis
- 3.11 Geopolitical and trade dynamics
Chapter 4 Competitive landscape, 2024
- 4.1 Introduction
- 4.2 Company market share analysis
- 4.2.1 By region
- 4.2.1.1 North America
- 4.2.1.2 Europe
- 4.2.1.3 Asia Pacific
- 4.2.1.4 Latin America
- 4.2.1.5 Middle East & Africa
- 4.2.2 Market Concentration Analysis
- 4.2.1 By region
- 4.3 Competitive benchmarking of key players
- 4.3.1 Financial performance comparison
- 4.3.1.1 Revenue
- 4.3.1.2 Profit margin
- 4.3.1.3 R&D
- 4.3.2 Product portfolio comparison
- 4.3.2.1 Product range breadth
- 4.3.2.2 Technology
- 4.3.2.3 Innovation
- 4.3.3 Geographic presence comparison
- 4.3.3.1 Global footprint analysis
- 4.3.3.2 Service network coverage
- 4.3.3.3 Market penetration by region
- 4.3.4 Competitive positioning matrix
- 4.3.4.1 Leaders
- 4.3.4.2 Challengers
- 4.3.4.3 Followers
- 4.3.4.4 Niche players
- 4.3.5 Strategic outlook matrix
- 4.3.1 Financial performance comparison
- 4.4 Key developments, 2021-2024
- 4.4.1 Mergers and acquisitions
- 4.4.2 Partnerships and collaborations
- 4.4.3 Technological advancements
- 4.4.4 Expansion and investment strategies
- 4.4.5 Sustainability initiatives
- 4.4.6 Digital transformation initiatives
- 4.5 Emerging/ startup competitors landscape
Chapter 5 Market estimates and forecast, by Type, 2021 - 2034 (USD Million)
- 5.1 Key trends
- 5.2 Microelectromechanical Sensors
- 5.3 Robots
- 5.4 Others
Chapter 6 Market estimates and forecast, by Component, 2021 - 2034 (USD Million)
- 6.1 Key trends
- 6.2 Sensors
- 6.3 Power supply units
- 6.4 Analog and digital I/O modules
- 6.5 Signal processing units
- 6.6 Control circuitry
- 6.7 Optical transmission modules
- 6.8 Radio frequency modules
- 6.9 Others
Chapter 7 Market estimates and forecast, by Manufacturing Process, 2021 - 2034 (USD Million)
- 7.1 Key trends
- 7.2 3D Printing
- 7.3 Microfabrication
Chapter 8 Market estimates and forecast, by End Use Application, 2021 - 2034 (USD Million)
- 8.1 Key trends
- 8.2 Military and defense
- 8.2.1 Surveillance and reconnaissance
- 8.2.2 Combat situational awareness
- 8.2.3 Border monitoring and tracking
- 8.2.4 Others
- 8.3 Healthcare and life sciences
- 8.3.1 Patient monitoring
- 8.3.2 Biomedical research
- 8.3.3 Others
- 8.4 Manufacturing and industrial
- 8.4.1 Process control automation
- 8.4.2 Predictive maintenance
- 8.4.3 Others
- 8.5 Telecommunications and IT
- 8.6 Energy and utilities
- 8.7 Agriculture
- 8.8 Aerospace and research institutions
- 8.9 Others
Chapter 9 Market estimates and forecast, by Region, 2021 - 2034 (USD Million)
- 9.1 Key trends
- 9.2 North America
- 9.2.1 U.S.
- 9.2.2 Canada
- 9.3 Europe
- 9.3.1 Germany
- 9.3.2 UK
- 9.3.3 France
- 9.3.4 Spain
- 9.3.5 Italy
- 9.3.6 Netherlands
- 9.4 Asia Pacific
- 9.4.1 China
- 9.4.2 India
- 9.4.3 Japan
- 9.4.4 Australia
- 9.4.5 South Korea
- 9.5 Latin America
- 9.5.1 Brazil
- 9.5.2 Mexico
- 9.5.3 Argentina
- 9.6 Middle East and Africa
- 9.6.1 Saudi Arabia
- 9.6.2 South Africa
- 9.6.3 UAE
Chapter 10 Company profiles
- 10.1 Global Key Players
- 10.1.1 Texas Instruments Inc.
- 10.1.2 IBM Corporation
- 10.1.3 Analog Devices, Inc.
- 10.1.4 Intel Corporation
- 10.1.5 Honeywell International Inc.
- 10.2 Regional Key Players
- 10.2.1 North America
- 10.2.1.1 Broadcom Inc.
- 10.2.1.2 Moog Inc.
- 10.2.1.3 BetaBatt, Inc..
- 10.2.2 Europe
- 10.2.2.1 STMicroelectronics N.V.
- 10.2.2.2 TE Connectivity Ltd.
- 10.2.2.3 EnOcean GmbH
- 10.2.2.4 SINTEF
- 10.2.3 Asia-Pacific
- 10.2.3.1 Hitachi, Ltd.
- 10.2.3.2 NXP Semiconductors N.V.
- 10.2.3.3 Bosch Sensortec GmbH
- 10.2.1 North America
- 10.3 Disruptors / Niche Players
- 10.3.1 ARM Holdings plc
- 10.3.2 Smartdust Solutions Ltd.
- 10.3.3 Lightricity Ltd.
- 10.3.4 CubeWorks, Inc.
- 10.3.5 Sonardyne International Limited
- 10.3.6 General Electric Company
- 10.3.7 Cisco Systems, Inc.
- 10.3.8 Onsemi
 工业感测器网路市场预测至2034年—按组件、感测器类型、应用和区域分類的全球分析
 工业无线感测网路市场报告:按组件、感测器类型、应用、最终用途和地区划分(2026-2034 年)
 智慧粉尘市场(至 2035 年):依粉尘类型、组件、製造流程、最终用户和地区划分的产业趋势和全球预测
 无线感测网路市场分析及预测(至2035年):按类型、产品、服务、技术、组件、应用、部署、最终用户和功能划分智慧微尘市场分析及预测(至2035年):依类型、产品类型、服务、技术、组件、应用、材质、设备及最终使用者划分
 2026年全球无线感测网路网路市场报告
 工业无线感测网路市场 - 全球产业规模、份额、趋势、机会及预测(按感测器、技术、产业垂直领域、地区和竞争格局划分,2021-2031年)
 工业无线感测器网路(IWSN)市场规模、份额和成长分析(按组件、感测器类型、应用、最终用户和地区划分)—2026-2033年产业预测
 智慧灰尘感测器在家庭监测中的市场机会、成长驱动因素、产业趋势分析及预测(2025-2034年)
 全球智慧尘埃市场:2025年至2030年预测