


 |
市场调查报告书
商品编码
1871126
食品废弃物中生物活性胜肽的市场机会、成长驱动因素、产业趋势分析及预测(2025-2034年)Bioactive Peptide from Food Waste Market Opportunity, Growth Drivers, Industry Trend Analysis, and Forecast 2025 - 2034 |
||||||
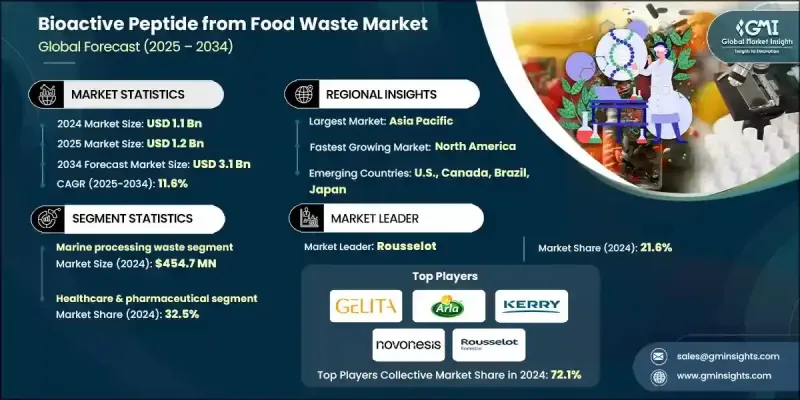
2024 年全球食品废弃物生物活性胜肽市场价值为 11 亿美元,预计到 2034 年将以 11.6% 的复合年增长率成长至 31 亿美元。
从食品加工残渣和废弃原料中提取的生物活性胜肽正被越来越多地用于开发包括营养保健品、药品和功能性食品在内的健康促进产品。人们对永续发展和环境保护的日益关注,促使各行业采用符合循环经济目标的废弃物资源化利用策略。世界各国政府正在推出支持性法规,以促进减少食物浪费并将其转化为高附加价值产品。采用环保萃取方法,例如酶水解和先进的绿色技术,正在透过提高产量、提升纯度和降低环境影响,改变这些胜肽的生产方式。这些创新正在推动市场需求,因为它们符合消费者对清洁标籤和永续性的偏好。来自食物废弃物的生物活性胜肽因其已被证实具有的健康促进特性(例如抗氧化、抗菌和抗发炎活性),在功能性食品应用领域越来越受欢迎。消费者对预防性健康的日益重视,促使製造商开发先进的配方,以满足消费者对天然有效健康解决方案日益增长的需求。
| 市场范围 | |
|---|---|
| 起始年份 | 2024 |
| 预测年份 | 2025-2034 |
| 起始值 | 11亿美元 |
| 预测值 | 31亿美元 |
| 复合年增长率 | 11.6% |
2024年,海洋加工废弃物领域创造了4.547亿美元的产值。此领域包括鱼类、水产养殖和贝类残渣,富含生物活性分子,是生产高纯度胜肽的重要来源。由于这些化合物具有很高的营养和治疗潜力,它们在营养保健品、化妆品和功能性食品等行业中的应用日益广泛。
2024年,医疗保健和製药领域占了32.5%的市场。这一主导地位归功于生物活性胜肽在药物研发、医学营养和旨在治疗慢性疾病的临床製剂中日益广泛的应用。人口老化和注重健康的消费者需求不断增长,进一步推动了具有抗发炎、降血压和抗氧化作用的生物活性化合物的应用。
2025年至2034年间,北美食品废弃物生物活性胜肽市场将以11.5%的复合年增长率成长。市场成长得益于消费者对天然、健康和永续食品配料日益增长的需求。随着注重健康的消费者越来越多地寻求功能性食品、膳食补充剂和营养保健品,该地区的製造商正加大对生物活性胜肽在食品和饮料创新中的应用投入。
在食品废弃物生物活性胜肽市场中,领先的企业包括Arla Foods Ingredients Group、DSM-Firmenich、Fonterra (NZMP)、GELITA、Glanbia plc、Kerry Group plc、Novonesis、PB Leiner、Rousselot和Tessenderlo Group。这些企业正致力于策略合作、永续产品创新和先进萃取技术,以提升市场占有率。领先的生产商正在投资绿色生产方法,以提高胜肽的品质并最大限度地减少对环境的影响。许多公司正在加强研发能力,以拓展产品组合,满足以健康为中心的应用需求。与食品加工商和生物技术公司的合作也有助于有效利用废弃物。此外,市场参与者正在采用以永续性和清洁标籤为核心的品牌策略,以吸引环保意识的消费者。
目录
第一章:方法论与范围
第二章:执行概要
第三章:行业洞察
- 产业生态系分析
- 供应商格局
- 利润率
- 每个阶段的价值增加
- 影响价值链的因素
- 中断
- 产业影响因素
- 成长驱动因素
- 日益关注循环经济和废弃物资源化利用
- 对天然和清洁标籤成分的需求不断增长
- 支持食物垃圾利用的监管框架
- 产业陷阱与挑战
- 消费者对废弃物衍生原料的认知问题
- 品质控制与污染管理
- 市场机会
- 新兴市场中尚未开发的食物垃圾来源
- 与个性化营养趋势的融合
- 成长驱动因素
- 成长潜力分析
- 监管环境
- 北美洲
- 欧洲
- 亚太地区
- 拉丁美洲
- 中东和非洲
- 波特的分析
- PESTEL 分析
- 技术与创新格局
- 当前技术趋势
- 新兴技术
- 价格趋势
- 按地区
- 来源
- 未来市场趋势
- 专利格局
- 贸易统计(HS编码)(註:仅提供重点国家的贸易统计资料)
- 主要进口国
- 主要出口国
- 永续性和环境方面
- 永续实践
- 减少废弃物策略
- 生产中的能源效率
- 环保倡议
- 碳足迹考量
第四章:竞争格局
- 介绍
- 公司市占率分析
- 按地区
- 北美洲
- 欧洲
- 亚太地区
- 拉丁美洲
- MEA
- 按地区
- 公司矩阵分析
- 主要市场参与者的竞争分析
- 竞争定位矩阵
- 关键进展
- 併购
- 合作伙伴关係与合作
- 新产品发布
- 扩张计划
第五章:市场估算与预测:依来源划分,2021-2034年
- 主要趋势
- 乳製品废弃物
- 乳清加工残渣
- 乳酪生产副产品
- 牛奶加工废料
- 肉类加工副产品
- 血液和血浆成分
- 皮革加工废料
- 骨和软骨残余物
- 动物内臟加工副产品
- 海洋处理废料
- 鱼类加工残渣
- 贝类加工副产品
- 水产养殖废弃物
- 植物性蛋白质残基
- 油籽加工粕
- 粮食加工副产品
- 脉衝处理残留物
- 蔬果加工废料
第六章:市场估算与预测:依最终用途产业划分,2021-2034年
- 主要趋势
- 医疗保健和製药
- 营养保健品和膳食补充剂
- 治疗药物研发
- 医学营养
- 临床研究与开发
- 非处方药
- 餐饮
- 功能性食品成分
- 蛋白质强化
- 天然防腐剂
- 风味增强
- 发酵产品
- 饮料强化
- 个人护理及化妆品
- 抗衰老护肤
- 保湿补水
- 头髮护理与头皮健康
- 伤口护理与癒合
- 防晒
- 男士仪容护理
- 动物饲料与营养
- 水产饲料
- 牲畜饲料添加剂
- 宠物食品和零食
- 家禽饲料
- 猪饲料
- 反刍动物饲料
- 农业与生物技术
- 生物刺激剂
- 植物生长促进剂
- 土壤健康改善
- 作物保护
- 种子处理
- 运动营养与健身
- 运动前补充剂
- 运动后恢復
- 蛋白粉
- 能量棒和零食
- 水合产品
第七章:市场估计与预测:依地区划分,2021-2034年
- 主要趋势
- 北美洲
- 我们
- 加拿大
- 欧洲
- 德国
- 英国
- 法国
- 西班牙
- 义大利
- 欧洲其他地区
- 亚太地区
- 中国
- 印度
- 日本
- 澳洲
- 韩国
- 亚太其他地区
- 拉丁美洲
- 巴西
- 墨西哥
- 阿根廷
- 拉丁美洲其他地区
- 中东和非洲
- 沙乌地阿拉伯
- 南非
- 阿联酋
- 中东和非洲其他地区
第八章:公司简介
- Arla Foods Ingredients Group
- DSM-Firmenich
- Fonterra (NZMP)
- GELITA
- Glanbia plc
- Kerry Group plc
- Novonesis
- PB Leiner
- Rousselot
- Tessenderlo Group
The Global Bioactive Peptide from Food Waste Market was valued at USD 1.1 Billion in 2024 and is estimated to grow at a CAGR of 11.6% to reach USD 3.1 Billion by 2034.
Bioactive peptides obtained from food processing residues and discarded raw materials are increasingly being utilized to develop health-promoting products, including nutraceuticals, pharmaceuticals, and functional foods. Growing attention toward sustainability and environmental protection has encouraged industries to adopt waste valorization strategies that align with circular economy goals. Governments across the world are introducing supportive regulations to promote food waste reduction and its conversion into value-added products. The use of eco-friendly extraction methods, such as enzymatic hydrolysis and advanced green technologies, is transforming the production of these peptides by enhancing yield, improving purity, and lowering environmental impact. These innovations are driving demand as they align with clean-label and sustainability preferences among consumers. Bioactive peptides from food waste are gaining traction in functional food applications due to their proven health-promoting properties, such as antioxidant, antimicrobial, and anti-inflammatory activities. Rising consumer awareness around preventive health has motivated manufacturers to develop advanced formulations that cater to the growing demand for natural and effective wellness solutions.
| Market Scope | |
|---|---|
| Start Year | 2024 |
| Forecast Year | 2025-2034 |
| Start Value | $1.1 Billion |
| Forecast Value | $3.1 Billion |
| CAGR | 11.6% |
The marine processing waste segment generated USD 454.7 million in 2024. This category, comprising fish, aquaculture, and shellfish residues, is rich in bioactive molecules, making it an essential source for high-purity peptide production. These compounds are increasingly used in industries such as nutraceuticals, cosmetics, and functional foods because of their high nutritional and therapeutic potential.
The healthcare and pharmaceutical segment accounted for a 32.5% share in 2024. This dominance is attributed to the growing use of bioactive peptides in drug development, medical nutrition, and clinical formulations aimed at managing chronic diseases. Increasing demand from aging populations and health-focused consumers has further strengthened the adoption of bioactive compounds with anti-inflammatory, antihypertensive, and antioxidant effects.
North America Bioactive Peptide from Food Waste Market will grow at a CAGR of 11.5% between 2025 and 2034. Market growth is supported by the rising preference for natural, healthy, and sustainable food ingredients. As health-conscious consumers increasingly seek functional foods, supplements, and nutraceutical products, manufacturers in the region are investing in bioactive peptide integration within food and beverage innovations.
Leading companies operating in Bioactive Peptide from Food Waste Market include Arla Foods Ingredients Group, DSM-Firmenich, Fonterra (NZMP), GELITA, Glanbia plc, Kerry Group plc, Novonesis, PB Leiner, Rousselot, and Tessenderlo Group. Companies are focusing on strategic collaborations, sustainable product innovations, and advanced extraction technologies to enhance their market presence. Leading manufacturers are investing in green production methods to improve peptide quality and minimize environmental impact. Many firms are strengthening their R&D capabilities to expand product portfolios catering to health-focused applications. Partnerships with food processors and biotech firms are also enabling efficient utilization of waste materials. Additionally, market players are adopting branding strategies centered on sustainability and clean-label claims to attract eco-conscious consumers.
Table of Contents
Chapter 1 Methodology & Scope
- 1.1 Market scope and definition
- 1.2 Research design
- 1.2.1 Research approach
- 1.2.2 Data collection methods
- 1.3 Data mining sources
- 1.3.1 Global
- 1.3.2 Regional/Country
- 1.4 Base estimates and calculations
- 1.4.1 Base year calculation
- 1.4.2 Key trends for market estimation
- 1.5 Primary research and validation
- 1.5.1 Primary sources
- 1.6 Forecast model
- 1.7 Research assumptions and limitations
Chapter 2 Executive Summary
- 2.1 Industry 3600 synopsis
- 2.2 Key market trends
- 2.2.1 Source trends
- 2.2.2 End use industry trends
- 2.2.3 Regional trends
- 2.3 TAM Analysis, 2025-2034
- 2.4 CXO perspectives: strategic imperatives
- 2.4.1 Executive decision points
- 2.4.2 Critical success factors
- 2.5 Future outlook and strategic recommendations
Chapter 3 Industry Insights
- 3.1 Industry ecosystem analysis
- 3.1.1 Supplier landscape
- 3.1.2 Profit margin
- 3.1.3 Value addition at each stage
- 3.1.4 Factor affecting the value chain
- 3.1.5 Disruptions
- 3.2 Industry impact forces
- 3.2.1 Growth drivers
- 3.2.1.1 Growing focus on circular economy & waste valorization
- 3.2.1.2 Rising demand for natural & clean-label ingredients
- 3.2.1.3 Supportive regulatory framework for food waste utilization
- 3.2.2 Industry pitfalls and challenges
- 3.2.2.1 Consumer perception issues with waste-derived ingredients
- 3.2.2.2 Quality control & contamination management
- 3.2.3 Market opportunities
- 3.2.3.1 Untapped food waste streams in emerging markets
- 3.2.3.2 Integration with personalized nutrition trends
- 3.2.1 Growth drivers
- 3.3 Growth potential analysis
- 3.4 Regulatory landscape
- 3.4.1 North America
- 3.4.2 Europe
- 3.4.3 Asia Pacific
- 3.4.4 Latin America
- 3.4.5 Middle East & Africa
- 3.5 Porter's analysis
- 3.6 PESTEL analysis
- 3.7 Technology and Innovation landscape
- 3.7.1 Current technological trends
- 3.7.2 Emerging technologies
- 3.8 Price trends
- 3.8.1 By region
- 3.8.2 By source
- 3.9 Future market trends
- 3.10 Patent Landscape
- 3.11 Trade statistics (HS code) ( Note: the trade statistics will be provided for key countries only)
- 3.11.1 Major importing countries
- 3.11.2 Major exporting countries
- 3.12 Sustainability and environmental aspects
- 3.12.1 Sustainable practices
- 3.12.2 Waste reduction strategies
- 3.12.3 Energy efficiency in production
- 3.12.4 Eco-friendly initiatives
- 3.13 Carbon footprint consideration
Chapter 4 Competitive Landscape, 2024
- 4.1 Introduction
- 4.2 Company market share analysis
- 4.2.1 By region
- 4.2.1.1 North America
- 4.2.1.2 Europe
- 4.2.1.3 Asia Pacific
- 4.2.1.4 LATAM
- 4.2.1.5 MEA
- 4.2.1 By region
- 4.3 Company matrix analysis
- 4.4 Competitive analysis of major market players
- 4.5 Competitive positioning matrix
- 4.6 Key developments
- 4.6.1 Mergers & acquisitions
- 4.6.2 Partnerships & collaborations
- 4.6.3 New product launches
- 4.6.4 Expansion plans
Chapter 5 Market Estimates and Forecast, By Source, 2021-2034 (USD Million) (Kilo Tons)
- 5.1 Key trends
- 5.2 Dairy waste streams
- 5.2.1 Whey processing residues
- 5.2.2 Cheese manufacturing byproducts
- 5.2.3 Milk processing waste
- 5.3 Meat processing byproducts
- 5.3.1 Blood & plasma fractions
- 5.3.2 Skin & hide processing waste
- 5.3.3 Bone & cartilage residues
- 5.3.4 Organ meat processing byproducts
- 5.4 Marine processing waste
- 5.4.1 Fish processing residues
- 5.4.2 Shellfish processing byproducts
- 5.4.3 Aquaculture waste streams
- 5.5 Plant protein residues
- 5.5.1 Oilseed processing meals
- 5.5.2 Grain processing byproducts
- 5.5.3 Pulse processing residues
- 5.5.4 Fruit & vegetable processing waste
Chapter 6 Market Estimates and Forecast, By End Use Industry, 2021-2034 (USD Million) (Kilo Tons)
- 6.1 Key trends
- 6.2 Healthcare & pharmaceutical
- 6.2.1 Nutraceutical & dietary supplement
- 6.2.2 Therapeutic drug development
- 6.2.3 Medical nutrition
- 6.2.4 Clinical research & development
- 6.2.5 Over-the-counter (OTC) medicine
- 6.3 Food & beverage
- 6.3.1 Functional food ingredient
- 6.3.2 Protein fortification
- 6.3.3 Natural preservative
- 6.3.4 Flavor enhancement
- 6.3.5 Fermented product
- 6.3.6 Beverage fortification
- 6.4 Personal care & cosmetics
- 6.4.1 Anti-aging skincare
- 6.4.2 Moisturizing & hydration
- 6.4.3 Hair care & scalp health
- 6.4.4 Wound care & healing
- 6.4.5 Sun protection
- 6.4.6 Men's grooming
- 6.5 Animal feed & nutrition
- 6.5.1 Aquaculture feed
- 6.5.2 Livestock feed supplement
- 6.5.3 Pet food & treats
- 6.5.4 Poultry feed
- 6.5.5 Swine feed
- 6.5.6 Ruminant feed
- 6.6 Agriculture & biotechnology
- 6.6.1 Bio-stimulant
- 6.6.2 Plant growth promoter
- 6.6.3 Soil health enhancement
- 6.6.4 Crop protection
- 6.6.5 Seed treatment
- 6.7 Sports nutrition & fitness
- 6.7.1 Pre-workout supplement
- 6.7.2 Post-workout recovery
- 6.7.3 Protein powder
- 6.7.4 Energy bar & snack
- 6.7.5 Hydration product
Chapter 7 Market Estimates and Forecast, By Region, 2021-2034 (USD Million) (Kilo Tons)
- 7.1 Key trends
- 7.2 North America
- 7.2.1 U.S.
- 7.2.2 Canada
- 7.3 Europe
- 7.3.1 Germany
- 7.3.2 UK
- 7.3.3 France
- 7.3.4 Spain
- 7.3.5 Italy
- 7.3.6 Rest of Europe
- 7.4 Asia Pacific
- 7.4.1 China
- 7.4.2 India
- 7.4.3 Japan
- 7.4.4 Australia
- 7.4.5 South Korea
- 7.4.6 Rest of Asia Pacific
- 7.5 Latin America
- 7.5.1 Brazil
- 7.5.2 Mexico
- 7.5.3 Argentina
- 7.5.4 Rest of Latin America
- 7.6 Middle East and Africa
- 7.6.1 Saudi Arabia
- 7.6.2 South Africa
- 7.6.3 UAE
- 7.6.4 Rest of Middle East and Africa
Chapter 8 Company Profiles
- 8.1 Arla Foods Ingredients Group
- 8.2 DSM-Firmenich
- 8.3 Fonterra (NZMP)
- 8.4 GELITA
- 8.5 Glanbia plc
- 8.6 Kerry Group plc
- 8.7 Novonesis
- 8.8 PB Leiner
- 8.9 Rousselot
- 8.10 Tessenderlo Group
