


 |
市场调查报告书
商品编码
1871127
钠离子电池化学品市场机会、成长驱动因素、产业趋势分析及预测(2025-2034年)Sodium-Ion Battery Chemicals Market Opportunity, Growth Drivers, Industry Trend Analysis, and Forecast 2025 - 2034 |
||||||
2024 年全球钠离子电池化学品市场价值为 1.5 亿美元,预计到 2034 年将以 55% 的复合年增长率增长至 85 亿美元。
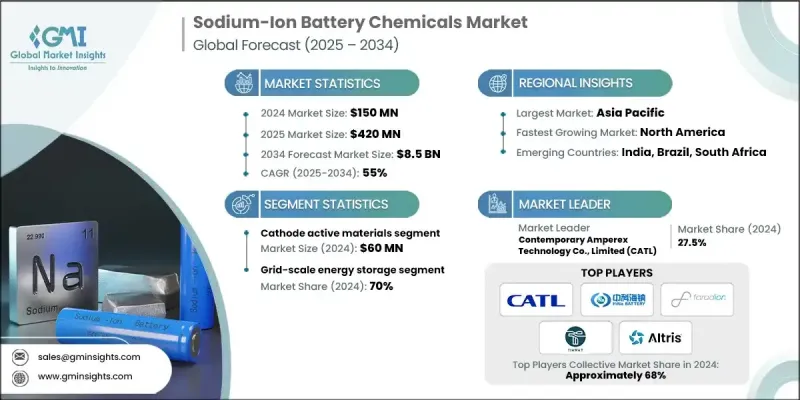
钠离子电池市场的快速成长得益于其成本效益,这主要归功于储量丰富的无钴材料以及优化的电解液-正极组合。工业和电网级用户优先考虑每千瓦时成本、循环寿命和安全性,这使得钠离子电池在这些领域极具吸引力。由于体积能量的限制,移动出行领域的应用仍持谨慎态度,预计一旦能量密度超过200 Wh/kg,应用范围将进一步扩大。区域政策也发挥关键作用:欧盟强调可回收性和报废管理,支持高钠电池技术的发展;而中国「十四五」规划下的产业战略则加速了国内试点计画和材料规模化生产。电网级应用确保了对上游化学品(尤其是电解液和添加剂)的稳定需求,而性能提升、成本降低和正极材料的创新则巩固了钠离子电池在工业、电网和特定移动出行领域的市场地位。
| 市场范围 | |
|---|---|
| 起始年份 | 2024 |
| 预测年份 | 2025-2034 |
| 起始值 | 1.5亿美元 |
| 预测值 | 85亿美元 |
| 复合年增长率 | 55% |
2024年,正极活性材料市场规模达6,000万美元。由于在能量密度和循环寿命性能方面发挥关键作用,正极活性材料占据了最大的价值份额;负极材料约占30%,其余部分为辅助化学品和其他材料。早期钠离子电池的能量密度约为175 Wh/kg,随着磷酸钒钠和NASICON正极技术的进步,预计到2027年,能量密度将超过200 Wh/kg。正极技术的创新是能量密度提升的主要驱动力,而硬碳负极则有助于提高首圈效率和长期容量维持率。
电网级储能领域占70%的市场份额,预计2024年市场规模将达到1.05亿美元。钠离子电池为再生能源併网和负荷均衡提供了经济高效且热安全的解决方案。此外,在低速电动车领域,钠离子电池的应用也日益普及,因为在这些领域,经济性和安全性比体积能量密度更为重要。
2024年,北美钠离子电池化学品市场规模达1,800万美元。联邦政府对研发和商业化的资助,以及工业和资料中心应用领域的私人资本投资,是推动市场成长的关键因素。美国政府机构的各项措施正将大量资源投入替代化学品的规模化生产。製造项目,尤其是在北卡罗来纳州和密西根州的项目,凸显了工业UPS、电网服务和电信应用领域的早期应用。北美受益于强大的供应商生态系统,而加拿大则利用其国内材料资源和地理优势。
钠离子电池化学品市场的主要参与者包括TIAMAT SAS、海纳电池科技有限公司、Altris AB、宁德时代(CATL)、法拉第(Reliance旗下)等。各公司致力于推动正负极化学技术的进步,以提高能量密度和循环寿命,力求使钠离子电池在移动出行领域得到广泛应用。与电网营运商和工业终端用户的策略合作有助于确保可预测的需求并加速市场普及。各公司大力投资研发,以改进电解液配方和安全添加剂,进而实现产品差异化。扩大产能和在地化生产有助于降低供应链风险并缩短产品上市时间。各公司利用政府激励措施和资助计画来加速商业化和试点计画。与学术机构和材料供应商的合作也为创新提供了支持。此外,行销工作着重强调安全性、永续性和成本优势,以加强品牌定位,并在电网、工业和细分行动移动领域建立客户信任。
目录
第一章:方法论
- 市场范围和定义
- 研究设计
- 研究方法
- 资料收集方法
- 资料探勘来源
- 全球的
- 地区/国家
- 基准估算和计算
- 基准年计算
- 市场估算的关键趋势
- 初步研究和验证
- 原始资料
- 预测模型
- 研究假设和局限性
第二章:执行概要
第三章:行业洞察
- 产业生态系分析
- 供应商格局
- 利润率
- 每个阶段的价值增加
- 影响价值链的因素
- 中断
- 产业影响因素
- 成长驱动因素
- 产业陷阱与挑战
- 供应链的复杂性
- 市场机会
- 成长潜力分析
- 监管环境
- 北美洲
- 欧洲
- 亚太地区
- 拉丁美洲
- 中东和非洲
- 波特的分析
- PESTEL 分析
- 价格趋势
- 按地区
- 活性物质
- 未来市场趋势
- 技术与创新格局
- 当前技术趋势
- 新兴技术
- 专利格局
- 贸易统计(註:仅提供重点国家的贸易统计)
- 主要进口国
- 主要出口国
- 永续性和环境方面
- 永续实践
- 减少废弃物策略
- 生产中的能源效率
- 环保倡议
- 碳足迹考量
第四章:竞争格局
- 介绍
- 公司市占率分析
- 按地区
- 北美洲
- 欧洲
- 亚太地区
- 拉丁美洲
- MEA
- 按地区
- 公司矩阵分析
- 主要市场参与者的竞争分析
- 竞争定位矩阵
- 关键进展
- 併购
- 合作伙伴关係与合作
- 新产品发布
- 扩张计划
第五章:市场估算与预测:依活性成分类型划分,2021-2034年
- 主要趋势
- 阴极活性材料
- 层状过渡金属氧化物(TMLO)
- NASICON型材料
- 普鲁士蓝类似物(PBA)
- 多阴离子化合物
- 阳极活性材料
- 硬碳材料
- 生物质衍生硬碳
- 石油焦衍生的硬碳
- 合成硬碳
- 钛基负极材料
- 新兴阳极材料
- 其他的
第六章:市场估算与预测:依辅助材料划分,2021-2034年
- 主要趋势
- 电解质材料
- 钠盐
- 高氯酸钠(NaClO4)
- 高级钠盐
- 有机溶剂
- 碳酸酯溶剂(EC、DMC、PC、EMC)
- 替代溶剂体系
- 电解质添加剂
- 成膜助剂(FEC、VC)
- 专业性能添加剂
- 黏合剂材料
- 羧甲基纤维素钠(Na-CMC)
- 聚偏二氟乙烯(PVDF)
- 替代黏合剂系统
- 导电添加剂
- 炭黑
- 先进导电材料
- 其他材料
第七章:市场估计与预测:依应用领域划分,2021-2034年
- 主要趋势
- 电网级储能应用
- 公用事业规模储能係统(>10兆瓦)
- 再生能源併网系统
- 电动车快速充电基础设施
- 交通运输应用
- 电动汽车系统
- 特种运输
- 工业和商业应用
- 资料中心UPS系统
- 工业备用电源
- 电信基础设施
- 其他应用
第八章:市场估算与预测:依地区划分,2021-2034年
- 主要趋势
- 北美洲
- 我们
- 加拿大
- 欧洲
- 德国
- 英国
- 法国
- 义大利
- 西班牙
- 欧洲其他地区
- 亚太地区
- 中国
- 印度
- 日本
- 澳洲
- 韩国
- 亚太其他地区
- 拉丁美洲
- 巴西
- 墨西哥
- 阿根廷
- 拉丁美洲其他地区
- 中东和非洲
- 沙乌地阿拉伯
- 南非
- 阿联酋
- 中东和非洲其他地区
第九章:公司简介
- Contemporary Amperex Technology Co., Limited (CATL)
- HiNa Battery Technology Co., Ltd.
- Faradion Limited (acquired by Reliance Industries)
- TIAMAT SAS
- Altris AB
- Kuraray Co., Ltd.
- Sumitomo Bakelite Co., Ltd.
- BTR New Material Group Co., Ltd.
- Shengquan Group Co., Ltd.
- Kureha Corporation
- Tinci Materials Technology Co., Ltd.
- DFD New Energy Materials Co., Ltd.
- CAPCHEM Technology Co., Ltd.
- YONGTA Chemical Technology Co., Ltd.
- RTXC New Energy Technology Co., Ltd.
- NGK Insulators, Ltd.
- AMTE Power plc
- MSE Supplies LLC
- MTI
- XTL Corporation
- NATRIUM Energy Technology Co., Ltd.
The Global Sodium-Ion Battery Chemicals Market was valued at USD 150 million in 2024 and is estimated to grow at a CAGR of 55% to reach USD 8.5 Billion by 2034.
The market's rapid growth is fueled by the cost-effectiveness of sodium-ion systems, which rely on abundant, cobalt-free materials and optimized electrolyte-cathode pairings. Industrial and grid-scale users prioritize cost per kilowatt-hour, cycle life, and safety, which makes sodium-ion chemistry particularly attractive in these sectors. Mobility applications remain cautious due to volumetric energy constraints, with wider adoption expected once energy densities surpass 200 Wh/kg. Regional policies also play a key role: the EU emphasizes recyclability and end-of-life management, supporting sodium-heavy chemistries, while China's industrial strategy under the 14th Five-Year Plan accelerates domestic pilots and materials scale-up. Grid-focused adoption ensures predictable demand for upstream chemicals, particularly electrolytes and additives, while performance improvements, cost reductions, and cathode innovations strengthen the market foothold in industrial, grid, and select mobility niches.
| Market Scope | |
|---|---|
| Start Year | 2024 |
| Forecast Year | 2025-2034 |
| Start Value | $150 Million |
| Forecast Value | $8.5 Billion |
| CAGR | 55% |
The cathode active materials segment generated USD 60 million in 2024. They hold the largest value share due to their critical role in energy density and lifecycle performance, while anode materials account for roughly 30%, with the remainder in supporting chemicals and other materials. Early-generation sodium-ion cells deliver about 175 Wh/kg, with advancements in sodium vanadium phosphate and NASICON cathodes expected to push energy density above 200 Wh/kg by 2027. Cathode innovation drives the greatest Wh/kg gains, while hard carbon anodes improve first-cycle efficiency and long-term capacity retention.
The grid-scale energy storage segment held a 70% share, valued at USD 105 million in 2024. Sodium-ion batteries offer cost-efficient and thermally safe solutions for renewable energy integration and load-leveling. Additionally, they are gaining traction in low-speed electric vehicles, where affordability and safety outweigh volumetric energy density requirements.
North America Sodium-Ion Battery Chemicals Market reached USD 18 million in 2024. Federal funding for R&D and commercialization, along with private capital investment targeting industrial and data center applications, are key growth drivers. Initiatives by U.S. government agencies funnel substantial resources into scaling alternative chemistries. Manufacturing projects, particularly in North Carolina and Michigan, highlight early adoption in industrial UPS, grid services, and telecom applications. North America benefits from a strong supplier ecosystem, while Canada leverages its domestic materials base and geographic advantages.
Key players in the Sodium-Ion Battery Chemicals Market include TIAMAT SAS, HiNa Battery Technology Co., Ltd., Altris AB, Contemporary Amperex Technology Co., Limited (CATL), Faradion (Reliance), and others. Companies are focusing on advancing cathode and anode chemistries to increase energy density and cycle life, aiming to make sodium-ion viable for mobility applications. Strategic partnerships with grid operators and industrial end-users help secure predictable demand and accelerate adoption. Firms are investing heavily in R&D to enhance electrolyte formulations and safety additives, which differentiate their offerings. Expanding manufacturing capacity and localizing production reduces supply chain risks and shortens time-to-market. Companies leverage government incentives and funding programs to accelerate commercialization and pilot projects. Collaborations with academic institutions and material suppliers support innovation. Additionally, marketing efforts emphasize safety, sustainability, and cost advantages to strengthen brand positioning and build customer trust across grid, industrial, and niche mobility segments.
Table of Contents
Chapter 1 Methodology
- 1.1 Market scope and definition
- 1.2 Research design
- 1.2.1 Research approach
- 1.2.2 Data collection methods
- 1.3 Data mining sources
- 1.3.1 Global
- 1.3.2 Regional/Country
- 1.4 Base estimates and calculations
- 1.4.1 Base year calculation
- 1.4.2 Key trends for market estimation
- 1.5 Primary research and validation
- 1.5.1 Primary sources
- 1.6 Forecast model
- 1.7 Research assumptions and limitations
Chapter 2 Executive Summary
- 2.1 Industry 360° synopsis
- 2.2 Key market trends
- 2.2.1 Regional
- 2.2.2 Active Material Type
- 2.2.3 Supporting Materials
- 2.2.4 Application
- 2.3 TAM Analysis, 2025-2034
- 2.4 CXO perspectives: Strategic imperatives
- 2.4.1 Executive decision points
- 2.4.2 Critical success factors
- 2.5 Future Outlook and Strategic Recommendations
Chapter 3 Industry Insights
- 3.1 Industry ecosystem analysis
- 3.1.1 Supplier Landscape
- 3.1.2 Profit Margin
- 3.1.3 Value addition at each stage
- 3.1.4 Factor affecting the value chain
- 3.1.5 Disruptions
- 3.2 Industry impact forces
- 3.2.1 Growth drivers
- 3.2.2 Industry pitfalls and challenges
- 3.2.2.1 Supply chain complexity
- 3.2.3 Market opportunities
- 3.3 Growth potential analysis
- 3.4 Regulatory landscape
- 3.4.1 North America
- 3.4.2 Europe
- 3.4.3 Asia Pacific
- 3.4.4 Latin America
- 3.4.5 Middle East & Africa
- 3.5 Porter's analysis
- 3.6 PESTEL analysis
- 3.7 Price trends
- 3.7.1 By region
- 3.7.2 By active material
- 3.8 Future market trends
- 3.9 Technology and Innovation landscape
- 3.9.1 Current technological trends
- 3.9.2 Emerging technologies
- 3.10 Patent Landscape
- 3.11 Trade statistics (Note: the trade statistics will be provided for key countries only)
- 3.11.1 Major importing countries
- 3.11.2 Major exporting countries
- 3.12 Sustainability and Environmental Aspects
- 3.12.1 Sustainable Practices
- 3.12.2 Waste Reduction Strategies
- 3.12.3 Energy Efficiency in Production
- 3.12.4 Eco-friendly Initiatives
- 3.13 Carbon Footprint Considerations
Chapter 4 Competitive Landscape, 2024
- 4.1 Introduction
- 4.2 Company market share analysis
- 4.2.1 By region
- 4.2.1.1 North America
- 4.2.1.2 Europe
- 4.2.1.3 Asia Pacific
- 4.2.1.4 LATAM
- 4.2.1.5 MEA
- 4.2.1 By region
- 4.3 Company matrix analysis
- 4.4 Competitive analysis of major market players
- 4.5 Competitive positioning matrix
- 4.6 Key developments
- 4.6.1 Mergers & acquisitions
- 4.6.2 Partnerships & collaborations
- 4.6.3 New Product Launches
- 4.6.4 Expansion Plans
Chapter 5 Market Estimates and Forecast, By Active Material Type, 2021- 2034 (USD Million, Kilo Tons)
- 5.1 Key trends
- 5.2 Cathode active materials
- 5.2.1 Layered transition metal oxides (TMLO)
- 5.2.2 NASICON-type materials
- 5.2.3 Prussian blue analogues (PBAs)
- 5.2.4 Polyanionic compounds
- 5.3 Anode active materials
- 5.3.1 Hard carbon materials
- 5.3.2 Biomass-derived hard carbon
- 5.3.3 Petroleum coke-derived hard carbon
- 5.3.4 Synthetic hard carbon
- 5.3.5 Titanium-based anode materials
- 5.3.6 Emerging anode materials
- 5.4 Others
Chapter 6 Market Estimates and Forecast, By Supporting Materials, 2021- 2034 (USD Million, Kilo Tons)
- 6.1 Key trends
- 6.2 Electrolyte materials
- 6.2.1 Sodium salts
- 6.2.2 Sodium perchlorate (NaClO4)
- 6.2.3 Advanced sodium salts
- 6.3 Organic solvents
- 6.3.1 Carbonate solvents (EC, DMC, PC, EMC)
- 6.3.2 Alternative solvent systems
- 6.4 Electrolyte additives
- 6.4.1 Film-forming additives (FEC, VC)
- 6.4.2 Specialized performance additives
- 6.5 Binder materials
- 6.5.1 Sodium carboxymethyl cellulose (Na-CMC)
- 6.5.2 Polyvinylidene fluoride (PVDF)
- 6.5.3 Alternative binder systems
- 6.6 Conductive additives
- 6.6.1 Carbon black
- 6.6.2 Advanced conductive materials
- 6.7 Other materials
Chapter 7 Market Estimates and Forecast, By Application, 2021 - 2034 (USD Million, Kilo Tons)
- 7.1 Key trends
- 7.2 Grid-scale energy storage applications
- 7.2.1 Utility-scale storage systems (>10 MW)
- 7.2.2 Renewable energy integration systems
- 7.2.3 EV fast charging infrastructure
- 7.3 Transportation applications
- 7.3.1 Electric vehicle systems
- 7.3.2 Specialized transportation
- 7.4 Industrial & commercial applications
- 7.4.1 Data center UPS systems
- 7.4.2 Industrial backup power
- 7.4.3 Telecommunications infrastructure
- 7.5 Other applications
Chapter 8 Market Estimates and Forecast, By Region, 2021 - 2034 (USD Million, Kilo Tons)
- 8.1 Key trends
- 8.2 North America
- 8.2.1 U.S.
- 8.2.2 Canada
- 8.3 Europe
- 8.3.1 Germany
- 8.3.2 UK
- 8.3.3 France
- 8.3.4 Italy
- 8.3.5 Spain
- 8.3.6 Rest of Europe
- 8.4 Asia Pacific
- 8.4.1 China
- 8.4.2 India
- 8.4.3 Japan
- 8.4.4 Australia
- 8.4.5 South Korea
- 8.4.6 Rest of Asia Pacific
- 8.5 Latin America
- 8.5.1 Brazil
- 8.5.2 Mexico
- 8.5.3 Argentina
- 8.5.4 Rest of Latin America
- 8.6 Middle East & Africa
- 8.6.1 Saudi Arabia
- 8.6.2 South Africa
- 8.6.3 UAE
- 8.6.4 Rest of Middle East & Africa
Chapter 9 Company Profiles
- 9.1 Contemporary Amperex Technology Co., Limited (CATL)
- 9.2 HiNa Battery Technology Co., Ltd.
- 9.3 Faradion Limited (acquired by Reliance Industries)
- 9.4 TIAMAT SAS
- 9.5 Altris AB
- 9.6 Kuraray Co., Ltd.
- 9.7 Sumitomo Bakelite Co., Ltd.
- 9.8 BTR New Material Group Co., Ltd.
- 9.9 Shengquan Group Co., Ltd.
- 9.10 Kureha Corporation
- 9.11 Tinci Materials Technology Co., Ltd.
- 9.12 DFD New Energy Materials Co., Ltd.
- 9.13 CAPCHEM Technology Co., Ltd.
- 9.14 YONGTA Chemical Technology Co., Ltd.
- 9.15 RTXC New Energy Technology Co., Ltd.
- 9.16 NGK Insulators, Ltd.
- 9.17 AMTE Power plc
- 9.18 MSE Supplies LLC
- 9.19 MTI
- 9.20 XTL Corporation
- 9.21 NATRIUM Energy Technology Co., Ltd.
 突破性创新推动钠离子电池的商业化
 全球钠离子电池市场预测(至2034年):按电池类型、技术类型、组件、形状、应用和地区划分
 日本钠离子电池市场规模、份额、趋势和预测:按类型、应用和地区划分,2026-2034年钠离子电池市场规模、份额、趋势及预测(按类型、应用和地区划分,2026-2034年)
 2026年全球钠离子电池市场报告钠离子电池市场规模、占有率、成长、全球产业分析:依类型、应用、区域洞察和预测(2026-2034 年)钠离子电池市场-2026-2031年预测钠离子电池及替代电池材料市场预测至2032年:全球材料类型、电池化学、性能特征、技术、应用、最终用户及地区分析
 钠离子电池市场规模、份额和成长分析(按电池类型、技术、应用、最终用户和地区划分)—2026-2033年产业预测
 钠离子电池材料市场机会、成长驱动因素、产业趋势分析及预测(2025-2034年)