


 |
市场调查报告书
商品编码
1876529
汽车品质检测人工智慧系统市场机会、成长驱动因素、产业趋势分析及预测(2025-2034年)Automotive Quality Inspection AI System Market Opportunity, Growth Drivers, Industry Trend Analysis, and Forecast 2025 - 2034 |
||||||
2024 年全球汽车品质检测人工智慧系统市值为 4.653 亿美元,预计到 2034 年将以 19.6% 的复合年增长率成长至 26.4 亿美元。
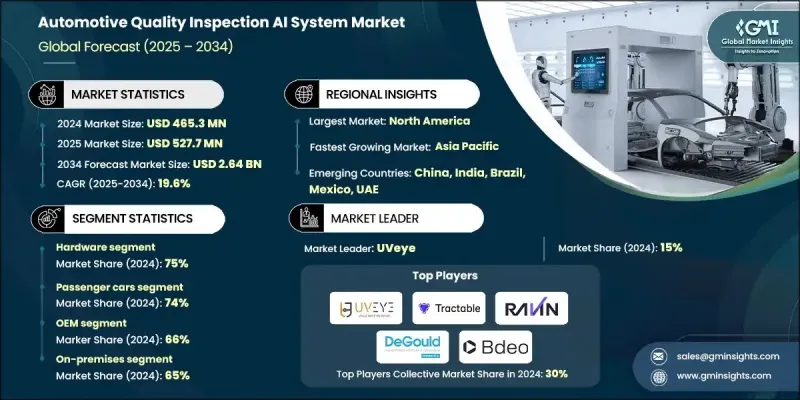
汽车製造商正越来越多地采用人工智慧驱动的检测系统,以实现零缺陷生产标准。这些技术能够在製造的早期阶段检测出缺陷,从而确保产品的一致性和品质。自动化技术的应用减少了人为错误,提高了流程可靠性,并有助于生产无需返工或无缺陷的车辆。各地监管压力促使製造商遵守严格的安全和品质标准,而人工智慧系统能够对关键部件进行即时检测,从而最大限度地降低召回风险。这些解决方案还能提高生产效率,使製造商能够持续监控组装线,即时识别缺陷,并迅速做出明智的决策,从而确保大批量生产的产品品质始终保持稳定可靠。
| 市场范围 | |
|---|---|
| 起始年份 | 2024 |
| 预测年份 | 2025-2034 |
| 起始值 | 4.653亿美元 |
| 预测值 | 26.4亿美元 |
| 复合年增长率 | 19.6% |
预计到2024年,硬体领域将占据75%的市场份额,这主要得益于市场对人工智慧相机、感测器和成像设备的需求,这些设备能够实现精准的缺陷检测和即时製程监控。先进的高解析度相机、3D感测器和光达系统在生产线上的应用日益广泛,显着提升了精度和监控能力。具备边缘运算功能的人工智慧硬体也越来越受欢迎,它能够提供更强大的资料处理能力、更低的延迟以及更快的决策速度,且无需依赖集中式伺服器。
预计到2024年,乘用车市场将占据74%的市场份额,这反映出全球强劲的需求以及生产线上人工智慧检测技术的应用,从而确保产品完美无瑕。人工智慧技术有助于管理复杂的组装流程,例如精密的电子整合和先进的车身製造,它可以检测细微缺陷、减少人为错误、验证品质控制流程,并在降低成本高昂的召回风险的同时,提升客户满意度。
2024年,美国汽车品质检测人工智慧系统市场规模达1.565亿美元。美国拥有成熟的汽车製造业,先进的机器人技术、整合智慧工厂以及广泛的人工智慧驱动的品质检测部署,使得装配线上的即时缺陷检测、预测性维护和流程优化成为可能。
全球汽车品质检测人工智慧系统市场的主要企业包括 Monk.AI、Tractable、UVeye、Bdeo、Ravin.AI、Pave AI、Inspektlabs、Claim Genius、WeProov 和 DeGould。这些企业正采取多种策略来巩固自身地位并扩大市场占有率。他们加大研发投入,开发新一代人工智慧演算法和感测器技术,以提高缺陷侦测的准确性。与原始设备製造商 (OEM)、机器人整合商和智慧工厂供应商建立策略合作伙伴关係,拓展了部署机会。企业利用边缘运算和云端人工智慧平台来增强即时资料处理和预测分析能力。併购则用于拓展技术组合和全球影响力。此外,企业也重视客户支援、培训专案和客製化解决方案,以建立信任、确保产品应用,并与製造商建立长期策略合作关係,从而巩固自身的竞争优势。
目录
第一章:方法论
- 市场范围和定义
- 研究设计
- 研究方法
- 资料收集方法
- 资料探勘来源
- 全球的
- 地区/国家
- 基准估算和计算
- 基准年计算
- 市场估算的关键趋势
- 初步研究和验证
- 原始资料
- 预测模型
- 研究假设和局限性
第二章:执行概要
第三章:行业洞察
- 产业生态系分析
- 供应商格局
- 利润率
- 成本结构
- 每个阶段的价值增加
- 影响价值链的因素
- 中断
- 产业影响因素
- 成长驱动因素
- 对零缺陷製造的需求不断增长
- 严格的安全和监管标准
- 需要即时品质保证
- 成本和时间优化
- 产业陷阱与挑战
- 初始实施成本高
- 资料品质和模型训练限制
- 市场机会
- 不断增长的电动车製造基地
- 发展中市场的扩张
- 基于云端的AI检测平台
- 跨产业应用
- 成长驱动因素
- 成长潜力分析
- 监管环境
- 全球的
- 人工智慧系统安全架构要求
- 资料隐私法规合规性(GDPR、CCPA)
- 工业网路安全标准(ISO/SAE 21434)
- 威胁建模与风险评估
- 北美洲
- 欧洲
- 亚太地区
- 拉丁美洲
- 中东和非洲
- 全球的
- 波特的分析
- PESTEL 分析
- 技术与创新格局
- 当前技术趋势
- 新兴技术
- 价格趋势
- 按地区
- 副产品
- 生产统计
- 生产中心
- 消费中心
- 进出口
- 成本細項分析
- 总拥有成本 (TCO) 计算
- 实施成本細項分析
- 营运节省量化
- 品质改善的财务影响
- 专利分析
- 永续性和环境方面
- 永续实践
- 减少废弃物策略
- 生产中的能源效率
- 环保倡议
- 碳足迹考量
- 可扩充性和多站点部署
- 全球製造网路需求
- 集中式与分散式人工智慧模型管理
- 跨工厂性能标准化
- 区域合规性和本地化需求
- 即时效能和延迟优化
- 生产线速度需求分析
- 边缘运算架构设计
- 网路基础设施与5G集成
- 硬体加速与GPU利用率
- 模型可解释性和审计追踪
- 监理合规文件要求
- 人工智慧决策的透明度和可解释性
- 审计追踪生成与管理
- 品质保证可追溯系统
- 数据品质和模型漂移管理
- 训练资料品质保证
- 持续模型性能监测
- 模型重训练与更新策略
- 数据漂移检测与缓解
- 边缘云混合架构设计
- 供应商风险管理与供应链韧性
- 绩效标竿管理与KPI管理
- 预测分析与预防措施
- 灾难復原与业务连续性
第四章:竞争格局
- 介绍
- 公司市占率分析
- 北美洲
- 欧洲
- 亚太地区
- 拉丁美洲
- MEA
- 主要市场参与者的竞争分析
- 竞争定位矩阵
- 战略展望矩阵
- 关键进展
- 併购
- 合作伙伴关係与合作
- 新产品发布
- 扩张计划和资金
- 策略倡议分析
- 供应商选择标准
- 技术差异化战略
第五章:市场估算与预测:依组件划分,2021-2034年
- 主要趋势
- 硬体
- 人工智慧相机和成像设备
- 感测器和检测单元
- 机器人及自动化设备
- 照明和计算系统
- 软体
- 电脑视觉与影像软体
- 机器学习/人工智慧模型
- 数据分析与报告平台
- 整合与监控软体
第六章:市场估价与预测:依车辆类型划分,2021-2034年
- 主要趋势
- 搭乘用车
- 轿车
- SUV
- 掀背车
- 商用车辆
- 轻型商用车
- 中型商用车 (MCV)
- 重型商用车 (HCV)
第七章:市场估计与预测:依应用领域划分,2021-2034年
- 主要趋势
- 车身及油漆检查
- 引擎及动力系统检查
- 电子元件侦测
- 装配线监控
第八章:市场估算与预测:依最终用途划分,2021-2034年
- 主要趋势
- OEM
- 一级供应商
第九章:市场估算与预测:依部署模式划分,2021-2034年
- 主要趋势
- 现场
- 基于云端的
第十章:市场估计与预测:依地区划分,2021-2034年
- 主要趋势
- 北美洲
- 我们
- 加拿大
- 欧洲
- 德国
- 英国
- 法国
- 义大利
- 西班牙
- 北欧
- 俄罗斯
- 波兰
- 亚太地区
- 中国
- 印度
- 日本
- 韩国
- 澳新银行
- 越南
- 泰国
- 拉丁美洲
- 巴西
- 墨西哥
- 阿根廷
- MEA
- 南非
- 沙乌地阿拉伯
- 阿联酋
第十一章:公司简介
- Global companies
- Bdeo
- Cognex
- DeGould
- Inspektlabs
- Keyence
- Monk.AI
- Omron
- Pave AI
- Ravin.AI
- SICK
- Tractable
- UVeye
- WeProov
- Regional companies
- Dataspan
- Isra Vision (Atlas Copco)
- Robovis
- SECO
- Claim Genius
- Emerging companies
- Axelera AI
- Cincoze
- Datagon AI
- Datasensing
- NXP Semiconductor (AI Solutions)
- Plex by Rockwell Automation
- Robovision
- SinceVision
The Global Automotive Quality Inspection AI System Market was valued at USD 465.3 million in 2024 and is estimated to grow at a CAGR of 19.6% to reach USD 2.64 billion by 2034.
Automakers are increasingly adopting AI-driven inspection systems to achieve zero-defect production standards. These technologies detect defects at the earliest stages of manufacturing, ensuring product consistency and quality. The adoption of automation reduces human error, increases process reliability, and supports the production of vehicles free from rework or defects. Regulatory pressure across regions is pushing manufacturers to comply with stringent safety and quality standards, and AI systems provide real-time inspection of critical components to minimize recall risks. These solutions also enhance production efficiency, allowing manufacturers to monitor assembly lines continuously, identify flaws instantly, and make prompt, informed decisions, ensuring that high-volume manufacturing outputs remain uniform and reliable.
| Market Scope | |
|---|---|
| Start Year | 2024 |
| Forecast Year | 2025-2034 |
| Start Value | $465.3 Million |
| Forecast Value | $2.64 Billion |
| CAGR | 19.6% |
In 2024, the hardware segment held a 75% share, driven by demand for AI-enabled cameras, sensors, and imaging devices that enable precise defect detection and real-time process monitoring. Advanced high-resolution cameras, 3D sensors, and LiDAR systems are increasingly used in production lines, improving accuracy and monitoring capabilities. AI hardware with edge computing is becoming popular, offering enhanced data processing, lower latency, and faster decision-making independent of centralized servers.
The passenger car segment held a 74% share in 2024, reflecting strong global demand and the adoption of AI-based inspection in production lines to ensure flawless manufacturing. AI technologies help manage complex assembly processes, such as sophisticated electronics integration and advanced bodywork, detecting minor defects, reducing human error, validating quality control processes, and enhancing customer satisfaction while mitigating costly recalls.
U.S. Automotive Quality Inspection AI System Market generated USD 156.5 million in 2024. The country benefits from a mature automotive manufacturing sector with advanced robotics, integrated smart factories, and extensive AI-driven quality inspection deployments that enable real-time defect detection, predictive maintenance, and process optimization across assembly lines.
Leading companies in the Global Automotive Quality Inspection AI System Market include Monk.AI, Tractable, UVeye, Bdeo, Ravin.AI, Pave AI, Inspektlabs, Claim Genius, WeProov, and DeGould. Companies in the Global Automotive Quality Inspection AI System Market are adopting several strategies to strengthen their presence and expand market share. They are investing in R&D to develop next-generation AI algorithms and sensor technologies for higher defect detection accuracy. Strategic partnerships with OEMs, robotics integrators, and smart factory providers expand deployment opportunities. Firms are leveraging edge computing and cloud-based AI platforms to enhance real-time data processing and predictive analytics. Mergers and acquisitions are used to broaden technology portfolios and global reach. Additionally, companies emphasize customer support, training programs, and tailored solutions to build trust, ensure adoption, and create long-term strategic relationships with manufacturers, solidifying their competitive positioning.
Table of Contents
Chapter 1 Methodology
- 1.1 Market scope and definition
- 1.2 Research design
- 1.2.1 Research approach
- 1.2.2 Data collection methods
- 1.3 Data mining sources
- 1.3.1 Global
- 1.3.2 Regional/Country
- 1.4 Base estimates and calculations
- 1.4.1 Base year calculation
- 1.4.2 Key trends for market estimation
- 1.5 Primary research and validation
- 1.5.1 Primary sources
- 1.6 Forecast model
- 1.7 Research assumptions and limitations
Chapter 2 Executive Summary
- 2.1 Industry 360° synopsis
- 2.2 Key market trends
- 2.2.1 Regional
- 2.2.2 Component
- 2.2.3 Vehicle
- 2.2.4 Application
- 2.2.5 End Use
- 2.2.6 Deployment mode
- 2.3 TAM analysis, 2025-2034
- 2.4 CXO perspectives: Strategic imperatives
- 2.4.1 Executive decision points
- 2.4.2 Critical success factors
- 2.5 Future outlook and recommendations
Chapter 3 Industry Insights
- 3.1 Industry ecosystem analysis
- 3.1.1 Supplier landscape
- 3.1.2 Profit margin
- 3.1.3 Cost structure
- 3.1.4 Value addition at each stage
- 3.1.5 Factor affecting the value chain
- 3.1.6 Disruptions
- 3.2 Industry impact forces
- 3.2.1 Growth drivers
- 3.2.1.1 Rising demand for zero-defect manufacturing
- 3.2.1.2 Stringent safety and regulatory standards
- 3.2.1.3 Need for real-time quality assurance
- 3.2.1.4 Cost and time optimization
- 3.2.2 Industry pitfalls and challenges
- 3.2.2.1 High initial implementation cost
- 3.2.2.2 Data quality and model training limitations
- 3.2.3 Market opportunities
- 3.2.3.1 Growing EV manufacturing base
- 3.2.3.2 Expansion in developing markets
- 3.2.3.3 Cloud-based AI inspection platforms
- 3.2.3.4 Cross-industry applications
- 3.2.1 Growth drivers
- 3.3 Growth potential analysis
- 3.4 Regulatory landscape
- 3.4.1 Global
- 3.4.1.1 AI system security architecture requirements
- 3.4.1.2 Data privacy regulations compliance (GDPR, CCPA)
- 3.4.1.3 Industrial cybersecurity standards (ISO/SAE 21434)
- 3.4.1.4 Threat modeling & risk assessment
- 3.4.2 North America
- 3.4.3 Europe
- 3.4.4 Asia Pacific
- 3.4.5 Latin America
- 3.4.6 Middle East & Africa
- 3.4.1 Global
- 3.5 Porter's analysis
- 3.6 PESTEL analysis
- 3.7 Technology and innovation landscape
- 3.7.1 Current technological trends
- 3.7.2 Emerging technologies
- 3.8 Price trends
- 3.8.1 By region
- 3.8.2 By product
- 3.9 Production statistics
- 3.9.1 Production hubs
- 3.9.2 Consumption hubs
- 3.9.3 Export and import
- 3.10 Cost breakdown analysis
- 3.10.1 Total cost of ownership (TCO) calculations
- 3.10.2 Implementation cost breakdown analysis
- 3.10.3 Operational savings quantification
- 3.10.4 Quality improvement financial impact
- 3.11 Patent analysis
- 3.12 Sustainability and environmental aspects
- 3.12.1 Sustainable practices
- 3.12.2 Waste reduction strategies
- 3.12.3 Energy efficiency in production
- 3.12.4 Eco-friendly initiatives
- 3.13 Carbon footprint considerations
- 3.14 Scalability & multi-site deployment
- 3.14.1 Global manufacturing network requirements
- 3.14.2 Centralized vs. Distributed AI model management
- 3.14.3 Cross-plant performance standardization
- 3.14.4 Regional compliance & localization needs
- 3.15 Real-time performance & latency optimization
- 3.15.1 Production line speed requirements analysis
- 3.15.2 Edge computing architecture design
- 3.15.3. Network infrastructure & 5 G integration
- 3.15.4 Hardware acceleration & GPU utilization
- 3.16 Model explainability & audit trails
- 3.16.1 Regulatory compliance documentation requirements
- 3.16.2 Ai decision transparency & interpretability
- 3.16.3 Audit trail generation & management
- 3.16.4 Quality assurance traceability systems
- 3.17 Data quality & model drift management
- 3.17.1 Training data quality assurance
- 3.17.2 Continuous model performance monitoring
- 3.17.3 Model retraining & update strategies
- 3.17.4 Data drift detection & mitigation
- 3.18 Edge-cloud hybrid architecture design
- 3.19 Vendor risk management & supply chain resilience
- 3.20 Performance benchmarking & KPI management
- 3.21 Predictive analytics & preventive actions
- 3.22 Disaster recovery & business continuity
Chapter 4 Competitive Landscape, 2024
- 4.1 Introduction
- 4.2 Company market share analysis
- 4.2.1 North America
- 4.2.2 Europe
- 4.2.3 Asia Pacific
- 4.2.4 LATAM
- 4.2.5 MEA
- 4.3 Competitive analysis of major market players
- 4.4 Competitive positioning matrix
- 4.5 Strategic outlook matrix
- 4.6 Key developments
- 4.6.1 Mergers & acquisitions
- 4.6.2 Partnerships & collaborations
- 4.6.3 New product launches
- 4.6.4 Expansion plans and funding
- 4.7 Strategic initiatives analysis
- 4.8 Vendor selection criteria
- 4.9 Technology differentiation strategies
Chapter 5 Market Estimates & Forecast, By Component, 2021 - 2034 ($Mn, Units)
- 5.1 Key trends
- 5.2 Hardware
- 5.2.1 AI cameras & imaging devices
- 5.2.2 Sensors & detection units
- 5.2.3 Robotics & automation equipment
- 5.2.4 Lighting & computing systems
- 5.3 Software
- 5.3.1 Computer vision & imaging software
- 5.3.2 Machine learning / AI models
- 5.3.3 Data analytics & reporting platforms
- 5.3.4 Integration & monitoring software
Chapter 6 Market Estimates & Forecast, By Vehicle, 2021 - 2034 ($Mn, Units)
- 6.1 Key trends
- 6.2 Passenger cars
- 6.2.1 Sedan
- 6.2.2 SUV
- 6.2.3 Hatchback
- 6.3 Commercial vehicles
- 6.3.1 LCV (Light commercial vehicles)
- 6.3.2 MCV (Medium commercial vehicles)
- 6.3.3 HCV (Heavy commercial vehicles)
Chapter 7 Market Estimates & Forecast, By Application, 2021 - 2034 ($Mn, Units)
- 7.1 Key trends
- 7.2 Body & paint inspection
- 7.3 Engine & powertrain inspection
- 7.4 Electronics & component inspection
- 7.5 Assembly line monitoring
Chapter 8 Market Estimates & Forecast, By End Use, 2021 - 2034 ($Mn, Units)
- 8.1 Key trends
- 8.2 OEM
- 8.3 Tier-1 suppliers
Chapter 9 Market Estimates & Forecast, By Deployment Mode, 2021 - 2034 ($Mn, Units)
- 9.1 Key trends
- 9.2 On-premises
- 9.3 Cloud-based
Chapter 10 Market Estimates & Forecast, By Region, 2021 - 2034 ($Mn, Units)
- 10.1 Key trends
- 10.2 North America
- 10.2.1 US
- 10.2.2 Canada
- 10.3 Europe
- 10.3.1 Germany
- 10.3.2 UK
- 10.3.3 France
- 10.3.4 Italy
- 10.3.5 Spain
- 10.3.6 Nordics
- 10.3.7 Russia
- 10.3.8 Poland
- 10.4 Asia Pacific
- 10.4.1 China
- 10.4.2 India
- 10.4.3 Japan
- 10.4.4 South Korea
- 10.4.5 ANZ
- 10.4.6 Vietnam
- 10.4.7 Thailand
- 10.5 Latin America
- 10.5.1 Brazil
- 10.5.2 Mexico
- 10.5.3 Argentina
- 10.6 MEA
- 10.6.1 South Africa
- 10.6.2 Saudi Arabia
- 10.6.3 UAE
Chapter 11 Company Profiles
- 11.1 Global companies
- 11.1.1 Bdeo
- 11.1.2 Cognex
- 11.1.3 DeGould
- 11.1.4 Inspektlabs
- 11.1.5 Keyence
- 11.1.6 Monk.AI
- 11.1.7 Omron
- 11.1.8 Pave AI
- 11.1.9 Ravin.AI
- 11.1.10 SICK
- 11.1.11 Tractable
- 11.1.12 UVeye
- 11.1.13 WeProov
- 11.2 Regional companies
- 11.2.1 Dataspan
- 11.2.2 Isra Vision (Atlas Copco)
- 11.2.3 Robovis
- 11.2.4 SECO
- 11.2.5 Claim Genius
- 11.3 Emerging companies
- 11.3.1 Axelera AI
- 11.3.2 Cincoze
- 11.3.3 Datagon AI
- 11.3.4 Datasensing
- 11.3.5 NXP Semiconductor (AI Solutions)
- 11.3.6 Plex by Rockwell Automation
- 11.3.7 Robovision
- 11.3.8 SinceVision
 2026年全球汽车测试、检验和认证市场报告
 电动车测试、检验和认证市场:按服务类型、动力部件、测试等级和车辆类别划分-2026-2032年全球市场预测
 汽车TIC市场:全球产业分析、市场规模、市场份额及按服务、采购方式、应用、车辆类型、国家及地区分類的预测(2026年至2033年)全球静电消除用电离棒市场:按产品类型、安装方式、材料、技术、终端用户产业和分销管道分類的预测(2026-2032年)
 汽车认证服务市场 - 全球产业规模、份额、趋势、机会及预测(按类型、车辆类型、应用、地区和竞争格局划分,2021-2031年)汽车电磁相容性测试和认证服务市场(按零件类型、动力传动系统、服务类型、车辆类型和最终用户划分)—2026-2032年全球预测
 汽车TIC市场规模、份额和成长分析(按车辆类型、服务类型、采购类型、供应链服务、应用和地区划分)-产业预测(2026-2033年)
 汽车资讯通信技术服务市场机会、成长驱动因素、产业趋势分析及预测(2025-2034年)
 汽车和医疗设备静电清洗设备:全球市场份额和排名、总收入和需求预测(2025-2031年)汽车测试、检验和认证 (TIC) - 全球市场份额和排名、总收入和需求预测 2025-2031 年