


 |
市场调查报告书
商品编码
1885909
车辆即服务市场机会、成长驱动因素、产业趋势分析及预测(2025-2034年)Vehicle as a Service Market Opportunity, Growth Drivers, Industry Trend Analysis, and Forecast 2025 - 2034 |
||||||
2024 年全球汽车即服务市场价值为 105 亿美元,预计到 2034 年将以 20.7% 的复合年增长率增长至 773 亿美元。
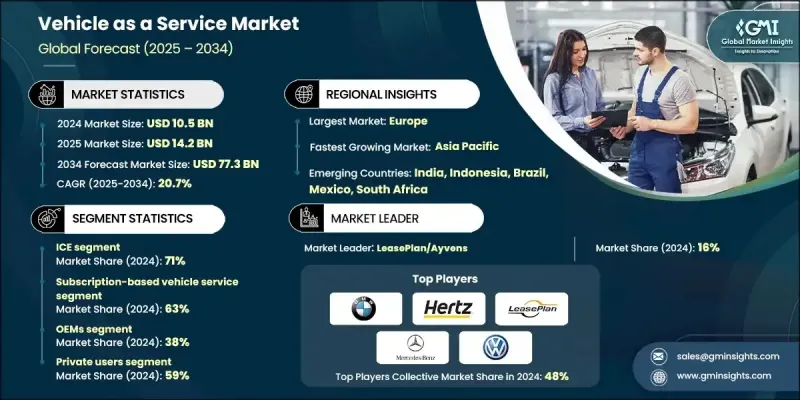
消费者和企业越来越重视车辆的使用,同时又不希望承担车辆所有权的负担,例如长期合约、保险、维护和高昂的购买成本。订阅和按需付费模式透过提供灵活的按需出行解决方案,满足了这些需求。城市化进程加快、科技普及以及数位平台的日益融合,正在推动车辆即服务(VaaS)的普及,尤其是在大都市地区。全球对电动车(EV)的大力推广进一步加速了VaaS的成长,因为电动车队具有营运成本更低、环境效益更佳以及潜在的政府激励措施等优势。企业也正在利用车队即服务(Fleet-as-a-Service)模式来降低营运复杂性并避免资本支出,从而获得车辆使用权,同时将维修、保险和车队管理外包出去。随着城市出行方式的演变,VaaS正逐渐成为提高成本效益、实现永续性和便利性的策略工具。
| 市场范围 | |
|---|---|
| 起始年份 | 2024 |
| 预测年份 | 2025-2034 |
| 起始值 | 105亿美元 |
| 预测值 | 773亿美元 |
| 复合年增长率 | 20.7% |
2024年,基于订阅的车辆服务市场占据63%的市场份额,预计到2034年将以20.2%的复合年增长率成长。订阅模式提供灵活、捆绑式且无需长期合约的车辆使用权,对消费者和企业都极具吸引力。按次付费服务则是针对偶尔用车的用户,提供由需求演算法最佳化的单次行程定价。如今,整合出行平台将车辆即服务(VaaS)与公共交通和微出行解决方案相结合,实现了无缝的多模式规划和统一支付。
预计到2024年,汽车OEM厂商将占据38%的市场份额,并预计在2034年之前以20.1%的复合年增长率成长。 OEM厂商正利用品牌信任度、经销商网路和车辆供应优势推出出行服务。汽车科技平台则透过数位化优先的解决方案、简化车辆取得流程和提升客户体验来推动成长。
预计2024年,美国车辆即服务市场规模将达27.4亿美元。消费者对无车出行方式的需求日益增长,推动了订阅和按需付费模式的发展。这些模式降低了车辆使用门槛,提供了更灵活的车型选择,优化了车队利用率,同时为服务提供者带来持续收入并提升了客户参与度。
车辆即服务 (VaaS) 市场的主要参与者包括宝马、现代、梅赛德斯-奔驰、大众、Sixt、赫兹、LeasePlan/Ayvens 和 Care by Volvo。为了巩固自身地位,VaaS 市场的企业正致力于拓展订阅和按次付费服务,将电动车整合到车队中,并利用数位化平台打造无缝的客户体验。他们正与汽车製造商、科技公司和旅游服务提供者建立策略联盟,以扩大营运规模并提升服务覆盖范围。车队优化、预测性维护和动态定价模式的运用旨在实现利润最大化,而对电动车基础设施和永续发展项目的投资则巩固了其长期成长。此外,企业也透过精准行销活动、会员忠诚度计画和个人化服务选项来吸引和留住客户,从而确保更稳固的市场地位和竞争优势。
目录
第一章:方法论
- 市场范围和定义
- 研究设计
- 研究方法
- 资料收集方法
- 资料探勘来源
- 全球的
- 地区/国家
- 基准估算和计算
- 基准年计算
- 市场估算的关键趋势
- 初步研究和验证
- 原始资料
- 预测模型
- 研究假设和局限性
第二章:执行概要
第三章:行业洞察
- 产业生态系分析
- 供应商格局
- 利润率
- 成本结构
- 每个阶段的价值增加
- 影响价值链的因素
- 中断
- 产业影响因素
- 成长驱动因素
- 偏好灵活移动而非所有权
- 电动车普及率不断提高,车队电气化程度也不断提高。
- 企业车队需求不断成长
- 连网汽车和远端资讯处理技术的进步
- 产业陷阱与挑战
- 高额资本投资
- 监理和保险方面的挑战
- 市场机会
- 新兴城市市场的扩张
- 与智慧城市和旅游即服务 (MaaS) 平台集成
- 包含保险和维护的捆绑服务
- 专业电动车和商用车解决方案
- 成长驱动因素
- 成长潜力分析
- 监管环境
- 北美洲
- 欧洲
- 亚太地区
- 拉丁美洲
- 中东和非洲
- 波特的分析
- PESTEL 分析
- 技术与创新格局
- 当前技术趋势
- 远端资讯处理与物联网集成
- 人工智慧与预测分析
- 自动驾驶系统(SAE 3-5级)
- 新兴技术
- 数位钥匙和无钥匙存取技术
- 用于智能合约和支付的区块链
- 5G 连接和 V2X 通信
- 当前技术趋势
- 价格趋势
- 定价模式清晰度
- 按分钟、按小时和按天计费
- 订阅等级和隐藏费用
- 动态/高峰定价认知
- 全包价格与明细价格
- 价格敏感度
- 总拥有成本(TCO)
- 按服务类型分類的定价模式
- 成本比较:拥有权与虚拟航空即服务 (VaaS)
- 动态/高峰定价机制
- 订阅等级评估
- 不同地区的定价差异
- 定价模式清晰度
- 成本細項分析
- 专利分析
- 永续性和环境方面
- 永续实践
- 减少废弃物策略
- 生产中的能源效率
- 环保倡议
- 碳足迹考量
- 消费者行为与采纳模式
- 人口统计分析
- 采用虚拟即服务 (VaaS) 的动机
- 收养障碍
- 使用频率和出行模式
- 多模式出行行为
- 品牌忠诚度和转换
- 数位转型与资料分析
- 车载资讯系统和物联网资料
- 预测分析与机器学习
- 巨量资料基础设施
- 资料隐私与安全
- API经济与集成
- 客户获取与留存经济学
- 客户获取成本 (CAC)
- 客户生命週期价值(LTV)
- 单位经济效益和获利能力
- 流失率与留存率
- 会员忠诚计划
- 补贴依赖性
- 供应链脆弱性与风险
- 车辆购买风险
- 电动车电池风险
- 充电基础设施风险
- 技术与软体风险
- 维护和服务风险
- 地缘政治和监管风险
第四章:竞争格局
- 介绍
- 公司市占率分析
- 北美洲
- 欧洲
- 亚太地区
- 拉丁美洲
- MEA
- 主要市场参与者的竞争分析
- 竞争定位矩阵
- 战略展望矩阵
- 关键进展
- 併购
- 合作伙伴关係与合作
- 新产品发布
- 扩张计划和资金
- 产品和服务基准测试
- 服务模式比较
- 定价结构分析
- 技术平台功能
- 客户体验和使用者介面
- 车辆车队构成和质量
- 供应商选择标准
第五章:市场估算与预测:依引擎类型划分,2021-2034年
- 主要趋势
- 电动车(EV)
- 电池电动车(BEV)
- 插电式混合动力车(PHEV)
- 内燃机(ICE)汽车
- 汽油
- 柴油引擎
第六章:市场估算与预测:依服务模式划分,2021-2034年
- 主要趋势
- 基于订阅的车辆服务
- 按使用量付费/按使用次数付费的车辆服务
- 车队即服务 (FaaS)
- 电动汽车即服务
- 整合式旅游即服务 (MaaS)
第七章:市场估算与预测:依服务提供者划分,2021-2034年
- 主要趋势
- 汽车原厂设备製造商
- 汽车经销商/经销商集团
- 汽车科技新创公司与旅游公司
- 汽车订阅软体供应商/平台供应商
- 租赁和金融服务公司
第八章:市场估算与预测:依最终用途划分,2021-2034年
- 主要趋势
- 企业用户
- 私人用户
第九章:市场估价与预测:依车辆类型划分,2021-2034年
- 主要趋势
- 搭乘用车
- 掀背车
- 轿车
- SUV
- 商用车辆
- 低容量性状
- MCV
- C型肝炎
- 两轮车
- 特种及多用途车辆
第十章:市场估计与预测:依地区划分,2021-2034年
- 主要趋势
- 北美洲
- 我们
- 加拿大
- 欧洲
- 德国
- 英国
- 法国
- 义大利
- 西班牙
- 北欧
- 俄罗斯
- 亚太地区
- 中国
- 印度
- 日本
- 韩国
- 澳新银行
- 越南
- 印尼
- 拉丁美洲
- 巴西
- 墨西哥
- 阿根廷
- MEA
- 南非
- 沙乌地阿拉伯
- 阿联酋
第十一章:公司简介
- Global companies
- ARI Fleet Management
- BMW
- Care by Volvo
- Element Fleet Management
- Hertz
- Hyundai
- LeasePlan/Ayvens
- Mercedes-Benz
- Penske Truck Leasing
- Ryder System
- Sixt
- Turo
- Volkswagen
- Waymo
- Wheels
- Zipcar
- 区域玩家
- Emkay
- Lime
- Merchants Fleet
- Mike Albert Fleet Solutions
- PacLease
- 新兴玩家
- Finn Auto
- Porsche Drive
The Global Vehicle as a Service Market was valued at USD 10.5 billion in 2024 and is estimated to grow at a CAGR of 20.7% to reach USD 77.3 billion by 2034.
Consumers and businesses are increasingly prioritizing access to vehicles without the burdens of ownership, such as long-term commitments, insurance, maintenance, and high purchase costs. Subscription and pay-per-use models are meeting these needs by providing flexible, on-demand mobility solutions. Rising urbanization, tech-savvy populations, and the increasing integration of digital platforms are driving adoption, especially in metropolitan areas. The global push toward electric vehicles (EVs) is further accelerating VaaS growth, as EV fleets offer lower operational costs, environmental benefits, and potential government incentives. Organizations are also leveraging Fleet-as-a-Service models to reduce operational complexity and avoid capital expenditure, gaining access to vehicles while outsourcing maintenance, insurance, and fleet management. As urban mobility evolves, VaaS is emerging as a strategic tool for cost efficiency, sustainability, and convenience.
| Market Scope | |
|---|---|
| Start Year | 2024 |
| Forecast Year | 2025-2034 |
| Start Value | $10.5 Billion |
| Forecast Value | $77.3 Billion |
| CAGR | 20.7% |
The subscription-based vehicle service segment held a 63% share in 2024 and is expected to grow at a CAGR of 20.2% through 2034. Subscription models provide flexible, bundled, and commitment-free vehicle access, appealing to both consumers and businesses. Pay-per-use services target occasional users, offering cost-per-trip pricing optimized by demand algorithms. Integrated mobility platforms now combine VaaS with public transit and micromobility solutions, enabling seamless multimodal planning and unified payments.
The automotive OEMs segment held a 38% share in 2024 and is forecast to grow at a CAGR of 20.1% through 2034. OEMs are capitalizing on brand trust, dealer networks, and vehicle supply to launch mobility services. Auto-tech platforms are driving growth with digital-first solutions, streamlining vehicle access, and enhancing customer experience.
U.S. Vehicle as a Service Market reached USD 2.74 billion in 2024. Growing consumer preference for mobility without ownership is boosting subscription and pay-per-use models. These options reduce barriers to vehicle access, offer flexibility in vehicle type selection, and optimize fleet utilization, while generating recurring revenue and increasing customer engagement for providers.
Key players in the Vehicle as a Service Market include BMW, Hyundai, Mercedes-Benz, Volkswagen, Sixt, Hertz, LeasePlan/Ayvens, and Care by Volvo. To strengthen their position, companies in the Vehicle as a Service Market are focusing on expanding subscription and pay-per-use offerings, integrating EVs into fleets, and leveraging digital platforms for seamless customer experience. They are building strategic alliances with automotive manufacturers, tech firms, and mobility providers to scale operations and enhance service coverage. Fleet optimization, predictive maintenance, and dynamic pricing models are being adopted to maximize profitability, while investments in EV infrastructure and sustainability programs reinforce long-term growth. Companies are also using targeted marketing campaigns, loyalty programs, and personalized service options to attract and retain customers, ensuring a stronger market foothold and competitive advantage.
Table of Contents
Chapter 1 Methodology
- 1.1 Market scope and definition
- 1.2 Research design
- 1.2.1 Research approach
- 1.2.2 Data collection methods
- 1.3 Data mining sources
- 1.3.1 Global
- 1.3.2 Regional/Country
- 1.4 Base estimates and calculations
- 1.4.1 Base year calculation
- 1.4.2 Key trends for market estimation
- 1.5 Primary research and validation
- 1.5.1 Primary sources
- 1.6 Forecast model
- 1.7 Research assumptions and limitations
Chapter 2 Executive Summary
- 2.1 Industry 3600 synopsis
- 2.2 Key market trends
- 2.2.1 Regional
- 2.2.2 Engine
- 2.2.3 Service model
- 2.2.4 Service provider
- 2.2.5 End use
- 2.2.6 Vehicle
- 2.3 TAM analysis, 2025-2034
- 2.4 CXO perspectives: Strategic imperatives
- 2.4.1 Executive decision points
- 2.4.2 Critical success factors
- 2.5 Future outlook
- 2.6 Strategic recommendations
Chapter 3 Industry Insights
- 3.1 Industry ecosystem analysis
- 3.1.1 Supplier landscape
- 3.1.2 Profit margin
- 3.1.3 Cost structure
- 3.1.4 Value addition at each stage
- 3.1.5 Factor affecting the value chain
- 3.1.6 Disruptions
- 3.2 Industry impact forces
- 3.2.1 Growth drivers
- 3.2.1.1 Preference for flexible mobility over ownership
- 3.2.1.2 Growing EV adoption and fleet electrification
- 3.2.1.3 Rising corporate fleet demand
- 3.2.1.4 Connected vehicle and telematics advancements
- 3.2.2 Industry pitfalls and challenges
- 3.2.2.1 High capital investment
- 3.2.2.2 Regulatory and insurance challenges
- 3.2.3 Market opportunities
- 3.2.3.1 Expansion in emerging urban markets
- 3.2.3.2 Integration with smart cities and MaaS platforms
- 3.2.3.3 Bundled services with insurance and maintenance
- 3.2.3.4 Specialized EV and commercial vehicle solutions
- 3.2.1 Growth drivers
- 3.3 Growth potential analysis
- 3.4 Regulatory landscape
- 3.4.1 North America
- 3.4.2 Europe
- 3.4.3 Asia Pacific
- 3.4.4 Latin America
- 3.4.5 Middle East & Africa
- 3.5 Porter's analysis
- 3.6 PESTEL analysis
- 3.7 Technology and innovation landscape
- 3.7.1 Current technological trends
- 3.7.1.1 Telematics & IoT integration
- 3.7.1.2 Artificial intelligence & predictive analytics
- 3.7.1.3 Autonomous driving systems (SAE Level 3-5)
- 3.7.2 Emerging technologies
- 3.7.2.1 Digital key & keyless access technologies
- 3.7.2.2 Blockchain for smart contracts & payments
- 3.7.2.3 5G connectivity & V2X communication
- 3.7.1 Current technological trends
- 3.8 Price trends
- 3.8.1 Pricing model clarity
- 3.8.1.1 Per-minute vs hourly vs daily pricing
- 3.8.1.2 Subscription tiers & hidden fees
- 3.8.1.3 Dynamic/surge pricing perceptions
- 3.8.1.4 All-inclusive vs itemized pricing
- 3.8.2 Price sensitivity
- 3.8.3 Total cost of ownership (TCO)
- 3.8.4 Pricing models by service type
- 3.8.5 Cost comparison: ownership vs VaaS
- 3.8.6 Dynamic/surge pricing mechanisms
- 3.8.7 Subscription tier evaluation
- 3.8.8 Pricing variations across regions
- 3.8.1 Pricing model clarity
- 3.9 Cost breakdown analysis
- 3.10 Patent analysis
- 3.11 Sustainability and environmental aspects
- 3.11.1 Sustainable practices
- 3.11.2 Waste reduction strategies
- 3.11.3 Energy efficiency in production
- 3.11.4 Eco-friendly initiatives
- 3.11.5 Carbon footprint considerations
- 3.12 Consumer behavior & adoption patterns
- 3.12.1 Demographic analysis
- 3.12.2 Motivations for VaaS adoption
- 3.12.3 Barriers to adoption
- 3.12.4 Usage frequency & trip patterns
- 3.12.5 Multi-modal mobility behavior
- 3.12.6 Brand loyalty & switching
- 3.13 Digital transformation & data analytics
- 3.13.1 Telematics & IoT data
- 3.13.2 Predictive Analytics & ML
- 3.13.3 Big data infrastructure
- 3.13.4 Data privacy & security
- 3.13.5 API economy & integration
- 3.14 Customer acquisition & retention economics
- 3.14.1 Customer Acquisition Cost (CAC)
- 3.14.2 Customer Lifetime Value (LTV)
- 3.14.3 Unit economics & profitability
- 3.14.4 Churn & retention
- 3.14.5 Loyalty programs
- 3.14.6 Subsidy dependency
- 3.15 Supply chain vulnerabilities & risks
- 3.15.1 Vehicle procurement risks
- 3.15.2 EV battery risks
- 3.15.3 Charging infrastructure risks
- 3.15.4 Technology & software risks
- 3.15.5 Maintenance & service risks
- 3.15.6 Geopolitical & regulatory risks
Chapter 4 Competitive Landscape, 2024
- 4.1 Introduction
- 4.2 Company market share analysis
- 4.2.1 North America
- 4.2.2 Europe
- 4.2.3 Asia Pacific
- 4.2.4 LATAM
- 4.2.5 MEA
- 4.3 Competitive analysis of major market players
- 4.4 Competitive positioning matrix
- 4.5 Strategic outlook matrix
- 4.6 Key developments
- 4.6.1 Mergers & acquisitions
- 4.6.2 Partnerships & collaborations
- 4.6.3 New product launches
- 4.6.4 Expansion plans and funding
- 4.7 Product and service benchmarking
- 4.7.1 Service model comparison
- 4.7.2 Pricing structure analysis
- 4.7.3 Technology platform capabilities
- 4.7.4 Customer experience and user interface
- 4.7.5 Vehicle fleet composition and quality
- 4.8 Vendor selection criteria
Chapter 5 Market Estimates & Forecast, By Engine, 2021 - 2034 ($Mn)
- 5.1 Key trends
- 5.2 Electric vehicles (EVs)
- 5.2.1 Battery electric vehicles (BEVs)
- 5.2.2 Plug-in hybrid electric vehicles (PHEVs)
- 5.3 Internal combustion engine (ICE) vehicles
- 5.3.1 Gasoline
- 5.3.2 Diesel
Chapter 6 Market Estimates & Forecast, By Service Model, 2021 - 2034 ($Mn)
- 6.1 Key trends
- 6.2 Subscription-based vehicle service
- 6.3 Pay-per-use / usage-based vehicle service
- 6.4 Fleet-as-a-service (FaaS)
- 6.5 EV-as-a-service
- 6.6 Integrated mobility-as-a-service (MaaS)
Chapter 7 Market Estimates & Forecast, By Service Provider, 2021 - 2034 ($Mn)
- 7.1 Key trends
- 7.2 Automotive OEMs
- 7.3 Auto dealerships / dealer groups
- 7.4 Auto-tech startups & mobility companies
- 7.5 Car subscription software providers / platform providers
- 7.6 Leasing & financial services companies
Chapter 8 Market Estimates & Forecast, By End Use, 2021 - 2034 ($Mn)
- 8.1 Key trends
- 8.2 Enterprise users
- 8.3 Private users
Chapter 9 Market Estimates & Forecast, By Vehicle, 2021 - 2034 ($Mn)
- 9.1 Key trends
- 9.2 Passenger cars
- 9.2.1 Hatchback
- 9.2.2 Sedan
- 9.2.3 SUV
- 9.3 Commercial vehicles
- 9.3.1 LCV
- 9.3.2 MCV
- 9.3.3 HCV
- 9.4 Two-wheelers
- 9.5 Specialty & utility vehicles
Chapter 10 Market Estimates & Forecast, By Region, 2021 - 2034 ($Mn)
- 10.1 Key trends
- 10.2 North America
- 10.2.1 US
- 10.2.2 Canada
- 10.3 Europe
- 10.3.1 Germany
- 10.3.2 UK
- 10.3.3 France
- 10.3.4 Italy
- 10.3.5 Spain
- 10.3.6 Nordics
- 10.3.7 Russia
- 10.4 Asia Pacific
- 10.4.1 China
- 10.4.2 India
- 10.4.3 Japan
- 10.4.4 South Korea
- 10.4.5 ANZ
- 10.4.6 Vietnam
- 10.4.7 Indonesia
- 10.5 Latin America
- 10.5.1 Brazil
- 10.5.2 Mexico
- 10.5.3 Argentina
- 10.6 MEA
- 10.6.1 South Africa
- 10.6.2 Saudi Arabia
- 10.6.3 UAE
Chapter 11 Company Profiles
- 11.1 Global companies
- 11.1.1 ARI Fleet Management
- 11.1.2 BMW
- 11.1.3 Care by Volvo
- 11.1.4 Element Fleet Management
- 11.1.5 Hertz
- 11.1.6 Hyundai
- 11.1.7 LeasePlan/Ayvens
- 11.1.8 Mercedes-Benz
- 11.1.9 Penske Truck Leasing
- 11.1.10 Ryder System
- 11.1.11 Sixt
- 11.1.12 Turo
- 11.1.13 Volkswagen
- 11.1.14 Waymo
- 11.1.15 Wheels
- 11.1.16 Zipcar
- 11.2 Regional players
- 11.2.1 Emkay
- 11.2.2 Lime
- 11.2.3 Merchants Fleet
- 11.2.4 Mike Albert Fleet Solutions
- 11.2.5 PacLease
- 11.3 Emerging players
- 11.3.1 Finn Auto
- 11.3.2 Porsche Drive
 2026年全球乘用车市场报告VaaS(车辆即服务)市场全球市场报告(2026年)
 2026-2034年全球乘用车智慧转向系统市场规模、份额、趋势及成长分析报告
 乘用车废气排放系统市场-全球产业规模、份额、趋势、机会及预测(依燃料类型、后处理类型、零件类型、地区及竞争格局划分,2021-2031年)乘用车拖车桿市场 - 全球产业规模、份额、趋势、机会、预测:按类型、销售管道、地区和竞争格局划分,2021-2031年电动乘用车零件市场-全球产业规模、份额、趋势、机会及预测(按车辆类型、动力类型、零件类型、地区和竞争格局划分,2021-2031年)
 拉丁美洲乘用车:市场份额分析、行业趋势和统计数据、成长预测(2026-2031 年)
 乘用车智慧转向产业(2025-2026)乘用车市场-全球产业规模、份额、趋势、机会和预测,按类型、车身、引擎类型、地区和竞争格局划分,2021-2031年预测
 乘用车拖车钩:全球市场份额和排名、总销售量和需求预测(2025-2031年)