


 |
市场调查报告书
商品编码
1885922
绿色氨市场机会、成长驱动因素、产业趋势分析及预测(2024-2032年)Green Ammonia Market Opportunity, Growth Drivers, Industry Trend Analysis, and Forecast 2024 - 2032 |
||||||
2024 年全球绿色氨市场价值为 5.2 亿美元,预计到 2034 年将以 65.6% 的复合年增长率增长至 835 亿美元。
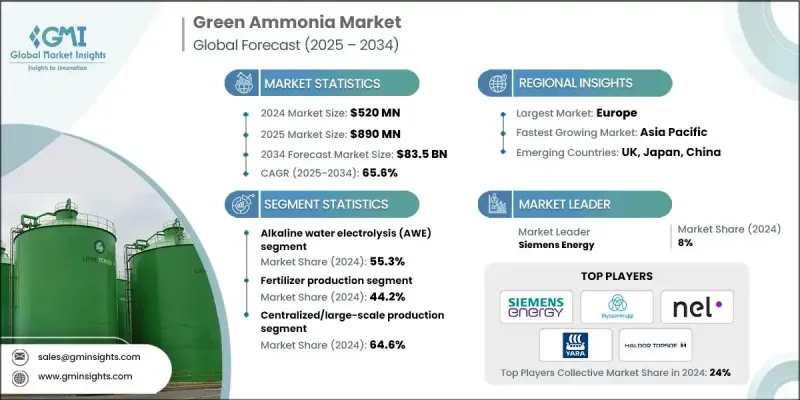
绿色氨正迅速崛起为全球能源转型的重要基石,在能源化工价值链中发挥关键作用,它能够实现氢气储存、与再生能源耦合,并作为航运等难以脱碳产业的零碳燃料。其战略意义在于利用现有的氨基础设施加速规模化生产,同时实现脱碳目标。支持性的政策框架、气候中和目标以及绿色能源认证体系推动了市场成长。技术进步,特别是再生能源驱动的电解氢气技术,正在提高成本效益和营运效率。能源巨头、化肥生产商和海运营运商的企业承诺进一步推动了投资,使绿色氨成为长期永续发展策略的关键要素。区域趋势表明,亚太地区在再生能源产能和出口项目方面处于领先地位,而欧洲则受益于监管支持和已建立的绿色氢能走廊。
| 市场范围 | |
|---|---|
| 起始年份 | 2024 |
| 预测年份 | 2025-2034 |
| 起始值 | 5.2亿美元 |
| 预测值 | 835亿美元 |
| 复合年增长率 | 65.6% |
2024年,碱性水电解(AWE)市占率达到55.3%,预计到2034年将以60.3%的复合年增长率成长。 AWE仍然是大型再生能源併网专案中最具成本效益和最成熟的技术。质子交换膜(PEM)电解具有运作灵活性和对再生能源电力波动的快速反应能力,使其成为併网和混合能源系统的理想选择。
2024年,化肥生产领域占44.2%的市场份额,预计到2034年将以56.2%的复合年增长率成长。以发酵为基础的方法已成熟应用于生物平台化学品的生产,具有选择性高、操作条件温和、能够高效大规模生产复杂分子等优点。
2024年,北美绿色氨市场占全球市场份额的25.9%。该地区由于拥有丰富的可再生能源资源、支持性政策以及现有的氨基础设施,正在崛起成为重要的生产中心,这些都有助于快速采用低碳替代品。
全球绿色氨市场的主要企业包括雅苒国际(Yara International)、西门子能源(Siemens Energy)、巴斯夫(BASF SE)、空气产品公司(Air Products Inc.)、托普索(Haldor Topsoe)、曼恩能源解决方案(MAN Energy Solutions)、星火能源(Starfires)、德希ASA(Hydrogenics)、Hydrogenics、Kapsom、Hiringa Energy 和 Uniper ENGIE。市场参与者正透过投资研发来提高电解效率和降低生产成本,从而巩固自身地位。他们正与再生能源供应商和工业用户建立策略合作伙伴关係,以确保长期承购协议。各公司也正在探索模组化和大规模生产设施,以优化物流和基础设施利用率。数位化监控和先进控制系统的整合正在提升营运性能和可靠性。此外,併购和合资企业也被用于扩大地域覆盖范围、加速商业化进程,并满足成熟和新兴绿色氨市场不断增长的需求。
目录
第一章:方法论与范围
第二章:执行概要
第三章:行业洞察
- 产业生态系分析
- 供应商格局
- 利润率
- 每个阶段的价值增加
- 影响价值链的因素
- 中断
- 产业影响因素
- 成长驱动因素
- 全球脱碳目标与净零排放承诺
- 海事产业向零碳燃料转型
- 政府激励和补贴计划
- 产业陷阱与挑战
- 高资本投资需求
- 技术成熟度与规模化挑战
- 市场机会
- 对现有氨生产设施进行改造
- 小型分散式生产系统
- 成长驱动因素
- 成长潜力分析
- 监管环境
- 北美洲
- 欧洲
- 亚太地区
- 拉丁美洲
- 中东和非洲
- 波特的分析
- PESTEL 分析
- 价格趋势
- 按地区
- 按电解槽技术类型
- 未来市场趋势
- 技术与创新格局
- 当前技术趋势
- 新兴技术
- 专利格局
- 贸易统计(HS编码)(註:仅提供重点国家的贸易统计资料)
- 主要进口国
- 主要出口国
- 永续性和环境方面
- 永续实践
- 减少废弃物策略
- 生产中的能源效率
- 环保倡议
- 碳足迹考量
第四章:竞争格局
- 介绍
- 公司市占率分析
- 按地区
- 北美洲
- 欧洲
- 亚太地区
- 拉丁美洲
- MEA
- 按地区
- 公司矩阵分析
- 主要市场参与者的竞争分析
- 竞争定位矩阵
- 关键进展
- 併购
- 合作伙伴关係与合作
- 新产品发布
- 扩张计划
第五章:市场估算与预测:依技术类型划分,2021-2034年
- 主要趋势
- 碱性水电解(AWE)
- 质子交换膜(PEM)电解
- 固态氧化物电解池(SOEC)
- 阴离子交换膜(AEM)
第六章:市场估算与预测:依应用领域划分,2021-2034年
- 主要趋势
- 化肥生产
- 海事燃料与航运
- 氢载体及储存
- 工业原料及化学品
- 发电与储能
第七章:市场估算与预测:依生产方式划分,2021-2034年
- 主要趋势
- 现场/分散式生产
- 集中式/大规模生产
第八章:市场估算与预测:依地区划分,2021-2034年
- 主要趋势
- 北美洲
- 我们
- 加拿大
- 欧洲
- 德国
- 英国
- 法国
- 西班牙
- 义大利
- 欧洲其他地区
- 亚太地区
- 中国
- 印度
- 日本
- 澳洲
- 韩国
- 亚太其他地区
- 拉丁美洲
- 巴西
- 墨西哥
- 阿根廷
- 拉丁美洲其他地区
- 中东和非洲
- 沙乌地阿拉伯
- 南非
- 阿联酋
- 中东和非洲其他地区
第九章:公司简介
- Siemens Energy
- ThyssenKrupp AG
- Nel ASA (Hydrogenics)
- Yara International
- Haldor Topsoe
- Air Products Inc
- BASF SE
- Hiringa Energy
- Hydrogenics
- Kapsom
- MAN Energy Solutions
- Starfire Energy
- Technip Energies NV
- Uniper ENGIE
The Global Green Ammonia Market was valued at USD 520 million in 2024 and is estimated to grow at a CAGR of 65.6% to reach USD 83.5 billion by 2034.
Green ammonia is rapidly emerging as a cornerstone of the global energy transition, playing a critical role in energy-chemical value chains by enabling hydrogen storage, coupling with renewable energy, and serving as a zero-carbon fuel for hard-to-decarbonize sectors such as shipping. Its strategic importance lies in leveraging existing ammonia infrastructure to accelerate scale-up while meeting decarbonization targets. Market growth is propelled by supportive policy frameworks, climate neutrality goals, and certification schemes for green energy. Technological advancements, particularly in electrolysis-based hydrogen production powered by renewables, are improving cost efficiency and operational performance. Corporate commitments from energy majors, fertilizer producers, and maritime operators are further driving investment, positioning green ammonia as a key element of long-term sustainability strategies. Regional trends indicate Asia-Pacific leading in renewable capacity and export projects, while Europe benefits from regulatory support and established green hydrogen corridors.
| Market Scope | |
|---|---|
| Start Year | 2024 |
| Forecast Year | 2025-2034 |
| Start Value | $520 Million |
| Forecast Value | $83.5 Billion |
| CAGR | 65.6% |
The alkaline water electrolysis (AWE) segment held a 55.3% share in 2024 and is expected to grow at a CAGR of 60.3% through 2034. AWE remains the most cost-effective and mature technology for large-scale renewable energy-linked projects. Proton exchange membrane (PEM) electrolysis offers operational flexibility and rapid response to variable renewable electricity, making it ideal for grid-tied and hybrid energy systems.
The fertilizer production segment held a 44.2% share in 2024 and is projected to grow at a CAGR of 56.2% by 2034. Fermentation-based approaches are well-established for producing bio-platform chemicals, offering high selectivity, mild operating conditions, and efficient production of complex molecules at scale.
North America Green Ammonia Market accounted for a 25.9% share in 2024. The region is emerging as a key production hub due to abundant renewable energy resources, supportive policies, and existing ammonia infrastructure that facilitates rapid adoption of low-carbon alternatives.
Major companies in the Global Green Ammonia Market include Yara International, Siemens Energy, BASF SE, Air Products Inc., Haldor Topsoe, MAN Energy Solutions, Starfire Energy, Technip Energies NV, ThyssenKrupp AG, Nel ASA (Hydrogenics), Hydrogenics, Kapsom, Hiringa Energy, and Uniper ENGIE. Market players are strengthening their position by investing in R&D to improve electrolysis efficiency and reduce production costs. They are forming strategic partnerships with renewable energy providers and industrial consumers to secure long-term offtake agreements. Companies are also exploring modular and large-scale production facilities to optimize logistics and infrastructure utilization. Integration of digital monitoring and advanced control systems is enhancing operational performance and reliability. Additionally, mergers, acquisitions, and joint ventures are being employed to expand geographic footprint, accelerate commercialization, and capture growing demand in both established and emerging green ammonia markets.
Table of Contents
Chapter 1 Methodology & Scope
- 1.1 Market scope and definition
- 1.2 Research design
- 1.2.1 Research approach
- 1.2.2 Data collection methods
- 1.3 Data mining sources
- 1.3.1 Global
- 1.3.2 Regional/Country
- 1.4 Base estimates and calculations
- 1.4.1 Base year calculation
- 1.4.2 Key trends for market estimation
- 1.5 Primary research and validation
- 1.5.1 Primary sources
- 1.6 Forecast model
- 1.7 Research assumptions and limitations
Chapter 2 Executive Summary
- 2.1 Industry 360° synopsis
- 2.2 Key market trends
- 2.2.1 Regional
- 2.2.2 Technology type
- 2.2.3 Application
- 2.2.4 Production mode
- 2.3 TAM Analysis, 2025-2034
- 2.4 CXO perspectives: Strategic imperatives
- 2.4.1 Executive decision points
- 2.4.2 Critical success factors
- 2.5 Future Outlook and Strategic Recommendations
Chapter 3 Industry Insights
- 3.1 Industry ecosystem analysis
- 3.1.1 Supplier landscape
- 3.1.2 Profit margin
- 3.1.3 Value addition at each stage
- 3.1.4 Factor affecting the value chain
- 3.1.5 Disruptions
- 3.2 Industry impact forces
- 3.2.1 Growth drivers
- 3.2.1.1 Global decarbonization targets & net-zero commitments
- 3.2.1.2 Maritime industry's transition to zero-carbon fuels
- 3.2.1.3 Government incentives & subsidy programs
- 3.2.2 Industry pitfalls and challenges
- 3.2.2.1 High capital investment requirements
- 3.2.2.2 Technological maturity & scale-up challenges
- 3.2.3 Market opportunities
- 3.2.3.1 Retrofitting existing ammonia production facilities
- 3.2.3.2 Small-scale distributed production systems
- 3.2.1 Growth drivers
- 3.3 Growth potential analysis
- 3.4 Regulatory landscape
- 3.4.1 North America
- 3.4.2 Europe
- 3.4.3 Asia Pacific
- 3.4.4 Latin America
- 3.4.5 Middle East & Africa
- 3.5 Porter's analysis
- 3.6 PESTEL analysis
- 3.7 Price trends
- 3.7.1 By region
- 3.7.2 By electrolyzer technology type
- 3.8 Future market trends
- 3.9 Technology and Innovation landscape
- 3.9.1 Current technological trends
- 3.9.2 Emerging technologies
- 3.10 Patent Landscape
- 3.11 Trade statistics (HS code) ( Note: the trade statistics will be provided for key countries only)
- 3.11.1 Major importing countries
- 3.11.2 Major exporting countries
- 3.12 Sustainability and environmental aspects
- 3.12.1 Sustainable practices
- 3.12.2 Waste reduction strategies
- 3.12.3 Energy efficiency in production
- 3.12.4 Eco-friendly initiatives
- 3.13 Carbon footprint consideration
Chapter 4 Competitive Landscape, 2024
- 4.1 Introduction
- 4.2 Company market share analysis
- 4.2.1 By region
- 4.2.1.1 North America
- 4.2.1.2 Europe
- 4.2.1.3 Asia Pacific
- 4.2.1.4 LATAM
- 4.2.1.5 MEA
- 4.2.1 By region
- 4.3 Company matrix analysis
- 4.4 Competitive analysis of major market players
- 4.5 Competitive positioning matrix
- 4.6 Key developments
- 4.6.1 Mergers & acquisitions
- 4.6.2 Partnerships & collaborations
- 4.6.3 New Product Launches
- 4.6.4 Expansion Plans
Chapter 5 Market Estimates and Forecast, By Technology Type, 2021-2034 (USD Million)
- 5.1 Key trends
- 5.2 Alkaline water electrolysis (AWE)
- 5.3 Proton exchange membrane (PEM) electrolysis
- 5.4 Solid oxide electrolyzer cell (SOEC)
- 5.5 Anion exchange membrane (AEM)
Chapter 6 Market Estimates and Forecast, By Application, 2021-2034 (USD Million)
- 6.1 Key trends
- 6.2 Fertilizer production
- 6.3 Maritime fuel & shipping
- 6.4 Hydrogen carrier & storage
- 6.5 Industrial feedstock & chemicals
- 6.6 Power generation & energy storage
Chapter 7 Market Estimates and Forecast, By Production Mode, 2021-2034 (USD Million)
- 7.1 Key trends
- 7.2 On-site/distributed production
- 7.3 Centralized/large-scale production
Chapter 8 Market Estimates and Forecast, By Region, 2021-2034 (USD Million)
- 8.1 Key trends
- 8.2 North America
- 8.2.1 U.S.
- 8.2.2 Canada
- 8.3 Europe
- 8.3.1 Germany
- 8.3.2 UK
- 8.3.3 France
- 8.3.4 Spain
- 8.3.5 Italy
- 8.3.6 Rest of Europe
- 8.4 Asia Pacific
- 8.4.1 China
- 8.4.2 India
- 8.4.3 Japan
- 8.4.4 Australia
- 8.4.5 South Korea
- 8.4.6 Rest of Asia Pacific
- 8.5 Latin America
- 8.5.1 Brazil
- 8.5.2 Mexico
- 8.5.3 Argentina
- 8.5.4 Rest of Latin America
- 8.6 Middle East and Africa
- 8.6.1 Saudi Arabia
- 8.6.2 South Africa
- 8.6.3 UAE
- 8.6.4 Rest of Middle East and Africa
Chapter 9 Company Profiles
- 9.1 Siemens Energy
- 9.2 ThyssenKrupp AG
- 9.3 Nel ASA (Hydrogenics)
- 9.4 Yara International
- 9.5 Haldor Topsoe
- 9.6 Air Products Inc
- 9.7 BASF SE
- 9.8 Hiringa Energy
- 9.9 Hydrogenics
- 9.10 Kapsom
- 9.11 MAN Energy Solutions
- 9.12 Starfire Energy
- 9.13 Technip Energies NV
- 9.14 Uniper ENGIE
 绿色氨市场:2026-2032年全球市场预测(依生产技术、动力来源、工厂产能、储存方式及应用划分)
 2026年全球绿色氨调峰机组前端工程设计(FEED)市场报告2026年全球绿色氨市场报告
 绿色氨市场规模、份额、成长及全球产业分析:按类型、应用和地区划分,并提供2026-2034年的洞察和预测
 绿色氨:市场占有率分析、产业趋势与统计、成长预测(2026-2031)全球绿色氨市场规模、份额、趋势和成长分析报告(2026-2034年)
 全球绿色氨市场:预测(至2034年)-依生产技术、再生能源来源、工厂产能、分销/物流、应用、最终用户和地区进行分析
 绿色氨市场-全球产业规模、份额、趋势、机会及预测(依生产方法、最终用途、区域及竞争格局划分,2021-2031年)
 全球绿色氨市场,2026-2030年
 日本绿色氨市场报告(按技术(质子交换膜、碱性水电解、固体氧化物电解)、最终用户(发电、交通运输、化肥、製冷及其他)和地区划分,2026-2034年)