


 |
市场调查报告书
商品编码
1934855
绿色氨:市场占有率分析、产业趋势与统计、成长预测(2026-2031)Green Ammonia - Market Share Analysis, Industry Trends & Statistics, Growth Forecasts (2026 - 2031) |
||||||
※ 本网页内容可能与最新版本有所差异。详细情况请与我们联繫。
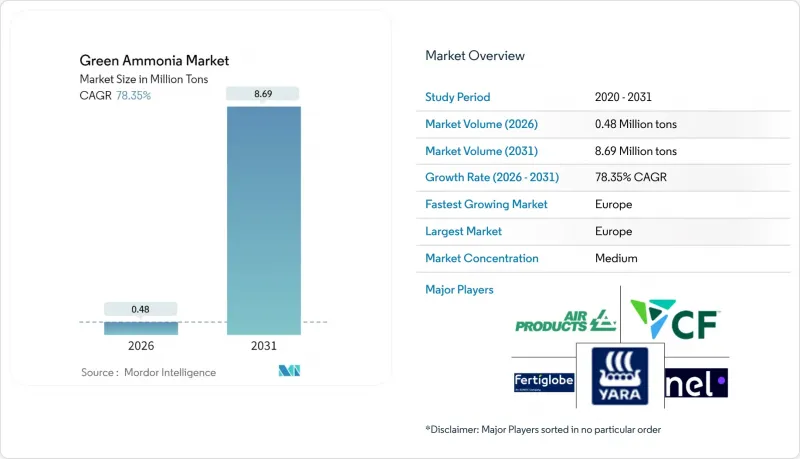
预计到 2026 年,绿色氨市场规模将达到 48 万吨,高于 2025 年的 27 万吨。
预计到 2031 年将达到 869 万吨,2026 年至 2031 年的复合年增长率为 78.35%。
欧洲、日本和印度的政策支持力度加大,资源丰富地区再生能源成本降至0.02美元/度左右,以及绿色氨作为肥料和无碳燃料的双重效用,都在加速其普及应用。航运业的脱碳需求,特别是欧盟计画从2024年起将航运业纳入排放交易体系(ETS),正催生对氨动力船舶的早期需求。同时,德国、日本和韩国的氢能策略已将绿色氨定位为关键的氢载体。在计划层面,整合可再生能源发电、大规模电解和氨合成的工厂正在实现规模经济。儘管来自蓝氨的竞争仍然存在,但绿色氨市场具有许多优势,包括不受天然气价格波动的影响以及未来可能获得碳价溢价。
全球绿色氨市场趋势及展望
粮食不安全国家对化肥的需求不断成长
开发中国家正优先发展绿色氨的国内生产,以减少对化肥进口的依赖,并加强粮食安全。俄乌衝突暴露了传统化肥贸易的脆弱性,此后,肯亚和奈及利亚等国宣布了吉瓦级可再生能源製氨计划,以稳定供应链。非洲联盟2063年碳中和目标鼓励公私合营,将风能和太阳能资源与小规模农户合作社连结起来。多边金融机构已拨款23亿美元用于永续化肥项目,并为电解设施提供优惠融资。拥有强大太阳能和风能潜力的国家能够以低于进口灰色氨的成本生产绿色氨,从而改变竞争格局。不断上涨的粮食进口成本促使各国农业部将化肥政策与能源独立目标结合,鼓励签署承购协议,以支持新工厂的资金筹措。这一势头正显着推动非洲和南亚绿色氨市场的扩张。
脱碳政策促进航运业使用绿色燃料。
国际海事组织(IMO)提出的2050年排放减半目标以及欧盟碳定价机制的扩大,正推动氨燃料的普及应用。包括马士基和日本邮船在内的航运公司已订购了可使用氨燃料的船舶,并计划在2030年前投入商业营运。日本经济产业省(METI)正在为氨发动机提供联合资助,并强制要求发电厂使用20%的氨燃料进行混烧,这造成了燃料需求的重复。 IMO将于2025年发布的临时指南将明确安全通讯协定,并鼓励在鹿特丹和新加坡建造加註中心。将回程传输与可再生氢回程运输相结合的港口当局将获得先发优势,并加强区域丛集。
电解和哈伯-博世製程改造需要大量资金
电解组件的成本占总安装成本的一半,碱性电解槽的成本为每千瓦800至1200美元。一个年产100万吨的绿色氨生产综合体需要500至1000兆瓦的电解产能,投资额为4000至12亿美元,这还不包括哈伯-博世合成装置或可再生能源发电设施的成本。连续生产氨需要稳定的再生能源或电池缓衝系统,这将使资本支出增加10%至15%。企划案融资依赖15至25年的购电协议和产品销售协议,而这些协议在新兴市场仍然不常见。儘管有美国《通货膨胀控制法案》和欧洲创新基金等激励措施,但不断上涨的技术风险溢价已显着增加了平准化成本。这些不断上涨的成本正在推迟最终的投资决策,并对绿色氨市场构成重大挑战。
细分市场分析
至2025年,农业部门将占绿色氨市场87.25%的份额,并在2031年之前以84.1%的复合年增长率成长。这项数据表明,即使新的能源应用不断涌现,化肥需求仍将主导。粮食安全情势严峻的地区正在寻求能源独立的营养解决方案,而一系列补贴计画正在缩短当地生产设施的投资回收期。
儘管目前船用燃料的需求基数仍然不高,但稳定的造船订单和燃料加註码头的公告表明,到2028年,船用燃料市场将迎来一个转折点。日本正在火力发电厂进行氨混烧试验(混烧比例高达20%),这表明存在交叉需求,可以提高电厂的运转率并降低单位成本。在德国和韩国进口策略的支持下,氢载体产业为可再生能源供应中心和工业消费中心之间的长距离运输提供了支持。化学原料和钢铁脱碳创造了利基性、高附加价值的销售管道,实现了收入来源多元化,并保护了绿色氨产业免受大宗商品週期波动的影响。
绿氨市场报告按应用领域(农业、船舶燃料、发电、氢载体及其他应用)和地区(亚太、北美、欧洲、南美以及中东和非洲)进行细分。市场预测以吨为单位。
区域分析
欧洲凭藉全面的政策协调,将碳定价机制内部化并鼓励可再生能源应用,在绿色氨市场占据主导地位,预计到2025年市场份额将达到35.35%,年复合成长率高达84.9%。挪威的SkiGA离岸风力发电氨计划每年将供应10万吨氨,为区域整合价值链树立标竿。德国正在鹿特丹建造一个专用进口码头,以配合其国内电解能的扩张,确保工业用户的氨供应冗余。
亚太地区作为区域贡献者发挥关键作用。日本的目标是到2050年实现3000万吨的氨需求量,其中包括航运和发电厂的需求。同时,中国正在省级奖励策略下,试办一座数吉瓦的可再生能源氨厂。韩国的公私合营联盟将13家公司和5个机构连接起来,负责生产和进口物流;而印度每年55万吨的补贴计划正在推动诸如AM Green在安得拉邦建设的100万吨级综合体等大型企划。这些努力正在促进全部区域的强劲成长,亚太地区的工厂正在为满足国内需求和出口做好准备。北美地区正受惠于《通膨控制法案》下的生产税额扣抵,CF Industries在路易斯安那州的合资企业设定的年产量目标为140万吨,便是最好的例证。中东和非洲地区正崛起为出口导向枢纽,阿联酋成功向德国交付了首批H2Global试点产品,展现了长途贸易的经济效益。南美洲正在巴西塞阿拉州开展多个计划,充分利用陆上风电和港口接近性,不断扩大其在全球绿色氨市场的份额。在这些大洲,比较优势将取决于可再生资源禀赋、政策奖励以及与需求中心的运输距离,这些因素将影响未来的投资配置。
其他福利:
- Excel格式的市场预测(ME)表
- 3个月的分析师支持
目录
第一章 引言
- 研究假设和市场定义
- 调查范围
第二章调查方法
第三章执行摘要
第四章 市场情势
- 市场概览
- 市场驱动因素
- 粮食不安全国家对化肥的需求不断成长
- 脱碳政策加速航运业绿色燃料的发展。
- 对绿色氨作为氢载体的需求日益增长
- 增加绿色低碳肥料的采购
- 在发电和电力系统稳定领域不断扩大应用
- 市场限制
- 改造电解和哈伯-博世製程需要大量资金投入。
- 船舶加油中的安全和毒性挑战
- 蓝氨竞争(如果天然气和碳捕获与储存(CCS)成本低)
- 价值链分析
- 波特五力模型
- 供应商的议价能力
- 买方的议价能力
- 新进入者的威胁
- 替代品的威胁
- 竞争程度
第五章 市场规模与成长预测
- 透过使用
- 农业
- 船用燃料
- 发电
- 氢载体
- 其他用途(工业原料等)
- 按地区
- 亚太地区
- 中国
- 日本
- 印度
- 韩国
- 东南亚国协
- 亚太其他地区
- 北美洲
- 我们
- 加拿大
- 墨西哥
- 欧洲
- 德国
- 英国
- 法国
- 义大利
- 西班牙
- 俄罗斯
- 北欧国家
- 其他欧洲地区
- 南美洲
- 巴西
- 阿根廷
- 其他南美洲
- 中东和非洲
- 沙乌地阿拉伯
- 南非
- 其他中东和非洲地区
- 亚太地区
第六章 竞争情势
- 市场集中度
- 策略趋势
- 市占率(%)/排名分析
- 公司简介
- ACME Group
- Air Products and Chemicals Inc.
- AM Green
- Casale SA
- CF Industries Holdings Inc.
- Engie SA
- ENOWA
- Fertiglobe
- Fortescue
- Greenko Group
- Iberdrola, SA
- ITM Power plc
- KAPSOM plc
- MAN Energy Solutions
- Nel
- Ocior
- Orsted AS
- Proton Ventures
- Siemens Energy
- Technip Energies NV
- thyssenkrupp Uhde GmbH
- Yara
第七章 市场机会与未来展望
Green Ammonia market size in 2026 is estimated at 0.48 million tons, growing from 2025 value of 0.27 million tons with 2031 projections showing 8.69 million tons, growing at 78.35% CAGR over 2026-2031.
Intensifying policy support in Europe, Japan and India, falling renewable electricity costs toward USD 0.02 per kWh in resource-rich regions, and the dual utility of green ammonia as fertilizer and carbon-free fuel collectively accelerate adoption. Maritime decarbonization mandates, particularly the European Union's inclusion of shipping in its Emissions Trading System from 2024, create early demand for ammonia-powered vessels, while hydrogen strategies in Germany, Japan and South Korea position green ammonia as a key hydrogen carrier. At the project level, integrated plants that combine renewable generation, large-scale electrolysis and ammonia synthesis are unlocking economies of scale. Meanwhile, competition from blue ammonia continues, yet the green ammonia market benefits from independence from natural-gas volatility and the prospect of future carbon-pricing premiums.
Global Green Ammonia Market Trends and Insights
Increasing Fertilizer Demand from Food-Insecure Nations
Developing economies are prioritizing domestic production of green ammonia to reduce fertilizer import dependence and strengthen food security. The Russia-Ukraine conflict exposed vulnerabilities in conventional fertilizer trade, prompting Kenya, Nigeria, and similar nations to announce gigawatt-scale renewable-to-ammonia projects to stabilize supply chains. The African Union's 2063 neutrality goals foster public-private ventures that link wind and solar resources to smallholder cooperatives. Multilateral lenders have allocated USD 2.3 billion to sustainable fertilizer programs, channeling concessional finance into electrolysis capacity. Countries with high solar and wind potential can achieve delivered costs that undercut imported gray ammonia, shifting the competitive balance. As food-import bills rise, agricultural ministries increasingly bundle fertilizer policy with energy-independence targets, accelerating offtake agreements that underpin financial close for new plants. This momentum contributes strongly to green ammonia market expansion across Africa and South Asia.
Decarbonization Policies Accelerating Green Fuels in Shipping
The International Maritime Organization's target to halve emissions by 2050 and the EU carbon-pricing extension are catalyzing ammonia fuel adoption. Maersk, NYK Line, and other carriers have placed orders for ammonia-ready vessels, planning commercial operation before 2030. Japan's Ministry of Economy, Trade and Industry co-funds ammonia engines and mandates 20% ammonia co-firing in power plants, creating overlapping fuel demand. Interim IMO guidelines issued in 2025 clarify safety protocols, triggering investment in bunkering hubs at Rotterdam and Singapore. Port authorities that integrate bunkering infrastructure with renewable-hydrogen backhaul capture early-mover advantages, reinforcing regional clusters.
High Capital Requirements for Electrolysis and Haber-Bosch Retrofits
Electrolyzer packages account for up to half of the total installed cost, at USD 800-1,200 per kW for alkaline units. A 1 million-ton-per-year green ammonia complex demands 500-1,000 MW of electrolyzers, translating to USD 400-1,200 million before adding Haber-Bosch synthesis and renewable generation assets. Continuous ammonia output requires firm renewable power or battery buffer systems, adding 10-15% to capital expenditure. Project finance hinges on 15-25-year power-purchase and offtake contracts-structures still uncommon in emerging markets. Despite incentives like the US Inflation Reduction Act and Europe's Innovation Fund, higher technology risk premiums are significantly increasing the levelized costs. This rise is causing delays in final investment decisions, highlighting a significant challenge for the green ammonia market.
Other drivers and restraints analyzed in the detailed report include:
- Growing Demand for Green Ammonia as a Hydrogen Carrier
- Increasing Procurement of Green and Low-Carbon Fertilizers
- Safety and Toxicity Hurdles for Maritime Bunkering
For complete list of drivers and restraints, kindly check the Table Of Contents.
Segment Analysis
Agriculture commanded 87.25% of the green ammonia market share in 2025, and the segment is expanding at an 84.1% CAGR through 2031. The statistic underscores the continued primacy of fertilizer demand even as new energy applications emerge. Food-insecure regions seek energy-independent nutrient solutions, and bundled subsidy schemes shorten payback periods on local production assets.
Marine fuel holds a modest baseline today, yet confirmed shipbuilding orders and bunkering terminal announcements indicate an inflection by 2028. Power generation trials in Japan, co-firing up to 20% ammonia in thermal plants, illustrate crossover demand that raises plant load factors and cuts per-unit costs. The hydrogen-carrier segment, backed by import strategies in Germany and South Korea, offers long-haul linkage between renewable hot-spots and industrial consumption centers. Chemical feedstock and steel decarbonization add niche but premium-valued outlets, broadening the revenue mix and cushioning the green ammonia industry against commodity-cycle volatility.
The Green Ammonia Market Report is Segmented by Application (Agriculture, Marine Fuel, Power Generation, Hydrogen Carrier, Other Applications), and Geography (Asia-Pacific, North America, Europe, South America, Middle East and Africa). The Market Forecasts are Provided in Terms of Volume (tons).
Geography Analysis
Europe's leadership, with a 35.35% green ammonia market share in 2025 and an 84.9% CAGR, rests on comprehensive policy alignment that internalizes carbon prices and rewards renewable content. Norway's SkiGA offshore-wind-to-ammonia project will supply 100,000 tons per year, setting a regional benchmark for integrated value chains. Germany's dedicated import terminal at Rotterdam complements domestic electrolysis build-out, ensuring redundancy in supply for industrial users.
Asia-Pacific plays a significant role as a regional contributor. Japan targets 30 million tons of ammonia demand by 2050, combining maritime and power-station offtake, while China pilots multi-GW renewable ammonia plants under provincial stimulus packages. South Korea's public-private coalition aligns 13 firms and five institutes around production and import logistics, and India's 550,000-ton annual subsidy scheme catalyzes megaprojects such as AM Green's 1 million-ton complex in Andhra Pradesh. These initiatives collectively underpin strong regional growth, with Asia-Pacific facilities positioned both for domestic uptake and exports. North America benefits from the Inflation Reduction Act's production tax credits, evidenced by CF Industries' Louisiana joint venture targeting 1.4 million tons annual capacity. The Middle East and Africa are emerging as export-oriented hubs; the UAE secured the first H2Global pilot shipment to Germany, validating long-distance trade economics. Brazil's Ceara state aggregates several projects leveraging onshore wind and port proximity, broadening South America's stake in the global green ammonia market. Across these continents, comparative advantage hinges on renewable resource endowment, policy incentives and shipping distances to demand centers, factors that will shape future investment allocation.
- ACME Group
- Air Products and Chemicals Inc.
- AM Green
- Casale SA
- CF Industries Holdings Inc.
- Engie SA
- ENOWA
- Fertiglobe
- Fortescue
- Greenko Group
- Iberdrola, S.A.
- ITM Power plc
- KAPSOM plc
- MAN Energy Solutions
- Nel
- Ocior
- Orsted AS
- Proton Ventures
- Siemens Energy
- Technip Energies N.V.
- thyssenkrupp Uhde GmbH
- Yara
Additional Benefits:
- The market estimate (ME) sheet in Excel format
- 3 months of analyst support
TABLE OF CONTENTS
1 Introduction
- 1.1 Study Assumptions and Market Definition
- 1.2 Scope of the Study
2 Research Methodology
3 Executive Summary
4 Market Landscape
- 4.1 Market Overview
- 4.2 Market Drivers
- 4.2.1 Increasing fertilizer demand from food-insecure nations
- 4.2.2 Decarbonization policies accelerating green fuels in shipping
- 4.2.3 Growing demand for green ammonia as a hydrogen carrier
- 4.2.4 Increasing procurement of green and low-carbon fertilizers
- 4.2.5 Increasing usage in power generation and grid stability
- 4.3 Market Restraints
- 4.3.1 High capital requirements for electrolysis and Haber-Bosch retrofits
- 4.3.2 Safety and toxicity hurdles for maritime bunkering
- 4.3.3 Blue-ammonia cost competition where gas and carbon capture storage (CCS) are cheap
- 4.4 Value Chain Analysis
- 4.5 Porter's Five Forces
- 4.5.1 Bargaining Power of Suppliers
- 4.5.2 Bargaining Power of Buyers
- 4.5.3 Threat of New Entrants
- 4.5.4 Threat of Substitutes
- 4.5.5 Degree of Competition
5 Market Size and Growth Forecasts (Volume)
- 5.1 By Application
- 5.1.1 Agriculture
- 5.1.2 Marine Fuel
- 5.1.3 Power Generation
- 5.1.4 Hydrogen Carrier
- 5.1.5 Other Applications (Industrial Feedstock, etc.)
- 5.2 By Geography
- 5.2.1 Asia-Pacific
- 5.2.1.1 China
- 5.2.1.2 Japan
- 5.2.1.3 India
- 5.2.1.4 South Korea
- 5.2.1.5 ASEAN Countries
- 5.2.1.6 Rest of Asia-Pacific
- 5.2.2 North America
- 5.2.2.1 United States
- 5.2.2.2 Canada
- 5.2.2.3 Mexico
- 5.2.3 Europe
- 5.2.3.1 Germany
- 5.2.3.2 United Kingdom
- 5.2.3.3 France
- 5.2.3.4 Italy
- 5.2.3.5 Spain
- 5.2.3.6 Russia
- 5.2.3.7 NORDIC Countries
- 5.2.3.8 Rest of Europe
- 5.2.4 South America
- 5.2.4.1 Brazil
- 5.2.4.2 Argentina
- 5.2.4.3 Rest of South America
- 5.2.5 Middle East and Africa
- 5.2.5.1 Saudi Arabia
- 5.2.5.2 South Africa
- 5.2.5.3 Rest of Middle East and Africa
- 5.2.1 Asia-Pacific
6 Competitive Landscape
- 6.1 Market Concentration
- 6.2 Strategic Moves
- 6.3 Market Share(%)/Ranking Analysis
- 6.4 Company Profiles (includes Global level Overview, Market level overview, Core Segments, Financials as available, Strategic Information, Market Rank/Share for key companies, Products & Services, and Recent Developments)
- 6.4.1 ACME Group
- 6.4.2 Air Products and Chemicals Inc.
- 6.4.3 AM Green
- 6.4.4 Casale SA
- 6.4.5 CF Industries Holdings Inc.
- 6.4.6 Engie SA
- 6.4.7 ENOWA
- 6.4.8 Fertiglobe
- 6.4.9 Fortescue
- 6.4.10 Greenko Group
- 6.4.11 Iberdrola, S.A.
- 6.4.12 ITM Power plc
- 6.4.13 KAPSOM plc
- 6.4.14 MAN Energy Solutions
- 6.4.15 Nel
- 6.4.16 Ocior
- 6.4.17 Orsted AS
- 6.4.18 Proton Ventures
- 6.4.19 Siemens Energy
- 6.4.20 Technip Energies N.V.
- 6.4.21 thyssenkrupp Uhde GmbH
- 6.4.22 Yara
7 Market Opportunities and Future Outlook
- 7.1 White-space and Unmet-need Assessment
- 7.2 Growing research on affordable production of green ammonia
 绿色氨市场:2026-2032年全球市场预测(依生产技术、动力来源、工厂产能、储存方式及应用划分)
 2026年全球绿色氨调峰机组前端工程设计(FEED)市场报告2026年全球绿色氨市场报告
 绿色氨市场规模、份额、成长及全球产业分析:按类型、应用和地区划分,并提供2026-2034年的洞察和预测全球绿色氨市场规模、份额、趋势和成长分析报告(2026-2034年)
 全球绿色氨市场:预测(至2034年)-依生产技术、再生能源来源、工厂产能、分销/物流、应用、最终用户和地区进行分析
 绿色氨市场-全球产业规模、份额、趋势、机会及预测(依生产方法、最终用途、区域及竞争格局划分,2021-2031年)
 全球绿色氨市场,2026-2030年
 日本绿色氨市场报告(按技术(质子交换膜、碱性水电解、固体氧化物电解)、最终用户(发电、交通运输、化肥、製冷及其他)和地区划分,2026-2034年)
 绿色氨市场机会、成长驱动因素、产业趋势分析及预测(2024-2032年)