


 |
市场调查报告书
商品编码
1892647
循环经济化学品市场机会、成长驱动因素、产业趋势分析及预测(2025-2034年)Circular Economy Chemicals Market Opportunity, Growth Drivers, Industry Trend Analysis, and Forecast 2025 - 2034 |
||||||
2024 年全球循环经济化学品市场价值为 2,284 亿美元,预计到 2034 年将以 13.5% 的复合年增长率成长至 8,123 亿美元。
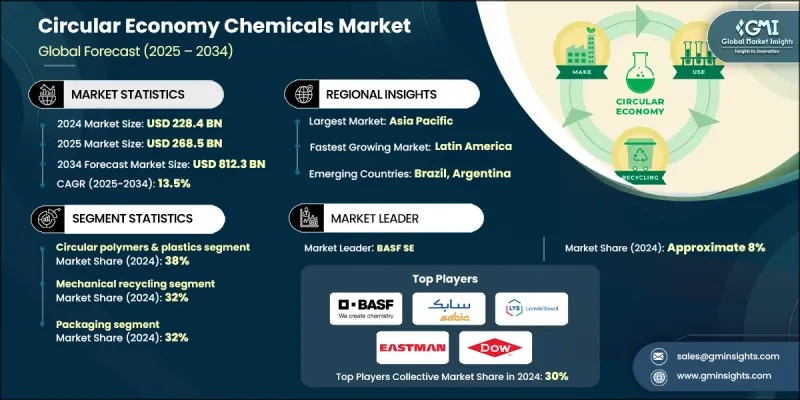
本产业涵盖聚合物、树脂、有机和无机化学品、中间体以及源自机械和化学回收、生物基原料和工业废弃物回收的特殊化学品。随着监管框架的不断完善、可持续发展承诺的日益强化以及先进回收技术的日益成熟,该行业的成长速度正在加快。三大变革正在重塑产业格局:针对难处理废弃物的化学和先进回收工厂的大规模建设;主要工业垂直领域对循环商业模式的采用;以及认证体系和品质平衡方法的扩展,使企业能够验证循环成分并将其商业化。这些趋势正在包装、交通、电子和消费品等产业催生对循环化学品的庞大新需求。随着各行业致力于脱碳和减少废弃物,循环经济化学品市场持续成长,企业正在探索创新途径,以实现材料循环并减少对传统化石基原料的依赖。
| 市场范围 | |
|---|---|
| 起始年份 | 2024 |
| 预测年份 | 2025-2034 |
| 起始值 | 2284亿美元 |
| 预测值 | 8123亿美元 |
| 复合年增长率 | 13.5% |
2024年,循环聚合物和塑胶领域占据了38%的市场份额,预计到2034年将以13.5%的复合年增长率成长。其主导地位源自于全球在包装、建筑、汽车零件、电子产品和家居用品等领域对塑胶的庞大消费量。减少塑胶废弃物和提高回收率的压力日益增大,也促使人们更加迫切地需要能够同时满足环境和工业性能要求的循环替代方案。
2024年,机械回收市占率占比达32%,预计2025年至2034年间将以11.8%的复合年增长率成长。此方法凭藉其成本效益和对消费后及工业后塑胶的广泛适用性,保持领先地位。其相对简单的加工流程使其成为众多寻求经济型回收方案的终端用户产业的首选。
2024年,欧洲循环经济化学品市场规模预计将达到617亿美元,体现了其在全球循环经济化学品领域的强大地位。该地区受益于先进的废弃物管理系统、雄心勃勃的政策方针和完善的回收基础设施。旨在提高回收率和改善产品循环性的各项综合倡议,将继续巩固该地区在推动更永续的化学品生产和减少废弃物方面所发挥的领导作用。
目录
第一章:方法论与范围
第二章:执行概要
第三章:行业洞察
- 产业生态系分析
- 供应商格局
- 利润率
- 每个阶段的价值增加
- 影响价值链的因素
- 中断
- 产业影响因素
- 成长驱动因素
- 产业陷阱与挑战
- 市场机会
- 成长潜力分析
- 监管环境
- 北美洲
- 欧洲
- 亚太地区
- 拉丁美洲
- 中东和非洲
- 波特的分析
- PESTEL 分析
- 价格趋势
- 按地区
- 按类型
- 未来市场趋势
- 技术与创新格局
- 当前技术趋势
- 新兴技术
- 专利格局
- 贸易统计(HS编码)(註:仅提供重点国家的贸易统计资料)
- 主要进口国
- 主要出口国
- 永续性和环境方面
- 永续实践
- 减少废弃物策略
- 生产中的能源效率
- 环保倡议
- 碳足迹考量
第四章:竞争格局
- 介绍
- 公司市占率分析
- 按地区
- 北美洲
- 欧洲
- 亚太地区
- 拉丁美洲
- MEA
- 按地区
- 公司矩阵分析
- 主要市场参与者的竞争分析
- 竞争定位矩阵
- 关键进展
- 併购
- 合作伙伴关係与合作
- 新产品发布
- 扩张计划
第五章:市场估算与预测:依类型划分,2021-2034年
- 循环聚合物和塑料
- 循环溶剂
- 回收金属和无机化学品
- 生物化学品
- 二氧化碳基化学品
- 回收的特殊化学品
第六章:市场估算与预测:依製程划分,2021-2034年
- 机械回收
- 化学回收
- 生物/酵素法加工
- 二氧化碳捕集与利用(CCU)
- 生物精炼
- 溶剂回收与纯化
第七章:市场估算与预测:依最终用途产业划分,2021-2034年
- 包装
- 软包装
- 硬质包装
- 工业及运输包装
- 可堆肥和可生物降解包装
- 汽车与运输
- 内部组件
- 外部及结构部件
- 引擎盖下及动力系统
- 电气和电子系统
- 涂层与表面保护
- 建筑材料
- 绝缘材料
- 结构和饰面材料
- 黏合剂、密封剂和涂料
- 管道及基础设施
- 纺织服装
- 时尚与服装
- 家用纺织品及家具
- 技术及工业纺织品
- 农业
- 农业薄膜
- 肥料和土壤改良剂
- 作物保护与农业化学品
- 灌溉与水资源管理
- 电学
- 消费性电子产品
- 工业电子及设备
- 储能与电池
- 电线、电缆和电气基础设施
- 消费品及个人护理
- 个人护理产品
第八章:市场估算与预测:依地区划分,2021-2034年
- 北美洲
- 我们
- 加拿大
- 欧洲
- 德国
- 英国
- 法国
- 西班牙
- 义大利
- 欧洲其他地区
- 亚太地区
- 中国
- 印度
- 日本
- 澳洲
- 韩国
- 亚太其他地区
- 拉丁美洲
- 巴西
- 墨西哥
- 阿根廷
- 拉丁美洲其他地区
- 中东和非洲
- 沙乌地阿拉伯
- 南非
- 阿联酋
- 中东和非洲其他地区
第九章:公司简介
- BASF SE
- Borealis AG
- Braskem SA
- Carbios SA
- Covestro AG
- Dow Inc.
- DSM-Firmenich
- Eastman Chemical Company
- Evonik Industries AG
- INEOS Group
- LG Chem Ltd.
- Loop Industries Inc.
- LyondellBasell Industries NV
- Mitsubishi Chemical Group Corporation
- Mitsui Chemicals, Inc.
- Neste Oyj
- Reliance Industries Limited
- SABIC
- Solvay SA
- Veolia Environnement SA
The Global Circular Economy Chemicals Market was valued at USD 228.4 billion in 2024 and is estimated to grow at a CAGR of 13.5% to reach USD 812.3 billion by 2034.
This industry includes polymers, resins, organic and inorganic chemicals, intermediate materials, and specialty chemicals derived from mechanical and chemical recycling, bio-based feedstocks, and industrial waste recovery. Growth in this sector is accelerating as regulatory frameworks evolve, sustainability commitments intensify, and advanced recycling technologies reach greater maturity. Three major shifts are reshaping the landscape: the large-scale development of chemical and advanced recycling plants for difficult waste streams, the adoption of circular business models across major industrial verticals, and the expansion of certification systems and mass balance approaches that allow companies to verify and commercialize circular content. These trends are generating substantial new demand for circular chemicals across packaging, mobility, electronics, and consumer goods. As industries work toward decarbonization and reduced waste, the circular economy chemicals market continues to gain traction as companies explore innovative pathways to close material loops and reduce their dependence on traditional fossil-based feedstocks.
| Market Scope | |
|---|---|
| Start Year | 2024 |
| Forecast Year | 2025-2034 |
| Start Value | $228.4 Billion |
| Forecast Value | $812.3 Billion |
| CAGR | 13.5% |
The circular polymers and plastics segment held a 38% share in 2024 and is expected to grow at a CAGR of 13.5% through 2034. Their dominance stems from the immense global consumption of plastics across packaging, construction, automotive components, electronics, and household products. Rising pressure to reduce plastic waste and improve recycling rates has intensified the need for circular alternatives that can support both environmental and industrial performance requirements.
The mechanical recycling segment accounted for a 32% share in 2024 and is projected to grow at a CAGR of 11.8% between 2025 and 2034. This method maintains its leading position due to its cost-efficiency and practical applicability across post-consumer and post-industrial plastic streams. Its relatively straightforward processing methods make it a widely adopted solution for many end-use industries seeking economical recycling options.
Europe Circular Economy Chemicals Market generated USD 61.7 billion in 2024, reflecting its strong presence in the global circular economy chemicals sector. The region benefits from advanced waste management systems, ambitious policy directives, and extensive recycling infrastructure. Comprehensive initiatives aimed at increasing recycling rates and improving product circularity continue to support the region's leadership as it pushes toward more sustainable chemical production and waste reduction.
Key companies active in the Global Circular Economy Chemicals Market include BASF SE, Borealis AG, Braskem S.A., Carbios SA, Covestro AG, Dow Inc., DSM-Firmenich, Eastman Chemical Company, Evonik Industries AG, INEOS Group, LG Chem Ltd., Loop Industries Inc., LyondellBasell Industries N.V., Mitsubishi Chemical Group Corporation, Mitsui Chemicals, Inc., Neste Oyj, Reliance Industries Limited, SABIC, Solvay S.A., and Veolia Environnement S.A. Companies operating in the Global Circular Economy Chemicals Market are adopting several strategies to reinforce their competitive standing. Many are expanding partnerships with waste management firms to secure stable access to recycled feedstocks and enhance material traceability. Investments in advanced recycling technologies, such as depolymerization and solvent-based recovery, are helping companies improve output quality and broaden application potential. Firms are also scaling bio-based production capacities to diversify beyond fossil-derived inputs.
Table of Contents
Chapter 1 Methodology & Scope
- 1.1 Market scope and definition
- 1.2 Research design
- 1.2.1 Research approach
- 1.2.2 Data collection methods
- 1.3 Data mining sources
- 1.3.1 Global
- 1.3.2 Regional/Country
- 1.4 Base estimates and calculations
- 1.4.1 Base year calculation
- 1.4.2 Key trends for market estimation
- 1.5 Primary research and validation
- 1.5.1 Primary sources
- 1.6 Forecast model
- 1.7 Research assumptions and limitations
Chapter 2 Executive Summary
- 2.1 Industry 3600 synopsis
- 2.2 Key market trends
- 2.2.1 Regional
- 2.2.2 Type
- 2.2.3 Process
- 2.2.4 End Use Industry
- 2.3 TAM Analysis, 2025-2034
- 2.4 CXO perspectives: Strategic imperatives
- 2.4.1 Executive decision points
- 2.4.2 Critical success factors
- 2.5 Future Outlook and Strategic Recommendations
Chapter 3 Industry Insights
- 3.1 Industry ecosystem analysis
- 3.1.1 Supplier landscape
- 3.1.2 Profit margin
- 3.1.3 Value addition at each stage
- 3.1.4 Factor affecting the value chain
- 3.1.5 Disruptions
- 3.2 Industry impact forces
- 3.2.1 Growth drivers
- 3.2.2 Industry pitfalls and challenges
- 3.2.3 Market opportunities
- 3.3 Growth potential analysis
- 3.4 Regulatory landscape
- 3.4.1 North America
- 3.4.2 Europe
- 3.4.3 Asia Pacific
- 3.4.4 Latin America
- 3.4.5 Middle East & Africa
- 3.5 Porter's analysis
- 3.6 PESTEL analysis
- 3.7 Price trends
- 3.7.1 By region
- 3.7.2 By type
- 3.8 Future market trends
- 3.9 Technology and Innovation landscape
- 3.9.1 Current technological trends
- 3.9.2 Emerging technologies
- 3.10 Patent Landscape
- 3.11 Trade statistics (HS code) (Note: the trade statistics will be provided for key countries only)
- 3.11.1 Major importing countries
- 3.11.2 Major exporting countries
- 3.12 Sustainability and environmental aspects
- 3.12.1 Sustainable practices
- 3.12.2 Waste reduction strategies
- 3.12.3 Energy efficiency in production
- 3.12.4 Eco-friendly initiatives
- 3.13 Carbon footprint consideration
Chapter 4 Competitive Landscape, 2024
- 4.1 Introduction
- 4.2 Company market share analysis
- 4.2.1 By region
- 4.2.1.1 North America
- 4.2.1.2 Europe
- 4.2.1.3 Asia Pacific
- 4.2.1.4 LATAM
- 4.2.1.5 MEA
- 4.2.1 By region
- 4.3 Company matrix analysis
- 4.4 Competitive analysis of major market players
- 4.5 Competitive positioning matrix
- 4.6 Key developments
- 4.6.1 Mergers & acquisitions
- 4.6.2 Partnerships & collaborations
- 4.6.3 New Product Launches
- 4.6.4 Expansion Plans
Chapter 5 Market Estimates and Forecast, By Type, 2021-2034 (USD Billion) (Kilo Tons)
- 5.1 Key trends
- 5.2 Circular Polymers & Plastics
- 5.3 Circular Solvents
- 5.4 Recovered Metals & Inorganic Chemicals
- 5.5 Bio-Chemicals
- 5.6 CO2-Based Chemicals
- 5.7 Recovered Specialty Chemicals
Chapter 6 Market Estimates and Forecast, By Process, 2021-2034 (USD Billion) (Kilo Tons)
- 6.1 Key trends
- 6.2 Mechanical Recycling
- 6.3 Chemical Recycling
- 6.4 Biological/Enzymatic Processing
- 6.5 CO2 Capture & Utilization (CCU)
- 6.6 Biorefining
- 6.7 Solvent Recovery & Purification
Chapter 7 Market Estimates and Forecast, By End Use Industry, 2021-2034 (USD Billion) (Kilo Tons)
- 7.1 Key trends
- 7.2 Packaging
- 7.2.1 Flexible Packaging
- 7.2.2 Rigid Packaging
- 7.2.3 Industrial & Transport Packaging
- 7.2.4 Compostable & Biodegradable Packaging
- 7.3 Automotive & Transportation
- 7.3.1 Interior Components
- 7.3.2 Exterior & Structural Components
- 7.3.3 Under-the-Hood & Powertrain
- 7.3.4 Electrical & Electronic Systems
- 7.3.5 Coatings & Surface Protection
- 7.4 Construction & Building Materials
- 7.4.1 Insulation Materials
- 7.4.2 Structural & Finishing Materials
- 7.4.3 Adhesives, Sealants & Coatings
- 7.4.4 Piping & Infrastructure
- 7.5 Textiles & Apparel
- 7.5.1 Fashion & Apparel
- 7.5.2 Home Textiles & Furnishings
- 7.5.3 Technical & Industrial Textiles
- 7.6 Agriculture
- 7.6.1 Agricultural Films
- 7.6.2 Fertilizers & Soil Amendments
- 7.6.3 Crop Protection & Agricultural Chemicals
- 7.6.4 Irrigation & Water Management
- 7.7 Electronics & Electrical
- 7.7.1 Consumer Electronics
- 7.7.2 Industrial Electronics & Equipment
- 7.7.3 Energy Storage & Batteries
- 7.7.4 Wire, Cable & Electrical Infrastructure
- 7.8 Consumer Products & Personal Care
- 7.8.1 Personal Care Products
Chapter 8 Market Estimates and Forecast, By Region, 2021-2034 (USD Billion) (Kilo Tons)
- 8.1 Key trends
- 8.2 North America
- 8.2.1 U.S.
- 8.2.2 Canada
- 8.3 Europe
- 8.3.1 Germany
- 8.3.2 UK
- 8.3.3 France
- 8.3.4 Spain
- 8.3.5 Italy
- 8.3.6 Rest of Europe
- 8.4 Asia Pacific
- 8.4.1 China
- 8.4.2 India
- 8.4.3 Japan
- 8.4.4 Australia
- 8.4.5 South Korea
- 8.4.6 Rest of Asia Pacific
- 8.5 Latin America
- 8.5.1 Brazil
- 8.5.2 Mexico
- 8.5.3 Argentina
- 8.5.4 Rest of Latin America
- 8.6 Middle East and Africa
- 8.6.1 Saudi Arabia
- 8.6.2 South Africa
- 8.6.3 UAE
- 8.6.4 Rest of Middle East and Africa
Chapter 9 Company Profiles
- 9.1 BASF SE
- 9.2 Borealis AG
- 9.3 Braskem S.A.
- 9.4 Carbios SA
- 9.5 Covestro AG
- 9.6 Dow Inc.
- 9.7 DSM-Firmenich
- 9.8 Eastman Chemical Company
- 9.9 Evonik Industries AG
- 9.10 INEOS Group
- 9.11 LG Chem Ltd.
- 9.12 Loop Industries Inc.
- 9.13 LyondellBasell Industries N.V.
- 9.14 Mitsubishi Chemical Group Corporation
- 9.15 Mitsui Chemicals, Inc.
- 9.16 Neste Oyj
- 9.17 Reliance Industries Limited
- 9.18 SABIC
- 9.19 Solvay S.A.
- 9.20 Veolia Environnement S.A.
 温度控制租赁解决方案市场:按产品类型、温度范围、租赁期限、销售管道、最终用户产业和应用划分-全球预测,2026-2032年废油回收市场按原料类型、技术类型和最终用途划分,全球预测(2026-2032年)
 废弃物回收服务市场分析及预测(至2035年):依类型、产品类型、服务、技术、应用、材料类型、製程、最终用户、设备划分
 全球酒精饮料瓶回收市场规模、份额、趋势和成长分析报告(2026-2034)
 2026年全球化学品市场报告:循环经济视角
 全球废弃物回收服务市场-按产品、应用、地区和竞争格局分類的产业规模、份额、趋势、机会和预测(2021-2031年)
 纺织废弃物回收机械市场机会、成长要素、产业趋势分析及预测(2026年至2035年)
 2032年循环家具市场预测:按产品、材料、应用、最终用户和地区分類的全球分析全球废弃物堆肥技术市场预测(至2032年):按组件、部署模式、技术、应用、最终用户和地区划分超当地语系化废弃物收集和回收服务市场预测至2032年:按废弃物类别、经营模式、技术、最终用户和地区分類的全球分析