


 |
市场调查报告书
商品编码
1892722
微移动出行整合系统市场机会、成长驱动因素、产业趋势分析及预测(2025-2034年)Micro-Mobility Integration Systems Market Opportunity, Growth Drivers, Industry Trend Analysis, and Forecast 2025 - 2034 |
||||||
2024 年全球微行动整合系统市场价值为 20 亿美元,预计到 2034 年将以 16.4% 的复合年增长率成长至 87 亿美元。
随着微出行日益融入多模式网络,市场正经历一场变革,重塑整个产业的技术架构、营运策略和商业模式。融合多种城市出行方式的平台正在提升效率、便利性和可及性,从而促进公共和私人领域的应用。人工智慧和机器学习的应用正在革新车队管理,使营运商能够利用预测分析、自动化决策和动态资源分配。这些进步提高了营运效率,减少了停机时间,并提升了车队管理者的获利能力。欧洲各地,尤其是城市中心,对智慧出行解决方案的需求不断增长,进一步加速了其普及。政府和私人营运商正大力投资整合系统,以优化出行、缓解拥塞并提升用户体验。
| 市场范围 | |
|---|---|
| 起始年份 | 2024 |
| 预测年份 | 2025-2034 |
| 起始值 | 20亿美元 |
| 预测值 | 87亿美元 |
| 复合年增长率 | 16.4% |
2024年,硬体部分占据47%的市场份额,预计2025年至2034年将以16.1%的复合年增长率成长。生态系统中的硬体包括物联网设备、车载资讯系统单元和充电基础设施,例如有线和无线充电站、换电站、智慧门锁、GPS模组和诊断感测器。出厂预装的连接功能正日益成为标准配置,预计70%的新车队将配备某种形式的物联网整合。
到2024年,云端运算市场占有率将达到45%,预计到2034年将以17%的复合年增长率成长。 AWS、Azure和Google Cloud等云端服务供应商提供的云端平台可提供可扩展的应用软体、分析引擎和维运工具。采用云端运算可以减少对实体伺服器管理的需求,加快部署速度,支援行动访问,并实现自动更新。
2024年,德国微出行整合系统市占率达28%。众多公司在多个城市营运无桩车辆,为使用者提供广泛的共享滑板车和自行车服务。诸如城市地区车队数量上限等监管框架,有助于控制市场成长并确保安全,同时支持永续的城市交通发展。
目录
第一章:方法论与范围
第二章:执行概要
第三章:行业洞察
- 产业生态系分析
- 供应商格局
- 零件製造商
- 平台提供者
- 连线和网路供应商
- 系统整合商和顾问
- 最终用途
- 支援服务
- 成本结构
- 利润率
- 每个阶段的价值增加
- 垂直整合趋势
- 颠覆者
- 供应商格局
- 对力的影响
- 成长驱动因素
- 都市化与最后一公里需求
- 科技与连接
- 永续性和监管支持
- 充电和电池基础设施
- 产业陷阱与挑战
- 前期整合成本高且监管复杂
- 安全风险和互通性问题
- 市场机会
- 进阶资料货币化与分析
- 向新兴城市扩张
- 成长驱动因素
- 技术趋势与创新生态系统
- 目前技术
- 人工智慧与机器学习集成
- 预测性维护技术
- 自主再平衡系统
- 电池更换基础设施
- 新兴技术
- 5G 和边缘运算应用
- 区块链在支付和身份识别的应用
- 自主车队优化
- 智慧电池更换和充电基础设施中的数位孪生
- 目前技术
- 成长潜力分析
- 监管环境
- 联邦法规
- 州和市级许可证要求
- 资料共享要求
- 安全标准
- 隐私与资料保护
- 区域监管比较
- 北美洲
- 欧洲
- 亚太
- 拉丁美洲
- 中东和非洲
- 波特的分析
- PESTEL 分析
- 专利分析
- 成本細項分析
- 价格趋势
- 竞争性定价策略
- 软体许可价格范围
- 专业服务费率
- 供应商收入模式及策略
- 投资与融资分析
- 创投与私募股权趋势
- 地理投资分布
- 分阶段融资分析
- 重大交易
- 从关注成长转向关注获利能力
- 专利分析
- 电池更换技术专利
- 车队管理系统专利
- 物联网及连接专利
- 充电基础设施专利
- 主要专利持有人和受让人
- 永续性和环境方面
- 永续实践
- 减少废弃物策略
- 生产中的能源效率
- 环保倡议
- 碳足迹考量
- 市场采纳与渗透分析
- 技术采纳生命週期
- 采用障碍和促进因素
- 市场渗透率分析
- 客户决策历程
- 用例分析及应用场景
- 用例框架及选择标准
- 系统需求和整合点
- 支付系统集成
- 用例比较矩阵
- 客户旅程与体验地图
- 车队营运商
- 市/镇
- 公车机构
- 旅游即服务 (MaaS) 供应商
- 旅程比较矩阵
- 风险评估与风险矩阵
- 风险识别方法
- 风险评分法
- 热图可视化
- 风险监测与预警指标
- 采纳与扩散曲线分析
- 创新扩散框架
- 车队管理平台采用
- 电池更换基础设施采用
- 地理扩散模式
- 技术替代曲线
第四章:竞争格局
- 介绍
- 公司市占率分析
- 北美洲
- 欧洲
- 亚太
- 拉丁美洲
- 中东和非洲
- 竞争定位矩阵
- 战略展望矩阵
- 关键进展
- 併购
- 合作伙伴关係与合作
- 新产品发布
- 扩张计划和资金
- 高端定位策略
- 竞争分析与独特卖点
第五章:市场估算与预测:依组件划分,2021-2034年
- 软体平台
- 车队管理
- 预约系统
- 支付和帐单系统
- 分析与报告
- 骑士应用程式/用户介面
- 操作员仪錶板
- 硬体
- 物联网设备/感测器
- GPS追踪器/导航模组
- 智慧锁
- 电池管理系统
- 车用控制器
- 充电桩/充电站
- 服务
- 咨询顾问
- 系统整合
- 安装与部署
- 维护与维修
- 客户支援/服务台
- 培训与入职
第六章:市场估计与预测:依技术划分,2021-2034年
- 车队管理和追踪系统
- 支付与帐单集成
- 物联网连线与远端资讯处理
- 充电和电池管理
- 数据分析与报告
- 地理围篱和合规工具
第七章:市场估算与预测:依部署模式划分,2021-2034年
- 云
- 杂交种
- 现场
第八章:市场估算与预测:依车辆类型划分,2021-2034年
- 电动滑板车
- 电动自行车
- 脚踏自行车
- 电动轻型机车
- 其他的
第九章:市场估算与预测:依最终用途划分,2021-2034年
- 车队营运商
- 市政当局
- 大学及企业园区
- 快递公司
- 其他的
第十章:市场估计与预测:依地区划分,2021-2034年
- 北美洲
- 我们
- 加拿大
- 欧洲
- 英国
- 德国
- 法国
- 义大利
- 西班牙
- 比利时
- 荷兰
- 瑞典
- 俄罗斯
- 亚太地区
- 中国
- 印度
- 日本
- 澳洲
- 新加坡
- 韩国
- 越南
- 印尼
- 拉丁美洲
- 巴西
- 墨西哥
- 阿根廷
- MEA
- 南非
- 沙乌地阿拉伯
- 阿联酋
第十一章:公司简介
- Software / platform providers
- ATOM Mobility
- Fifteen
- INVERS
- Joyride
- Movatic
- Passport
- Remix (Via)
- Ridecell
- Roam.ai
- Splyt
- Urban Sharing
- Vulog
- Wunder Mobility
- ZOBA
- Data & analytics platforms
- Fluctuo
- Populus
- Ride Report
- Vianova
- IoT & connectivity providers
- IoT
- Comodule
- KNOT
- Omni
- Onomondo
- Teltonika
- Computer Vision & AI
- Drover AI
- Luna Systems
- Battery & charging infrastructure
- Ample
- Gogoro
- Swiftmile
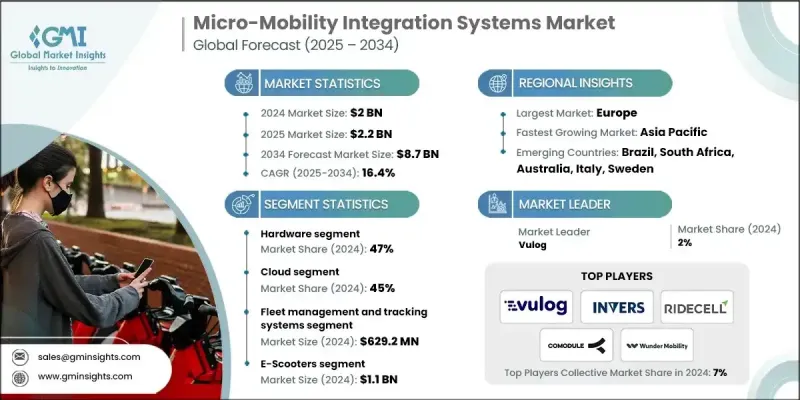
The Global Micro-Mobility Integration Systems Market was valued at USD 2 billion in 2024 and is estimated to grow at a CAGR of 16.4% to reach USD 8.7 billion by 2034.
The market is undergoing a transformation as micro-mobility becomes increasingly integrated into multimodal transportation networks, reshaping technology architecture, operational strategies, and business models across the industry. Platforms that combine various forms of urban mobility are driving efficiency, convenience, and accessibility, encouraging both public and private adoption. Fleet management is being revolutionized through the adoption of artificial intelligence and machine learning, allowing operators to leverage predictive analytics, automated decision-making, and dynamic resource allocation. These advancements are increasing operational efficiency, reducing downtime, and improving profitability for fleet managers. The growing demand for smart mobility solutions across Europe, particularly in urban centers, is further accelerating adoption, as governments and private operators invest heavily in integrated systems to optimize mobility, reduce congestion, and enhance user experience.
| Market Scope | |
|---|---|
| Start Year | 2024 |
| Forecast Year | 2025-2034 |
| Start Value | $2 Billion |
| Forecast Value | $8.7 Billion |
| CAGR | 16.4% |
The hardware segment held a 47% share in 2024 and is projected to grow at a CAGR of 16.1% from 2025 to 2034. Hardware in the ecosystem includes IoT devices, telematics units, and charging infrastructure, such as wired and wireless charging stations, battery swap stations, smart locks, GPS modules, and diagnostic sensors. Factory-installed connectivity is increasingly standard, with an estimated seventy percent of new fleets expected to feature some form of IoT integration.
The cloud segment accounted for a 45% share in 2024 and is anticipated to grow at a CAGR of 17% through 2034. Cloud platforms hosted by providers like AWS, Azure, and Google Cloud offer scalable application software, analytical engines, and operational tools. Cloud adoption reduces the need for physical server management, accelerates implementation, allows mobile access, and enables automatic updates.
Germany Micro-Mobility Integration Systems Market held a 28% share in 2024. Numerous companies operate dockless vehicles across multiple cities, providing widespread access to scooters and bike-sharing services. Regulatory frameworks, such as fleet caps in urban areas, are helping manage growth and ensure safety while supporting sustainable urban mobility expansion.
Major players in the Micro-Mobility Integration Systems Market include Atom Mobility, Comodule, INVERS, Joyride, Ridecell, Roam.ai, Urban Sharing, Vulog, Wunder Mobility, and Splyt. Companies in the Micro-Mobility Integration Systems Market are expanding their presence by investing in AI-driven fleet management and predictive analytics to improve vehicle uptime and operational efficiency. They are integrating IoT-enabled hardware and smart charging infrastructure to provide seamless connectivity and enhance the user experience. Strategic partnerships with local authorities, mobility operators, and technology providers allow companies to scale rapidly in urban markets. Cloud-based solutions and platform interoperability are prioritized to facilitate multimodal transportation integration and streamline operations.
Table of Contents
Chapter 1 Methodology & Scope
- 1.1 Research design
- 1.1.1 Research approach
- 1.1.2 Data collection methods
- 1.2 Base estimates and calculations
- 1.2.1 Base year calculation
- 1.2.2 Key trends for market estimates
- 1.3 Forecast
- 1.4 Primary research and validation
- 1.5 Some of the primary sources
- 1.6 Data mining sources
- 1.6.1 Secondary
- 1.6.1.1 Paid Sources
- 1.6.1.2 Public Sources
- 1.6.1.3 Sources, by region
- 1.6.1 Secondary
- 1.7 Inclusion & Exclusion
Chapter 2 Executive Summary
- 2.1 Industry 3600 synopsis
- 2.2 Key market trends
- 2.2.1 Regional
- 2.2.2 Component
- 2.2.3 Technology
- 2.2.4 Deployment mode
- 2.2.5 Vehicle
- 2.2.6 End use
- 2.3 TAM Analysis, 2025-2034
- 2.4 CXO perspectives: Strategic imperatives
- 2.4.1 Key decision points for industry executives
- 2.4.2 Critical success factors for market players
- 2.5 Future outlook and strategic recommendations
Chapter 3 Industry Insights
- 3.1 Industry ecosystem analysis
- 3.1.1 Supplier landscape
- 3.1.1.1 Component manufacturers
- 3.1.1.2 Platform providers
- 3.1.1.3 Connectivity & network providers
- 3.1.1.4 System integrators & consultants
- 3.1.1.5 End use
- 3.1.1.6 Supporting services
- 3.1.2 Cost structure
- 3.1.3 Profit margin
- 3.1.4 Value addition at each stage
- 3.1.5 Vertical integration trends
- 3.1.6 Disruptors
- 3.1.1 Supplier landscape
- 3.2 Impact on forces
- 3.2.1 Growth drivers
- 3.2.1.1 Urbanization & last-mile demand
- 3.2.1.2 Technology & connectivity
- 3.2.1.3 Sustainability & regulatory support
- 3.2.1.4 Charging & battery infrastructure
- 3.2.2 Industry pitfalls & challenges
- 3.2.2.1 High upfront integration & regulatory complexity
- 3.2.2.2 Safety risks & interoperability issues
- 3.2.3 Market opportunities
- 3.2.3.1 Advanced data monetization & analytics
- 3.2.3.2 Expansion to emerging cities
- 3.2.1 Growth drivers
- 3.3 Technology trends & innovation ecosystem
- 3.3.1 Current technologies
- 3.3.1.1 AI & machine learning integration
- 3.3.1.2 Predictive maintenance technologies
- 3.3.1.3 Autonomous rebalancing systems
- 3.3.1.4 Battery swapping infrastructure
- 3.3.2 Emerging technologies
- 3.3.2.1 5G & edge computing applications
- 3.3.2.2 Blockchain for payments & identity
- 3.3.2.3 Autonomous fleet optimization
- 3.3.2.4 Digital twins in smart battery swapping and charging infrastructure
- 3.3.1 Current technologies
- 3.4 Growth potential analysis
- 3.5 Regulatory landscape
- 3.5.1 Federal regulations
- 3.5.2 State & municipal permitting requirements
- 3.5.3 Data sharing mandates
- 3.5.4 Safety standards
- 3.5.5 Privacy & data protection
- 3.5.6 Regional regulatory comparison
- 3.5.6.1 North America
- 3.5.6.2 Europe
- 3.5.6.3 Asia-Pacific
- 3.5.6.4 Latin America
- 3.5.6.5 Middle East & Africa
- 3.6 Porter's analysis
- 3.7 PESTEL analysis
- 3.8 Patent analysis
- 3.9 Cost breakdown analysis
- 3.10 Price trends
- 3.10.1 Competitive pricing strategies
- 3.10.2 Software licensing price ranges
- 3.10.3 Professional services rates
- 3.10.4 Vendor revenue models & strategies
- 3.11 Investment & Funding Analysis
- 3.11.1 Venture capital & private equity trends
- 3.11.2 Geographic investment distribution
- 3.11.3 Stage-wise funding analysis
- 3.11.4 Major deals & transactions
- 3.11.5 Shift from growth to profitability focus
- 3.12 Patent analysis
- 3.12.1 Battery swapping technology patents
- 3.12.2 Fleet management system patents
- 3.12.3 IoT & connectivity patents
- 3.12.4 Charging infrastructure patents
- 3.12.5 Key patent holders & assignees
- 3.13 Sustainability and environmental aspects
- 3.13.1 Sustainable practices
- 3.13.2 Waste reduction strategies
- 3.13.3 Energy efficiency in production
- 3.13.4 Eco-friendly initiatives
- 3.13.5 Carbon footprint considerations
- 3.14 Market adoption & penetration analysis
- 3.14.1 Technology adoption lifecycle
- 3.14.2 Adoption barriers & enablers
- 3.14.3 Market penetration analysis
- 3.14.4 Customer decision journey
- 3.15 Use case analysis & application scenarios
- 3.15.1 Use case framework & selection criteria
- 3.15.2 System requirements & integration points
- 3.15.3 Payment system integration
- 3.15.4 Use case comparison matrix
- 3.16 Customer Journey & Experience Mapping
- 3.16.1 Fleet operator
- 3.16.2 Municipality/city
- 3.16.3 Transit agency
- 3.16.4 MaaS provider
- 3.16.5 Journey comparison matrix
- 3.17 Risk assessment & risk matrix
- 3.17.1 Risk identification methodology
- 3.17.2 Risk scoring methodology
- 3.17.3 Heat map visualization
- 3.17.4 Risk monitoring & early warning indicators
- 3.18 Adoption & diffusion curve analysis
- 3.18.1 Diffusion of innovation framework
- 3.18.2 Fleet management platform adoption
- 3.18.3 Battery swapping infrastructure adoption
- 3.18.4 Geographic diffusion patterns
- 3.18.5 Technology substitution curves
Chapter 4 Competitive Landscape, 2024
- 4.1 Introduction
- 4.2 Company market share analysis
- 4.2.1 North America
- 4.2.2 Europe
- 4.2.3 Asia-Pacific
- 4.2.4 Latin America
- 4.2.5 Middle East & Africa
- 4.3 Competitive positioning matrix
- 4.4 Strategic outlook matrix
- 4.5 Key developments
- 4.5.1 Mergers & acquisitions
- 4.5.2 Partnerships & collaborations
- 4.5.3 New product launches
- 4.5.4 Expansion plans and funding
- 4.6 Premium positioning strategies
- 4.7 Competitive analysis and USPs
Chapter 5 Market Estimates & Forecast, By Component, 2021 - 2034 ($Bn, units)
- 5.1 Key trends
- 5.1.1 Software Platforms
- 5.1.1.1 Fleet management
- 5.1.1.2 Booking systems
- 5.1.1.3 Payment & billing systems
- 5.1.1.4 Analytics & reporting
- 5.1.1.5 Rider apps / user interface
- 5.1.1.6 Operator dashboards
- 5.1.2 Hardware
- 5.1.2.1 IoT devices / sensors
- 5.1.2.2 GPS trackers / navigation modules
- 5.1.2.3 Smart locks
- 5.1.2.4 Battery management systems
- 5.1.2.5 Vehicle-mounted controllers
- 5.1.2.6 Charging docks / stations
- 5.1.3 Services
- 5.1.3.1 Consulting & advisory
- 5.1.3.2 System integration
- 5.1.3.3 Installation & deployment
- 5.1.3.4 Maintenance & repair
- 5.1.3.5 Customer support / helpdesk
- 5.1.3.6 Training & onboarding
- 5.1.1 Software Platforms
Chapter 6 Market Estimates & Forecast, By Technology, 2021 - 2034 ($Bn, units)
- 6.1 Key trends
- 6.2 Fleet management & tracking systems
- 6.3 Payment & billing integration
- 6.4 IoT connectivity & telematics
- 6.5 Charging & battery management
- 6.6 Data analytics & reporting
- 6.7 Geofencing & compliance tools
Chapter 7 Market Estimates & Forecast, By Deployment mode, 2021 - 2034 ($Bn, units)
- 7.1 Key trends
- 7.2 Cloud
- 7.3 Hybrid
- 7.4 On-premises
Chapter 8 Market Estimates & Forecast, By Vehicle, 2021 - 2034 ($Bn, units)
- 8.1 Key trends
- 8.2 E-scooters
- 8.3 E-bikes
- 8.4 Pedal bikes
- 8.5 E-mopeds
- 8.6 Others
Chapter 9 Market Estimates & Forecast, By End Use, 2021 - 2034 ($Bn, units)
- 9.1 Key trends
- 9.2 Fleet operators
- 9.3 Municipalities
- 9.4 Universities & corporate campuses
- 9.5 Delivery companies
- 9.6 Others
Chapter 10 Market Estimates & Forecast, By Region, 2021 - 2034 ($Bn, units)
- 10.1 North America
- 10.1.1 US
- 10.1.2 Canada
- 10.2 Europe
- 10.2.1 UK
- 10.2.2 Germany
- 10.2.3 France
- 10.2.4 Italy
- 10.2.5 Spain
- 10.2.6 Belgium
- 10.2.7 Netherlands
- 10.2.8 Sweden
- 10.2.9 Russia
- 10.3 Asia Pacific
- 10.3.1 China
- 10.3.2 India
- 10.3.3 Japan
- 10.3.4 Australia
- 10.3.5 Singapore
- 10.3.6 South Korea
- 10.3.7 Vietnam
- 10.3.8 Indonesia
- 10.4 Latin America
- 10.4.1 Brazil
- 10.4.2 Mexico
- 10.4.3 Argentina
- 10.5 MEA
- 10.5.1 South Africa
- 10.5.2 Saudi Arabia
- 10.5.3 UAE
Chapter 11 Company Profiles
- 11.1 Software / platform providers
- 11.1.1 ATOM Mobility
- 11.1.2 Fifteen
- 11.1.3 INVERS
- 11.1.4 Joyride
- 11.1.5 Movatic
- 11.1.6 Passport
- 11.1.7 Remix (Via)
- 11.1.8 Ridecell
- 11.1.9 Roam.ai
- 11.1.10 Splyt
- 11.1.11 Urban Sharing
- 11.1.12 Vulog
- 11.1.13 Wunder Mobility
- 11.1.14 ZOBA
- 11.2 Data & analytics platforms
- 11.2.1 Fluctuo
- 11.2.2 Populus
- 11.2.3 Ride Report
- 11.2.4 Vianova
- 11.3 IoT & connectivity providers
- 11.3.1. IoT
- 11.3.2 Comodule
- 11.3.3 KNOT
- 11.3.4 Omni
- 11.3.5 Onomondo
- 11.3.6 Teltonika
- 11.4 Computer Vision & AI
- 11.4.1 Drover AI
- 11.4.2 Luna Systems
- 11.5 Battery & charging infrastructure
- 11.5.1 Ample
- 11.5.2 Gogoro
- 11.5.3 Swiftmile
 医疗保健IT市场分析及预测(至2035年):按类型、产品类型、服务、技术、组件、应用、部署类型、最终用户、解决方案和模式划分医疗保健工作流程的人工智慧市场分析及预测(至2035年):按类型、产品、服务、技术、组件、应用、部署类型、最终用户、功能和解决方案划分医疗保健资讯系统市场分析及预测(至2035年):按类型、产品类型、服务、技术、组件、应用、部署类型、最终用户、功能和解决方案划分智慧型设备整合市场分析及预测(至2035年,医疗保健领域):按类型、产品类型、服务、技术、组件、应用、最终用户、部署模式、功能及解决方案划分
 医疗保健IT市场规模、份额和趋势分析报告:按应用、交付模式、最终用途、地区和细分市场预测(2026-2033年)
 2025-2029年全球医疗资讯系统市场
 2026-2030年全球医疗保健IT市场
 医药知识管理软体市场-全球产业规模、份额、趋势、机会、预测:按部署方式、组织规模、地区和竞争格局划分,2021-2031年
 临床资讯管理系统市场按组件、交付模式、组织规模、应用、最终用户和部署模式划分 - 全球预测(2026-2032 年)手术室中央控制系统市场按类型、部署模式、应用和最终用户划分,全球预测(2026-2032年)