


 |
市场调查报告书
商品编码
1892757
罐装鲔鱼市场机会、成长驱动因素、产业趋势分析及预测(2026-2035年)Canned Tuna Market Opportunity, Growth Drivers, Industry Trend Analysis, and Forecast 2026 - 2035 |
||||||
2025 年全球罐装鲔鱼市场价值为 125 亿美元,预计到 2035 年将以 4.5% 的复合年增长率增长至 194 亿美元。
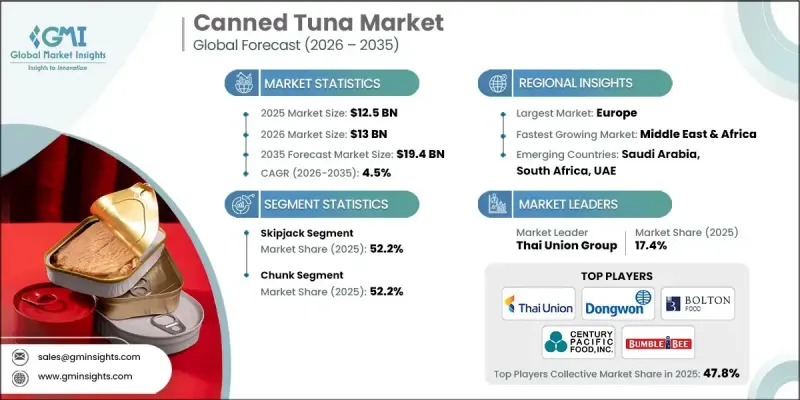
罐装鲔鱼是一种经过加工的海鲜,将鲔鱼与油、水或盐水一起储存在罐头中,是一种方便且保质期长的蛋白质来源。其价格实惠、营养丰富且易于烹饪,使其成为世界各地家庭的必备食品。消费者对高蛋白饮食和更健康食品的需求日益增长,推动了罐装鲔鱼的需求,因为它提供了一种优质的瘦蛋白来源,非常适合注重健身的人士。世界各国政府和卫生组织都鼓励人们摄取蛋白质,尤其是在老年人和注重健康的年轻人群体中,并强调罐装鲔鱼在维持整体健康和支持饮食目标方面的重要作用。
| 市场范围 | |
|---|---|
| 起始年份 | 2025 |
| 预测年份 | 2026-2035 |
| 起始值 | 125亿美元 |
| 预测值 | 194亿美元 |
| 复合年增长率 | 4.5% |
鲣鱼在2024年占据了52.2%的市场份额,预计到2035年将以4.6%的复合年增长率增长。其广泛的分布、低廉的价格和清淡的口味是其主导市场的主要原因。热带海域为鲣鱼提供了丰富的资源,降低了生产商的采购成本,使其能够以更具竞争力的价格出售。稳定的供应链和消费者对清淡口味的偏好进一步巩固了其市场地位。
2025年,块状鲔鱼市占率达到52.2%,并凭藉其诱人的口感和多功能性继续保持领先地位。块状鲔鱼深受消费者和食品生产商的喜爱,常用于沙拉、三明治和即食食品,使其成为零售和餐饮通路的热门产品。
预计2026年至2035年间,北美罐装鲔鱼市场将以4.6%的复合年增长率成长,其中仅美国市场在2025年就将达到30亿美元。消费者对健康和永续发展意识的不断增强,推动了对来源可靠和有机罐装鲔鱼的需求。製造商正采用环保的捕捞方式,使用选择性渔具和船舶追踪技术,以确保永续捕捞。包装创新,例如轻质和可回收材料,在满足监管和行业可持续发展标准的同时,也进一步吸引了具有环保意识的消费者。
目录
第一章:方法论与范围
第二章:执行概要
第三章:行业洞察
- 产业生态系分析
- 供应商格局
- 利润率
- 每个阶段的价值增加
- 影响价值链的因素
- 中断
- 产业影响因素
- 成长驱动因素
- 增加蛋白质饮食
- 食品业的扩张
- 便利性趋势推动了风味包装和袋装产品的出现。
- 产业陷阱与挑战
- 鲔鱼价格波动
- 来自其他蛋白质的竞争
- 市场机会
- 对即食蛋白质产品的需求不断增长
- 人们对环保包装的兴趣日益浓厚
- 成长驱动因素
- 成长潜力分析
- 监管环境
- 北美洲
- 欧洲
- 亚太地区
- 拉丁美洲
- 中东和非洲
- 波特的分析
- PESTEL 分析
- 价格趋势
- 按地区
- 按类型
- 未来市场趋势
- 技术与创新格局
- 当前技术趋势
- 新兴技术
- 专利格局
- 贸易统计(HS编码)(註:仅提供重点国家的贸易统计资料)
- 主要进口国
- 主要出口国
- 永续性和环境方面
- 永续实践
- 减少废弃物策略
- 生产中的能源效率
- 环保倡议
- 碳足迹考量
第四章:竞争格局
- 介绍
- 公司市占率分析
- 按地区
- 北美洲
- 欧洲
- 亚太地区
- 拉丁美洲
- MEA
- 按地区
- 公司矩阵分析
- 主要市场参与者的竞争分析
- 竞争定位矩阵
- 关键进展
- 併购
- 合作伙伴关係与合作
- 新产品发布
- 扩张计划
第五章:市场估算与预测:依类型划分,2022-2035年
- 长鳍鲔鱼
- 鲣鱼
- 黄鳍鲔鱼
- 大眼
- 蓝鳍鲔鱼
- Tongol/长尾
- 其他的
第六章:市场估算与预测:依产品形式划分,2022-2035年
- 坚硬的
- 区块
- 薄片
- 熏製
- 其他的
第七章:市场估算与预测:依容器类型划分,2022-2035年
- 金属罐
- 软包装袋(蒸煮袋)
- 玻璃罐
- 其他的
第八章:市场估算与预测:依最终用途划分,2022-2035年
- 零售/家庭消费
- 餐饮服务(餐厅、饭店、餐饮承办)
- 机构(学校、医院、军队、企业)
- 食品加工与製造
- 宠物食品
- 其他的
第九章:市场估算与预测:依配销通路划分,2022-2035年
- 大型零售商(超商、大型超商、仓储式会员店)
- 便利商店
- 线上零售与电子商务
- 特色食品健康食品店
- 餐饮服务分销商
- 出口/国际分销商
- 其他的
第十章:市场估计与预测:依地区划分,2022-2035年
- 北美洲
- 我们
- 加拿大
- 欧洲
- 德国
- 英国
- 法国
- 西班牙
- 义大利
- 欧洲其他地区
- 亚太地区
- 中国
- 印度
- 日本
- 澳洲
- 韩国
- 亚太其他地区
- 拉丁美洲
- 巴西
- 墨西哥
- 阿根廷
- 拉丁美洲其他地区
- 中东和非洲
- 沙乌地阿拉伯
- 南非
- 阿联酋
- 中东和非洲其他地区
第十一章:公司简介
- American Tuna
- Bumble Bee Foods
- Century Pacific Food
- Crown Prince
- Dongwon Group
- Nauterra
- Princes Food
- Safe Catch
- StarKist Co.
- Thai Union Group
- Wild Planet Foods
The Global Canned Tuna Market was valued at USD 12.5 billion in 2025 and is estimated to grow at a CAGR of 4.5% to reach USD 19.4 billion by 2035.
Canned tuna is a preserved seafood product where tuna is stored in cans with oil, water, or brine, offering a convenient and long-lasting source of protein. Its affordability, nutritional benefits, and ease of preparation make it a staple in households worldwide. Rising consumer interest in high-protein diets and healthier food options has fueled demand, as canned tuna provides a lean protein source ideal for fitness-conscious individuals. Governments and health organizations globally encourage protein consumption, particularly among the elderly and health-oriented younger populations, highlighting the role of canned tuna in maintaining overall wellness and supporting dietary goals.
| Market Scope | |
|---|---|
| Start Year | 2025 |
| Forecast Year | 2026-2035 |
| Start Value | $12.5 Billion |
| Forecast Value | $19.4 Billion |
| CAGR | 4.5% |
The skipjack tuna segment held a 52.2% share in 2024 and is expected to grow at a CAGR of 4.6% through 2035. Its widespread availability, low cost, and mild flavor contribute to its dominance. Tropical waters supply skipjack abundantly, reducing sourcing costs for manufacturers and enabling competitive pricing. Its steady supply chain and consumer preference for milder taste profiles further bolster its market position.
The chunk tuna segment accounted for a 52.2% share in 2025 and continues to lead due to its appealing texture and versatility. Chunk tuna is favored by consumers and food manufacturers alike for salads, sandwiches, and ready-to-eat meals, making it a highly sought-after product across retail and food service channels.
North America Canned Tuna Market is expected to grow at a CAGR of 4.6% between 2026 and 2035, with the U.S. alone accounting for USD 3 billion in 2025. Growing consumer awareness around health and sustainability is driving demand for responsibly sourced and organic canned tuna. Manufacturers are adopting eco-friendly fishing practices, using selective gear and vessel tracking technologies to ensure sustainable harvesting. Packaging innovations, including lightweight and recyclable materials, further appeal to environmentally conscious consumers while meeting regulatory and industry sustainability standards.
Key players in the Canned Tuna Market include American Tuna, Bumble Bee Foods, Century Pacific Food, Crown Prince, Dongwon Group, Nauterra, Princes Food, Safe Catch, StarKist Co., Thai Union Group, and Wild Planet Foods. Companies in the canned tuna market are enhancing their market foothold through strategies like sustainable sourcing and responsible fishing practices, which appeal to eco-conscious consumers and regulatory bodies. Investment in innovative, eco-friendly packaging reduces environmental impact while attracting premium buyers. Firms are also expanding their global distribution networks, forging strategic partnerships with retailers and food service providers to increase product availability. Marketing campaigns emphasizing health benefits, quality, and traceability help build brand loyalty. Additionally, companies focus on research and development to diversify product lines, including organic, low-sodium, and specialty flavored options, to cater to evolving consumer preferences and strengthen their competitive position.
Table of Contents
Chapter 1 Methodology & Scope
- 1.1 Market scope and definition
- 1.2 Research design
- 1.2.1 Research approach
- 1.2.2 Data collection methods
- 1.3 Data mining sources
- 1.3.1 Global
- 1.3.2 Regional/Country
- 1.4 Base estimates and calculations
- 1.4.1 Base year calculation
- 1.4.2 Key trends for market estimation
- 1.5 Primary research and validation
- 1.5.1 Primary sources
- 1.6 Forecast model
- 1.7 Research assumptions and limitations
Chapter 2 Executive Summary
- 2.1 Industry 360° synopsis
- 2.2 Key market trends
- 2.2.1 Regional
- 2.2.2 Type
- 2.2.3 Product form
- 2.2.4 Container type
- 2.2.5 End Use
- 2.2.6 Distribution channel
- 2.3 TAM Analysis, 2026-2035
- 2.4 CXO perspectives: Strategic imperatives
- 2.4.1 Executive decision points
- 2.4.2 Critical success factors
- 2.5 Future Outlook and Strategic Recommendations
Chapter 3 Industry Insights
- 3.1 Industry ecosystem analysis
- 3.1.1 Supplier landscape
- 3.1.2 Profit margin
- 3.1.3 Value addition at each stage
- 3.1.4 Factor affecting the value chain
- 3.1.5 Disruptions
- 3.2 Industry impact forces
- 3.2.1 Growth drivers
- 3.2.1.1 Increasing protein diet
- 3.2.1.2 Expansion of the food industry
- 3.2.1.3 Convenience trend driving flavored & pouch formats
- 3.2.2 Industry pitfalls and challenges
- 3.2.2.1 Price volatility of tuna
- 3.2.2.2 Competition from alternative proteins
- 3.2.3 Market opportunities
- 3.2.3.1 Growing demand for ready-to-eat protein options
- 3.2.3.2 Rising interest in eco-friendly packaging
- 3.2.1 Growth drivers
- 3.3 Growth potential analysis
- 3.4 Regulatory landscape
- 3.4.1 North America
- 3.4.2 Europe
- 3.4.3 Asia Pacific
- 3.4.4 Latin America
- 3.4.5 Middle East & Africa
- 3.5 Porter's analysis
- 3.6 PESTEL analysis
- 3.7 Price trends
- 3.7.1 By region
- 3.7.2 By type
- 3.8 Future market trends
- 3.9 Technology and Innovation landscape
- 3.9.1 Current technological trends
- 3.9.2 Emerging technologies
- 3.10 Patent Landscape
- 3.11 Trade statistics (HS code) ( Note: the trade statistics will be provided for key countries only)
- 3.11.1 Major importing countries
- 3.11.2 Major exporting countries
- 3.12 Sustainability and environmental aspects
- 3.12.1 Sustainable practices
- 3.12.2 Waste reduction strategies
- 3.12.3 Energy efficiency in production
- 3.12.4 Eco-friendly initiatives
- 3.13 Carbon footprint consideration
Chapter 4 Competitive Landscape, 2025
- 4.1 Introduction
- 4.2 Company market share analysis
- 4.2.1 By region
- 4.2.1.1 North America
- 4.2.1.2 Europe
- 4.2.1.3 Asia Pacific
- 4.2.1.4 LATAM
- 4.2.1.5 MEA
- 4.2.1 By region
- 4.3 Company matrix analysis
- 4.4 Competitive analysis of major market players
- 4.5 Competitive positioning matrix
- 4.6 Key developments
- 4.6.1 Mergers & acquisitions
- 4.6.2 Partnerships & collaborations
- 4.6.3 New Product Launches
- 4.6.4 Expansion Plans
Chapter 5 Market Estimates and Forecast, By Type, 2022-2035 (USD Billion) (Kilo Tons)
- 5.1 Key trends
- 5.2 Albacore
- 5.3 Skipjack
- 5.4 Yellowfin
- 5.5 Bigeye
- 5.6 Bluefin
- 5.7 Tongol/longtail
- 5.8 Others
Chapter 6 Market Estimates and Forecast, By Product Form, 2022-2035 (USD Billion) (Kilo Tons)
- 6.1 Key trends
- 6.2 Solid
- 6.3 Chunk
- 6.4 Flake
- 6.5 Smoked
- 6.6 Others
Chapter 7 Market Estimates and Forecast, By Container Type, 2022-2035 (USD Billion) (Kilo Tons)
- 7.1 Key trends
- 7.2 Metal cans
- 7.3 Flexible pouches (retort pouches)
- 7.4 Glass jars
- 7.5 Others
Chapter 8 Market Estimates and Forecast, By End Use, 2022-2035 (USD Billion) (Kilo Tons)
- 8.1 Key trends
- 8.2 Retail/household consumption
- 8.3 Foodservice (restaurants, hotels, catering)
- 8.4 Institutional (schools, hospitals, military, corporate)
- 8.5 Food processing & manufacturing
- 8.6 Pet food
- 8.7 Others
Chapter 9 Market Estimates and Forecast, By Distribution Channel, 2022-2035 (USD Billion) (Kilo Tons)
- 9.1 Key trends
- 9.2 Mass retailers (supermarkets, hypermarkets, warehouse clubs)
- 9.3 Convenience stores
- 9.4 Online retail & e-commerce
- 9.5 Specialty & health food stores
- 9.6 Foodservice distributors
- 9.7 Export/international distributors
- 9.8 Others
Chapter 10 Market Estimates and Forecast, By Region, 2022-2035 (USD Billion) (Kilo Tons)
- 10.1 Key trends
- 10.2 North America
- 10.2.1 U.S.
- 10.2.2 Canada
- 10.3 Europe
- 10.3.1 Germany
- 10.3.2 UK
- 10.3.3 France
- 10.3.4 Spain
- 10.3.5 Italy
- 10.3.6 Rest of Europe
- 10.4 Asia Pacific
- 10.4.1 China
- 10.4.2 India
- 10.4.3 Japan
- 10.4.4 Australia
- 10.4.5 South Korea
- 10.4.6 Rest of Asia Pacific
- 10.5 Latin America
- 10.5.1 Brazil
- 10.5.2 Mexico
- 10.5.3 Argentina
- 10.5.4 Rest of Latin America
- 10.6 Middle East and Africa
- 10.6.1 Saudi Arabia
- 10.6.2 South Africa
- 10.6.3 UAE
- 10.6.4 Rest of Middle East and Africa
Chapter 11 Company Profiles
- 11.1 American Tuna
- 11.2 Bumble Bee Foods
- 11.3 Century Pacific Food
- 11.4 Crown Prince
- 11.5 Dongwon Group
- 11.6 Nauterra
- 11.7 Princes Food
- 11.8 Safe Catch
- 11.9 StarKist Co.
- 11.10 Thai Union Group
- 11.11 Wild Planet Foods
 罐装鲔鱼市场规模、份额、成长及全球产业分析:按类型、应用和地区划分,并预测至2026-2034年
 罐装鲔鱼市场-全球产业规模、份额、趋势、竞争格局、机会及预测:依鲔鱼类型、口味、通路、地区及竞争情况划分,2021-2031年
 全球鲔鱼罐头市场
 鲔鱼罐头市场:按产品类型、分销管道和地区划分
 罐头鲔鱼市场规模、份额、成长分析,按鲔鱼类型、风味、产品类型、使用形式、销售管道、地区 - 产业预测,2024-2031
 全球鲔鱼罐头市场:依类型、通路和地区预测(~2030年)
 北美鲔鱼罐头市场预测至 2031 年 - 区域分析 - 按类型、类别和配销通路