


 |
市场调查报告书
商品编码
1892766
智慧票务市场机会、成长驱动因素、产业趋势分析及预测(2026-2035年)Smart Ticketing Market Opportunity, Growth Drivers, Industry Trend Analysis, and Forecast 2026 - 2035 |
||||||
2025 年全球智慧票务市场价值为 117 亿美元,预计到 2035 年将以 13.1% 的复合年增长率成长至 396 亿美元。
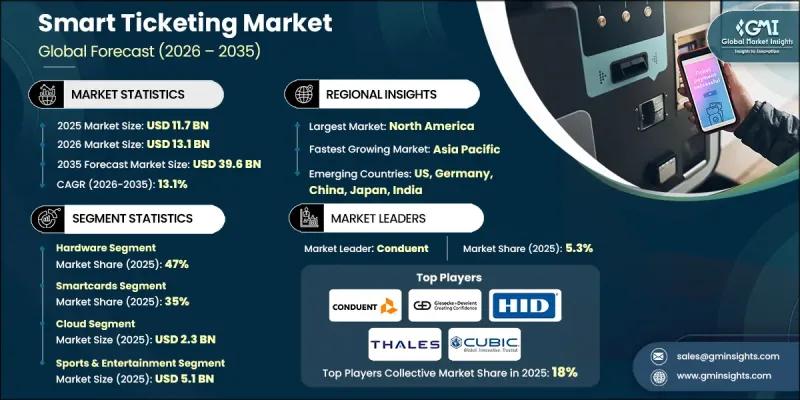
全球向数位化和非接触式支付生态系统的转型正在推动市场成长。旅客越来越倾向于快速便利的支付体验,无需实体车票和现金交易。交通管理部门和公共机构积极支持数位化票务系统,以提高营运效率、减少交易摩擦并提升乘客便利性。随着出行系统的现代化,纸本车票正逐步被安全可靠、数据驱动的平台所取代,这些平台支援即时验证和分析。这些解决方案也符合公共卫生优先事项和成本削减策略。对城市综合出行和数据驱动型交通规划的日益重视进一步促进了这些解决方案的普及。各国政府正在大力投资智慧交通基础设施,作为更广泛的智慧城市计画的一部分,加速在公车、铁路和地铁系统中的部署。智慧票务平台正日益被视为基础性数位基础设施,它不仅能改善使用者体验,还能建构可扩展、面向未来的交通生态系统。
| 市场范围 | |
|---|---|
| 起始年份 | 2025 |
| 预测年份 | 2026-2035 |
| 起始值 | 117亿美元 |
| 预测值 | 396亿美元 |
| 复合年增长率 | 13.1% |
基于帐户的票务系统和开放式支付框架正在重塑票价收取方式,将交易逻辑从实体卡转移到集中式使用者帐户。这些模式实现了灵活的票价计算、无缝的多模式整合以及更广泛的互通性。它们简化了註册流程,降低了系统复杂性,并允许旅客使用银行卡或行动装置支付,而无需依赖专有媒介。随着城市寻求统一的出行平台,这些技术正迅速取代传统的闭环系统。
硬体部分在2025年占据了47%的市场份额,预计到2035年将以12.1%的复合年增长率成长。现代系统需要能够同时处理多种票务介质的先进验证器。耐用性要求和复杂的安装环境导致更高的更换和升级成本,进一步巩固了硬体对收入的强劲贡献。
智慧卡市场在2025年占据35%的市场份额,预计2026年至2035年间将以11.8%的复合年增长率成长。由于其可靠性和安全性,智慧卡在许多现有系统中仍然占据核心地位,儘管向行动支付和开放式支付方式的逐步过渡仍在继续。非接触式支付标准确保了持续的互通性,而行动支付效能的提升也提高了智慧型手机票务系统的普及率。
预计2025年,美国智慧票务市场规模将达31亿美元,引领北美市场。大型公共交通网路的持续现代化改造,推动了对先进票务基础设施和后端平台的持续需求。
目录
第一章:方法论与范围
第二章:执行概要
第三章:行业洞察
- 产业生态系分析
- 供应商格局
- 系统和平台提供者
- 五金供应商
- 支付合作伙伴
- 利基专家
- 最终用途
- 成本结构
- 利润率
- 每个阶段的价值增加
- 影响供应链的因素
- 颠覆者
- 供应商格局
- 对力的影响
- 成长驱动因素
- 非接触式和无现金支付方式的快速普及
- 扩展以帐户为基础的票务系统(ABT)和开放式系统
- 智慧城市计画与政府数位化项目
- 智慧型手机普及率和行动钱包使用量的成长
- 产业陷阱与挑战
- 初始部署和升级成本高昂
- 与原有基础设施集成
- 网路安全风险与资料隐私问题
- 市场机会
- 扩展开放式EMV和行动钱包支付
- 在对成本敏感的地区,二维码和行动票务正在成长
- 采用生物辨识及人脸辨识门禁系统
- 政府对智慧城市和公共交通现代化的投资
- 成长驱动因素
- 成长潜力分析
- 北美洲
- CCPA / CPRA(加州消费者隐私法案 / 加州隐私权法案)
- PCI DSS(支付卡产业资料安全标准)
- 欧洲
- 隐私代码(Codice in materia di protezione dei dati individuali)
- 国家网路安全局指令
- 2018年资料保护法
- PSD2(支付服务指示2)和开放银行规则
- 亚太地区
- 2023年数位个人资料保护法(印度)
- 韩国个人资讯保护法 (PIPA)
- 1979 年电信(拦截与存取)法(澳洲)
- 国家资料保护/电子交易法
- 拉丁美洲
- LGPD(Lei Geral de Protecao de Dados)
- 国家个人资料保护局法规
- 联邦法律关于保护私人持有的个人数据
- 中东和非洲
- 个人资料保护法 (PDPL)
- 反网路犯罪法(各司法管辖区)
- 南非电子通讯和交易法
- 北美洲
- 波特的分析
- PESTEL 分析
- 技术与创新格局
- 当前技术趋势
- 新兴技术
- 定价分析
- 副产品
- 按地区
- 成本細項分析
- 供应商成本结构
- 成本构成要素的实施
- 持续营运成本
- 间接客户成本
- 专利分析
- 商业模式与获利
- 资本支出销售模式与SaaS/代管服务模式对比
- 收入来源(交易费、资料服务费、广告费)
- 混合型商业结构
- 案例研究和参考部署
- 大都会的成功案例
- 成本敏感型/二维码优先部署
- 经验教训和常见陷阱
- 永续性和环境方面
- 永续实践
- 减少废弃物策略
- 生产中的能源效率
- 环保倡议
- 碳足迹考量
- 未来展望与机会
第四章:竞争格局
- 介绍
- 公司市占率分析
- 北美洲
- 欧洲
- 亚太地区
- 拉丁美洲
- MEA
- 主要市场参与者的竞争分析
- 竞争定位矩阵
- 战略展望矩阵
- 关键进展
- 併购
- 合作伙伴关係与合作
- 新产品发布
- 扩张计划和资金
第五章:市场估算与预测:依组件划分,2022-2035年
- 硬体
- 智慧卡读卡器
- 自动售票机(TVM)
- 闸机/旋转闸门
- 销售点终端
- 移动/手持式验证器
- 软体
- 票务及票价管理软体
- 行动票务应用程式
- 即时乘客资讯软体
- 收益管理系统
- CRM和分析平台
- 服务
- 专业服务
- 託管服务
第六章:市场估算与预测:依票务技术划分,2022-2035年
- 智慧卡
- 手机票务
- QR 图码/条码门票
- 开放式支付系统
- 生物辨识票务
- 穿戴式票务
第七章:市场估计与预测:依系统划分,2022-2035年
- 开放系统
- 封闭系统
第八章:市场估算与预测:依部署方式划分,2022-2035年
- 本地部署
- 云
第九章:市场估算与预测:依连结方式划分,2022-2035年
- 射频识别
- 条码
- 近场通讯(NFC)
- 蜂巢式网路
- 无线上网
第十章:市场估计与预测:依最终用途划分,2022-2035年
- 停车处
- 体育娱乐
- 运输
- 道路
- 铁路
- 航空
- 其他的
第十一章:市场估计与预测:按地区划分,2022-2035年
- 北美洲
- 我们
- 加拿大
- 欧洲
- 德国
- 英国
- 法国
- 义大利
- 西班牙
- 俄罗斯
- 北欧
- 比荷卢经济联盟
- 亚太地区
- 中国
- 印度
- 日本
- 澳洲
- 韩国
- 泰国
- 印尼
- 新加坡
- 越南
- 拉丁美洲
- 巴西
- 墨西哥
- 阿根廷
- 哥伦比亚
- MEA
- 南非
- 沙乌地阿拉伯
- 阿联酋
第十二章:公司简介
- Global Leaders
- Conduent
- Cubic
- Thales
- Siemens
- Giesecke+Devrient (G+D)
- HID Global
- NXP Semiconductors
- Infineon Technologies
- Idemia
- Verimatrix
- SITA
- 区域冠军
- CPI Card
- Confidex
- TCN Technology
- Telvent GIT
- Xerox
- Scheidt & Bachmann
- Flowbird
- Masabi
- Ridango
- 新兴参与者
- Etickets
- Littlepay
- FAIRTIQ
- Snapper Services
- Eventbrite
The Global Smart Ticketing Market was valued at USD 11.7 billion in 2025 and is estimated to grow at a CAGR of 13.1% to reach USD 39.6 billion by 2035.
Market growth is being driven by the worldwide transition toward digital and contactless payment ecosystems. Travelers increasingly favor fast and frictionless payment experiences that eliminate physical tickets and cash handling. Transit authorities and public agencies are actively supporting digital fare collection to improve operational efficiency, reduce transaction friction, and enhance passenger convenience. As mobility systems modernize, paper-based ticketing is steadily being replaced by secure, data-driven platforms that support real-time validation and analytics. These solutions also align with public health priorities and cost-reduction strategies. The expanding focus on integrated urban mobility and data-enabled transport planning further supports adoption. Governments are investing heavily in intelligent transport infrastructure as part of broader smart city initiatives, accelerating deployment across buses, rail networks, and metro systems. Smart ticketing platforms are increasingly viewed as foundational digital infrastructure that improves user experience while enabling scalable, future-ready transit ecosystems.
| Market Scope | |
|---|---|
| Start Year | 2025 |
| Forecast Year | 2026-2035 |
| Start Value | $11.7 Billion |
| Forecast Value | $39.6 Billion |
| CAGR | 13.1% |
Account-based ticketing and open-loop payment frameworks are reshaping fare collection by shifting transaction logic from physical cards to centralized user accounts. These models enable flexible fare calculation, seamless multimodal integration, and broader interoperability. They simplify onboarding, lower system complexity, and allow travelers to pay using bank cards or mobile devices without relying on proprietary media. As cities pursue unified mobility platforms, these technologies are rapidly replacing legacy closed-loop systems.
The hardware segment accounted for a 47% share in 2025 and is forecast to grow at a CAGR of 12.1% through 2035. Modern systems require advanced validators capable of processing multiple fare media simultaneously. Durability requirements and complex installation environments contribute to higher replacement and upgrade costs, reinforcing hardware's strong revenue contribution.
The smartcards segment held a 35% share in 2025 and is expected to grow at a CAGR of 11.8% between 2026 and 2035. These cards remain central to many established systems due to reliability and security, although gradual migration toward mobile and open-loop options continues. Contactless standards ensure ongoing interoperability, while improved mobile performance is increasing acceptance of smartphone-based ticketing.
U.S. Smart Ticketing Market generated USD 3.1 billion in 2025 and led the North America market. Ongoing modernization of large-scale transit networks is driving sustained demand for advanced fare collection infrastructure and backend platforms.
Key companies operating in the Global Smart Ticketing Market include Cubic, Thales, Conduent, Giesecke + Devrient, HID Global, NXP Semiconductors, Infineon Technologies, and Confidex. Companies in the Global Smart Ticketing Market are strengthening their competitive position through continuous innovation, strategic partnerships, and large-scale deployment capabilities. Providers are investing in interoperable platforms that support account-based architectures, open-loop payments, and mobile-first experiences. Collaboration with transit authorities enables long-term contracts and system-wide rollouts. Many players focus on modular hardware designs and cloud-native software to improve scalability and reduce deployment time.
Table of Contents
Chapter 1 Methodology & Scope
- 1.1 Market scope and definition
- 1.2 Research design
- 1.2.1 Research approach
- 1.2.2 Data collection methods
- 1.3 Data mining sources
- 1.3.1 Global
- 1.3.2 Regional/Country
- 1.4 Base estimates and calculations
- 1.4.1 Base year calculation
- 1.4.2 Key trends for market estimation
- 1.5 Primary research and validation
- 1.5.1 Primary sources
- 1.6 Forecast
- 1.7 Research assumptions and limitations
Chapter 2 Executive Summary
- 2.1 Industry 3600 synopsis
- 2.2 Key market trends
- 2.2.1 Regional
- 2.2.2 Component
- 2.2.3 Ticketing Technology
- 2.2.4 System
- 2.2.5 Deployment
- 2.2.6 Connectivity
- 2.2.7 End Use
- 2.3 TAM Analysis, 2026-2035
- 2.4 CXO perspectives: Strategic imperatives
- 2.4.1 Key decision points for industry executives
- 2.4.2 Critical success factors for market players
- 2.5 Future outlook and strategic recommendations
Chapter 3 Industry Insights
- 3.1 Industry ecosystem analysis
- 3.1.1 Supplier landscape
- 3.1.1.1 System & platform providers
- 3.1.1.2 Hardware suppliers
- 3.1.1.3 Payment partners
- 3.1.1.4 Niche specialists
- 3.1.1.5 End use
- 3.1.2 Cost structure
- 3.1.3 Profit margin
- 3.1.4 Value addition at each stage
- 3.1.5 Factors impacting the supply chain
- 3.1.6 Disruptors
- 3.1.1 Supplier landscape
- 3.2 Impact on forces
- 3.2.1 Growth drivers
- 3.2.1.1 Rapid adoption of contactless & cashless payments
- 3.2.1.2 Expansion of account-based ticketing (ABT) & open-loop systems
- 3.2.1.3 Smart city initiatives & government digitalization programs
- 3.2.1.4 Growth in smartphone penetration & mobile wallet usage
- 3.2.2 Industry pitfalls & challenges
- 3.2.2.1 High initial deployment & upgrade costs
- 3.2.2.2 Integration with legacy infrastructure
- 3.2.2.3 Cybersecurity risks & data privacy concerns
- 3.2.3 Market opportunities
- 3.2.3.1 Expansion of open-loop EMV and mobile wallet payments
- 3.2.3.2 Growth of QR and mobile ticketing in cost-sensitive regions
- 3.2.3.3 Adoption of biometric and facial recognition access systems
- 3.2.3.4 Government investments in smart city & public transport modernization
- 3.2.1 Growth drivers
- 3.3 Growth potential analysis
- 3.3.1 North America
- 3.3.1.1 CCPA / CPRA (California Consumer Privacy Act / California Privacy Rights Act)
- 3.3.1.2 PCI DSS (Payment Card Industry Data Security Standard)
- 3.3.2 Europe
- 3.3.2.1 Privacy Code (Codice in materia di protezione dei dati personali)
- 3.3.2.2 National cybersecurity agency directives
- 3.3.2.3 Data Protection Act 2018
- 3.3.2.4 PSD2 (Payment Services Directive 2) and open-banking rules
- 3.3.3 Asia Pacific
- 3.3.3.1 Digital Personal Data Protection Act 2023 (India)
- 3.3.3.2 PIPA (Personal Information Protection Act, South Korea)
- 3.3.3.3 Telecommunications (Interception and Access) Act 1979 (Australia)
- 3.3.3.4 National data-protection / e-transactions laws
- 3.3.4 Latin America
- 3.3.4.1 LGPD (Lei Geral de Protecao de Dados)
- 3.3.4.2 National Directorate for Personal Data Protection regulations
- 3.3.4.3 Federal Law on the Protection of Personal Data Held by Private Parties
- 3.3.5 Middle East & Africa
- 3.3.5.1 PDPL (Personal Data Protection Law)
- 3.3.5.2 Anti-Cyber Crime Law (various jurisdictions)
- 3.3.5.3 Electronic Communications and Transactions Act (South Africa)
- 3.3.1 North America
- 3.4 Porter's analysis
- 3.5 PESTEL analysis
- 3.6 Technology and innovation landscape
- 3.6.1 Current technological trends
- 3.6.2 Emerging technologies
- 3.7 Pricing analysis
- 3.7.1 By product
- 3.7.2 By region
- 3.8 Cost breakdown analysis
- 3.8.1 Vendor cost structure
- 3.8.2 Implementation of cost components
- 3.8.3 Ongoing operational costs
- 3.8.4 Indirect customer costs
- 3.9 Patent analysis
- 3.10 Business models & monetization
- 3.10.1 Capex sale vs SaaS / managed services models
- 3.10.2 Revenue streams (transaction fees, data services, ads)
- 3.10.3 Hybrid commercial structures
- 3.11 Case studies & reference deployments
- 3.11.1 Large-metro success stories
- 3.11.2 Cost-sensitive / QR-first deployments
- 3.11.3 Lessons learned and common pitfalls
- 3.12 Sustainability and environmental aspects
- 3.12.1 Sustainable practices
- 3.12.2 Waste reduction strategies
- 3.12.3 Energy efficiency in production
- 3.12.4 Eco-friendly initiatives
- 3.12.5 Carbon footprint considerations
- 3.13 Future outlook and opportunities
Chapter 4 Competitive Landscape, 2025
- 4.1 Introduction
- 4.2 Company market share analysis
- 4.2.1 North America
- 4.2.2 Europe
- 4.2.3 Asia Pacific
- 4.2.4 LATAM
- 4.2.5 MEA
- 4.3 Competitive analysis of major market players
- 4.4 Competitive positioning matrix
- 4.5 Strategic outlook matrix
- 4.6 Key developments
- 4.6.1 Mergers & acquisitions
- 4.6.2 Partnerships & collaborations
- 4.6.3 New product launches
- 4.6.4 Expansion plans and funding
Chapter 5 Market Estimates & Forecast, By Component, 2022 - 2035 ($Bn, Units)
- 5.1 Key trends
- 5.2 Hardware
- 5.2.1 Smart card readers
- 5.2.2 Ticket vending machines (TVMs)
- 5.2.3 Fare gates/turnstiles
- 5.2.4 Point-of-sale terminals
- 5.2.5 Mobile/handheld validators
- 5.3 Software
- 5.3.1 Ticketing & fare management software
- 5.3.2 Mobile ticketing apps
- 5.3.3 Real-time passenger information software
- 5.3.4 Revenue management systems
- 5.3.5 CRM & analytics platforms
- 5.4 Services
- 5.4.1 Professional services
- 5.4.2 Managed services
Chapter 6 Market Estimates & Forecast, By Ticketing Technology, 2022 - 2035 ($Bn)
- 6.1 Key trends
- 6.2 Smartcards
- 6.3 Mobile ticketing
- 6.4 QR code/barcode tickets
- 6.5 Open-loop payment systems
- 6.6 Biometric ticketing
- 6.7 Wearable ticketing
Chapter 7 Market Estimates & Forecast, By System, 2022 - 2035 ($Bn)
- 7.1 Key trends
- 7.2 Open system
- 7.3 Closed system
Chapter 8 Market Estimates & Forecast, By Deployment, 2022 - 2035 ($Bn)
- 8.1 Key trends
- 8.2 On-premise
- 8.3 Cloud
Chapter 9 Market Estimates & Forecast, By Connectivity, 2022 - 2035 ($Bn)
- 9.1 Key trends
- 9.2 RFID
- 9.3 Barcode
- 9.4 Near-field Communication (NFC)
- 9.5 Cellular Network
- 9.6 Wi-Fi
Chapter 10 Market Estimates & Forecast, By End Use, 2022 - 2035 ($Bn)
- 10.1 Key trends
- 10.2 Parking
- 10.3 Sports & Entertainment
- 10.4 Transportation
- 10.4.1 Roadways
- 10.4.2 Railways
- 10.4.3 Airways
- 10.5 Others
Chapter 11 Market Estimates & Forecast, By Region, 2022 - 2035 ($Bn)
- 11.1 Key trends
- 11.2 North America
- 11.2.1 US
- 11.2.2 Canada
- 11.3 Europe
- 11.3.1 Germany
- 11.3.2 UK
- 11.3.3 France
- 11.3.4 Italy
- 11.3.5 Spain
- 11.3.6 Russia
- 11.3.7 Nordics
- 11.3.8 Benelux
- 11.4 Asia Pacific
- 11.4.1 China
- 11.4.2 India
- 11.4.3 Japan
- 11.4.4 Australia
- 11.4.5 South Korea
- 11.4.6 Thailand
- 11.4.7 Indonesia
- 11.4.8 Singapore
- 11.4.9 Vietnam
- 11.5 Latin America
- 11.5.1 Brazil
- 11.5.2 Mexico
- 11.5.3 Argentina
- 11.5.4 Colombia
- 11.6 MEA
- 11.6.1 South Africa
- 11.6.2 Saudi Arabia
- 11.6.3 UAE
Chapter 12 Company Profiles
- 12.1 Global Leaders
- 12.1.1 Conduent
- 12.1.2 Cubic
- 12.1.3 Thales
- 12.1.4 Siemens
- 12.1.5 Giesecke+Devrient (G+D)
- 12.1.6 HID Global
- 12.1.7 NXP Semiconductors
- 12.1.8 Infineon Technologies
- 12.1.9 Idemia
- 12.1.10 Verimatrix
- 12.1.11 SITA
- 12.2 Regional Champions
- 12.2.1 CPI Card
- 12.2.2 Confidex
- 12.2.3 TCN Technology
- 12.2.4 Telvent GIT
- 12.2.5 Xerox
- 12.2.6 Scheidt & Bachmann
- 12.2.7 Flowbird
- 12.2.8 Masabi
- 12.2.9 Ridango
- 12.3 Emerging Players
- 12.3.1 Etickets
- 12.3.2 Littlepay
- 12.3.3 FAIRTIQ
- 12.3.4 Snapper Services
- 12.3.5 Eventbrite
 交通运输票务市场分析及预测(至2035年):依类型、产品、服务、技术、组件、应用、形式、最终使用者、模式、部署方式划分帮助台软体市场分析及预测(至2035年):依类型、产品、服务、技术、组件、应用、部署模式、最终用户、模组及功能划分智慧票务市场分析及预测(至2035年):依类型、产品类型、服务、技术、组件、应用、部署类型、最终用户及解决方案划分线上活动票务市场分析及预测(至2035年):按类型、产品类型、服务、技术、组件、应用、设备、部署类型、最终用户和解决方案划分非接触式票务市场分析及预测(至2035年):依类型、产品类型、服务、技术、组件、应用、最终用户、部署类型及设备划分
 线上活动票务市场 - 全球产业规模、份额、趋势、机会及预测(按平台、活动类型、地区和竞争格局划分,2021-2031年)智慧票务市场-全球产业规模、份额、趋势、机会及预测(按组件、技术、产品、应用、地区及竞争格局划分,2021-2031年预测)
 日本智慧票务市场报告:按产品、组件、系统、应用和地区划分(2026-2034年)
 智慧票务市场规模、份额及成长分析(按组件、系统、产品及地区划分)-2026年至2033年产业预测
 线上电影票务服务市场规模、份额和成长分析(按服务类型、支付方式、萤幕类型、类型、应用程式和地区划分):产业预测(2026-2033 年)