


 |
市场调查报告书
商品编码
1892769
草甘膦市场机会、成长驱动因素、产业趋势分析及预测(2026-2035年)Glyphosate Market Opportunity, Growth Drivers, Industry Trend Analysis, and Forecast 2026 - 2035 |
||||||
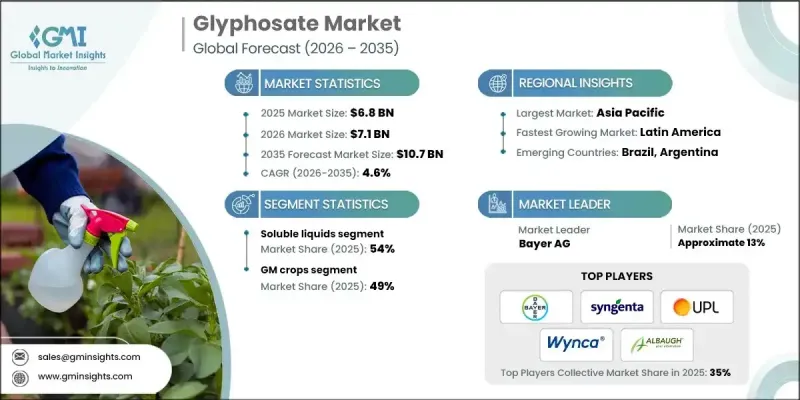
2025 年全球草甘膦市场价值为 68 亿美元,预计到 2035 年将以 4.6% 的复合年增长率增长至 107 亿美元。
即使管理规范和监管要求不断提高,草甘膦仍然是播前除草、基因改造作物田间施药以及收穫后茬管理的重要除草剂。保护性耕作和免耕技术的推广、集约化间作的普及以及价格敏感地区每公顷成本优势的提升,都支撑着市场发展。同时,欧洲部分地区的抗药性问题和更严格的监管促使用户转向精准施药和多样化的混合。中国技术供应商优化了产能,提高了环保合规性,提升了纯度标准,并为依赖长期稳定供应的全球配方商稳定了价格。升级后的废水和排放控制措施最大限度地减少了过去的繁荣-萧条週期,使美洲和欧洲的配方商能够进行可靠的规划。种植者正在采用脉衝宽度调製、分段控制、无人机定点喷洒和数位化平台等技术,以优化施药量,同时保持药效并符合监管要求。
| 市场范围 | |
|---|---|
| 起始年份 | 2025 |
| 预测年份 | 2026-2035 |
| 起始值 | 68亿美元 |
| 预测值 | 107亿美元 |
| 复合年增长率 | 4.6% |
2025 年,可溶性液体细分市场占据 54% 的市场份额,预计到 2035 年将以 4.7% 的复合年增长率成长。这些配方因其易于操作、广泛的罐混兼容性以及更高的吸收率、耐雨性和功效而备受青睐,其中包括经水生生物批准的用于运河和海岸线管理的选项。
基因改造作物在2025年占据了49%的市场份额,预计到2035年将以5%的复合年增长率成长。草甘膦在大豆、玉米和棉花种植系统中仍然至关重要,它能够有效应对抗性生物型,并构成多年生作物和果园播前除草和定向条带施用的基础。水产养殖和工业用途则依赖长间隔标籤和水生安全配方。
预计到2025年,北美草甘膦市占率将达到23.9%,反映出该市场已发展成熟且高度专业化。美国使用经美国环保署(EPA)批准的标籤,并采取濒危物种保护措施,强化了施用时间、缓衝区和全面的文件记录要求。
目录
第一章:方法论与范围
第二章:执行概要
第三章:行业洞察
- 产业生态系分析
- 供应商格局
- 利润率
- 每个阶段的价值增加
- 影响价值链的因素
- 中断
- 产业影响因素
- 成长驱动因素
- 产业陷阱与挑战
- 市场机会
- 成长潜力分析
- 监管环境
- 北美洲
- 欧洲
- 亚太地区
- 拉丁美洲
- 中东和非洲
- 波特的分析
- PESTEL 分析
- 价格趋势
- 按地区
- 按产品配方
- 未来市场趋势
- 技术与创新格局
- 当前技术趋势
- 新兴技术
- 专利格局
- 贸易统计(HS编码)(註:仅提供重点国家的贸易统计资料)
- 主要进口国
- 主要出口国
- 永续性和环境方面
- 永续实践
- 减少废弃物策略
- 生产中的能源效率
- 环保倡议
- 碳足迹考量
第四章:竞争格局
- 介绍
- 公司市占率分析
- 按地区
- 北美洲
- 欧洲
- 亚太地区
- 拉丁美洲
- MEA
- 按地区
- 公司矩阵分析
- 主要市场参与者的竞争分析
- 竞争定位矩阵
- 关键进展
- 併购
- 合作伙伴关係与合作
- 新产品发布
- 扩张计划
第五章:市场估价与预测:依产品配方划分,2022-2035年
- 技术浓缩物(TC - 粉末)
- 技术浓缩液(TK - 溶液)
- 可溶性液体浓缩物 (SL)
- 水溶性颗粒(SG)
- 即用型液体
- 水产及特殊配方
- 其他的
第六章:市场估算与预测:依应用领域划分,2022-2035年
- 基因改造作物
- 基因改造玉米
- 基因改造棉花
- 基因改造油菜籽
- 基因改造大豆
- 基因改造甜菜
- 基因改造苜蓿
- 非基因改造耕地作物
- 谷物
- 油籽作物
- 水果和蔬菜
- 蔬菜
- 水果
- 工业作物
- 甘蔗
- 其他工业作物
- 非农业用途
- 林业管理
- 草坪和观赏植物
- 水域
- 通行权(ROW)
- 商业和工业用地
- 其他的
第七章:市场估算与预测:依最终用途划分,2022-2035年
- 大型商业农场
- 中小农户
- 政府和公共机构
- 商业景观设计师
- 工业植被管理公司
- 居民用户
- 其他的
第八章:市场估算与预测:依地区划分,2022-2035年
- 北美洲
- 我们
- 加拿大
- 欧洲
- 德国
- 英国
- 法国
- 西班牙
- 义大利
- 欧洲其他地区
- 亚太地区
- 中国
- 印度
- 日本
- 澳洲
- 韩国
- 亚太其他地区
- 拉丁美洲
- 巴西
- 墨西哥
- 阿根廷
- 拉丁美洲其他地区
- 中东和非洲
- 沙乌地阿拉伯
- 南非
- 阿联酋
- 中东和非洲其他地区
第九章:公司简介
- ADAMA Agricultural Solutions Ltd.
- Albaugh, LLC
- Anhui Huaxing Chemical Industry Co., Ltd.
- Arysta LifeScience
- Bayer AG
- Excel Crop Care Limited
- FMC Corporation
- Gharda Chemicals Limited
- Helm AG
- Heranba Industries Limited
- Hubei Xingfa Chemicals Group
- Jiangsu Good Harvest-Weien Agrochemical Co., Ltd.
- Jiangsu Yangnong Chemical Co., Ltd.
- Nufarm Limited
- Nutrien Ag Solutions
- Rainbow Agro
- Sinon Corporation (Taiwan)
- Syngenta Group (ChemChina)
- UPL Limited
- Zhejiang Xinan Chemical Industrial Group Co., Ltd.
- Others
The Global Glyphosate Market was valued at USD 6.8 billion in 2025 and is estimated to grow at a CAGR of 4.6% to reach USD 10.7 billion by 2035.
Glyphosate remains a cornerstone for pre-plant burndown, in-crop use on traited systems, and post-harvest stubble management, even as stewardship and regulatory expectations increase. The market is supported by the adoption of conservation and no-till practices, intensified multi-cropping, and cost-per-hectare advantages in price-sensitive regions. At the same time, resistance issues and tighter regulations in some parts of Europe are pushing users toward precision applications and diversified tank mixes. Chinese technical suppliers have rationalized capacities and improved environmental compliance, boosting purity standards and stabilizing prices for global formulators reliant on consistent long-term supply. Upgraded wastewater and emissions controls have minimized historical boom-bust cycles, allowing formulators in the Americas and Europe to plan reliably. Growers are embracing pulse-width modulation, section control, UAV spot-spraying, and digital platforms to optimize application rates while maintaining efficacy and regulatory compliance.
| Market Scope | |
|---|---|
| Start Year | 2025 |
| Forecast Year | 2026-2035 |
| Start Value | $6.8 Billion |
| Forecast Value | $10.7 Billion |
| CAGR | 4.6% |
The soluble liquids segment held a 54% share in 2025 and is expected to grow at a CAGR of 4.7% through 2035. These formulations are favored for their ease of handling, broad tank-mix compatibility, and improved uptake, rainfastness, and efficacy, including aquatic-approved options for canal and shoreline management.
The GM crops segment accounted for a 49% share in 2025 and is projected to grow at a CAGR of 5% through 2035. Glyphosate remains essential in soybean, corn, and cotton systems, addressing resistant biotypes and forming the backbone of pre-plant burndown and directed strip applications in permanent crops and orchards. Aquatic and industrial use relies on long-interval labels and aquatic-safe formulations.
North America Glyphosate Market held a 23.9% share in 2025, reflecting a mature and highly professionalized glyphosate market. The U.S. operates under EPA-approved labels, with endangered-species mitigation measures reinforcing timing, buffer zones, and comprehensive documentation requirements.
Key players in the Glyphosate Market include ADAMA Agricultural Solutions Ltd., Albaugh, LLC, Anhui Huaxing Chemical Industry Co., Ltd., Arysta LifeScience, Bayer AG, Excel Crop Care Limited, FMC Corporation, Gharda Chemicals Limited, Helm AG, Heranba Industries Limited, Hubei Xingfa Chemicals Group, Jiangsu Good Harvest-Weien Agrochemical Co., Ltd., Jiangsu Yangnong Chemical Co., Ltd., Nufarm Limited, Nutrien Ag Solutions, Rainbow Agro, Sinon Corporation (Taiwan), Syngenta Group (ChemChina), UPL Limited, and Zhejiang Xinan Chemical Industrial Group Co., Ltd. Companies in the Global Glyphosate Market are implementing several strategies to strengthen their foothold. They are investing in R&D to improve formulation performance, including enhanced surfactant systems and precision-compatible products. Strategic alliances with distributors, cooperatives, and agritech platforms expand market penetration and support the adoption of digital application tools. Regional expansion, particularly in emerging markets with rising farm incomes, helps capture new growth opportunities. Companies are also optimizing supply chains, improving environmental compliance, and offering training and technical support to growers to ensure correct usage.
Table of Contents
Chapter 1 Methodology & Scope
- 1.1 Market scope and definition
- 1.2 Research design
- 1.2.1 Research approach
- 1.2.2 Data collection methods
- 1.3 Data mining sources
- 1.3.1 Global
- 1.3.2 Regional/Country
- 1.4 Base estimates and calculations
- 1.4.1 Base year calculation
- 1.4.2 Key trends for market estimation
- 1.5 Primary research and validation
- 1.5.1 Primary sources
- 1.6 Forecast model
- 1.7 Research assumptions and limitations
Chapter 2 Executive Summary
- 2.1 Industry 3600 synopsis
- 2.2 Key market trends
- 2.2.1 Regional
- 2.2.2 Product formulation
- 2.2.3 Application
- 2.2.4 End use
- 2.3 TAM Analysis, 2026-2035
- 2.4 CXO perspectives: Strategic imperatives
- 2.4.1 Executive decision points
- 2.4.2 Critical success factors
- 2.5 Future Outlook and Strategic Recommendations
Chapter 3 Industry Insights
- 3.1 Industry ecosystem analysis
- 3.1.1 Supplier landscape
- 3.1.2 Profit margin
- 3.1.3 Value addition at each stage
- 3.1.4 Factor affecting the value chain
- 3.1.5 Disruptions
- 3.2 Industry impact forces
- 3.2.1 Growth drivers
- 3.2.2 Industry pitfalls and challenges
- 3.2.3 Market opportunities
- 3.3 Growth potential analysis
- 3.4 Regulatory landscape
- 3.4.1 North America
- 3.4.2 Europe
- 3.4.3 Asia Pacific
- 3.4.4 Latin America
- 3.4.5 Middle East & Africa
- 3.5 Porter's analysis
- 3.6 PESTEL analysis
- 3.7 Price trends
- 3.7.1 By region
- 3.7.2 By Product formulations
- 3.8 Future market trends
- 3.9 Technology and Innovation landscape
- 3.9.1 Current technological trends
- 3.9.2 Emerging technologies
- 3.10 Patent Landscape
- 3.11 Trade statistics (HS code) ( Note: the trade statistics will be provided for key countries only)
- 3.11.1 Major importing countries
- 3.11.2 Major exporting countries
- 3.12 Sustainability and environmental aspects
- 3.12.1 Sustainable practices
- 3.12.2 Waste reduction strategies
- 3.12.3 Energy efficiency in production
- 3.12.4 Eco-friendly initiatives
- 3.13 Carbon footprint consideration
Chapter 4 Competitive Landscape, 2025
- 4.1 Introduction
- 4.2 Company market share analysis
- 4.2.1 By region
- 4.2.1.1 North America
- 4.2.1.2 Europe
- 4.2.1.3 Asia Pacific
- 4.2.1.4 LATAM
- 4.2.1.5 MEA
- 4.2.1 By region
- 4.3 Company matrix analysis
- 4.4 Competitive analysis of major market players
- 4.5 Competitive positioning matrix
- 4.6 Key developments
- 4.6.1 Mergers & acquisitions
- 4.6.2 Partnerships & collaborations
- 4.6.3 New Product Launches
- 4.6.4 Expansion Plans
Chapter 5 Market Estimates and Forecast, By Product Formulation, 2022-2035 (USD Billion) (Kilo Tons)
- 5.1 Key trends
- 5.2 Technical Concentrate (TC - Powder)
- 5.3 Technical Concentrate (TK - Solution)
- 5.4 Soluble Liquid Concentrate (SL)
- 5.5 Water Soluble Granules (SG)
- 5.6 Ready-to-Use Liquids
- 5.7 Aquatic & Specialty Formulations
- 5.8 Others
Chapter 6 Market Estimates and Forecast, By Application, 2022-2035 (USD Billion) (Kilo Tons)
- 6.1 Key trends
- 6.2 GM Crops
- 6.2.1 GM Corn
- 6.2.2 GM Cotton
- 6.2.3 GM Canola
- 6.2.4 GM Soybean
- 6.2.5 GM Sugar Beet
- 6.2.6 GM Alfalfa
- 6.3 Non-GM Arable Crops
- 6.3.1 Cereal Grains
- 6.3.2 Oilseed Crops
- 6.4 Fruits & Vegetables
- 6.4.1 Vegetables
- 6.4.2 Fruits
- 6.5 Industrial Crops
- 6.5.1 Sugarcane
- 6.5.2 Other Industrial Crops
- 6.6 Non-Agricultural Uses
- 6.6.1 Forestry Management
- 6.6.2 Turf & Ornamentals
- 6.6.3 Aquatic Areas
- 6.6.4 Rights-of-Way (ROW)
- 6.6.5 Commercial & Industrial Sites
- 6.7 Others
Chapter 7 Market Estimates and Forecast, By End Use, 2022-2035 (USD Billion) (Kilo Tons)
- 7.1 Key trends
- 7.2 Large-Scale Commercial Farmers
- 7.3 Small & Medium Farmers
- 7.4 Government & Public Agencies
- 7.5 Commercial Landscapers
- 7.6 Industrial Vegetation Management Companies
- 7.7 Residential Consumers
- 7.8 Others
Chapter 8 Market Estimates and Forecast, By Region, 2022-2035 (USD Billion) (Kilo Tons)
- 8.1 Key trends
- 8.2 North America
- 8.2.1 U.S.
- 8.2.2 Canada
- 8.3 Europe
- 8.3.1 Germany
- 8.3.2 UK
- 8.3.3 France
- 8.3.4 Spain
- 8.3.5 Italy
- 8.3.6 Rest of Europe
- 8.4 Asia Pacific
- 8.4.1 China
- 8.4.2 India
- 8.4.3 Japan
- 8.4.4 Australia
- 8.4.5 South Korea
- 8.4.6 Rest of Asia Pacific
- 8.5 Latin America
- 8.5.1 Brazil
- 8.5.2 Mexico
- 8.5.3 Argentina
- 8.5.4 Rest of Latin America
- 8.6 Middle East and Africa
- 8.6.1 Saudi Arabia
- 8.6.2 South Africa
- 8.6.3 UAE
- 8.6.4 Rest of Middle East and Africa
Chapter 9 Company Profiles
- 9.1 ADAMA Agricultural Solutions Ltd.
- 9.2 Albaugh, LLC
- 9.3 Anhui Huaxing Chemical Industry Co., Ltd.
- 9.4 Arysta LifeScience
- 9.5 Bayer AG
- 9.6 Excel Crop Care Limited
- 9.7 FMC Corporation
- 9.8 Gharda Chemicals Limited
- 9.9 Helm AG
- 9.10 Heranba Industries Limited
- 9.11 Hubei Xingfa Chemicals Group
- 9.12 Jiangsu Good Harvest-Weien Agrochemical Co., Ltd.
- 9.13 Jiangsu Yangnong Chemical Co., Ltd.
- 9.14 Nufarm Limited
- 9.15 Nutrien Ag Solutions
- 9.16 Rainbow Agro
- 9.17 Sinon Corporation (Taiwan)
- 9.18 Syngenta Group (ChemChina)
- 9.19 UPL Limited
- 9.20 Zhejiang Xinan Chemical Industrial Group Co., Ltd.
- 9.21 Others
 日本Glyphosate市场规模、份额、趋势和预测:按作物类型、基因改造生物 (GMO) 状态和地区划分,2026-2034 年
 2026年全球Glyphosate市场报告
 Glyphosate市场规模、份额和成长分析(按最终用户、应用、剂型、通路、作物类型和地区划分)—2026-2033年产业预测
 Glyphosate市场按最终用户、应用、剂型、分销管道和作物类型划分-2025-2032年全球预测
 Glyphosate:市场份额分析、行业趋势、统计数据、成长预测(2025-2030 年)
 草甘膦市场 - 全球产业规模、份额、趋势、机会和预测,按类型、应用、地区和竞争细分,2020-2030 年
 全球Glyphosate市场
 全球Glyphosate市场评估:依作物类型、形式、应用、地区、机会和预测(2018-2032年)
 全球Glyphosate市场:成长、未来展望与竞争分析(2025-2033)