


 |
市场调查报告书
商品编码
1892820
蒸汽涡轮机市场机会、成长驱动因素、产业趋势分析及预测(2026-2035年)Steam Turbine Market Opportunity, Growth Drivers, Industry Trend Analysis, and Forecast 2026 - 2035 |
||||||
2025年全球蒸汽涡轮机市场价值为262亿美元,预计到2035年将以2.8%的复合年增长率增长至349亿美元。
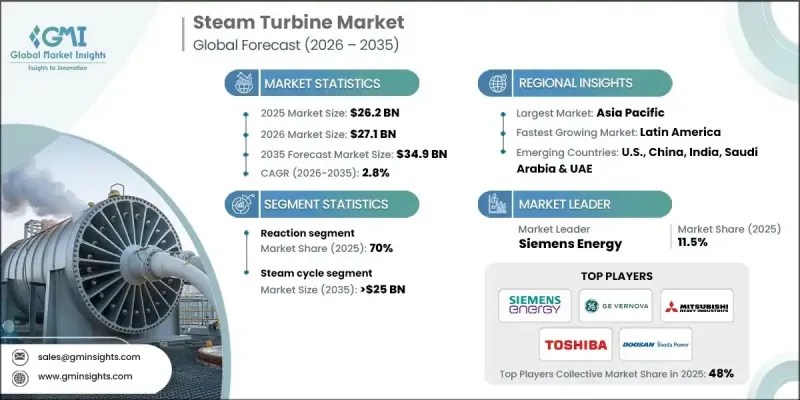
市场扩张的驱动力来自对可靠高效电力日益增长的需求,以及新建电厂和现有能源基础设施的现代化改造。蒸汽涡轮机将高压蒸汽转化为旋转机械能,使其成为工业发电不可或缺的一部分。不断增长的工业用电需求、热电联产系统的广泛应用以及先进控制技术的集成,都促进了新汽轮机的安装。为支持大规模发电而日益增长的大容量机组需求进一步巩固了市场成长。工业化、重工业扩张和热电联产的併网持续影响需求模式。能源转型政策正在影响汽轮机的部署,生物质能和地热项目等再生能源应用因其高热效率和可靠性而为汽轮机提供了发展机会。化工、石化、炼油和区域供热等行业越来越依赖汽轮机来实现高效的电力和热力管理。
| 市场范围 | |
|---|---|
| 起始年份 | 2025 |
| 预测年份 | 2026-2035 |
| 起始值 | 262亿美元 |
| 预测值 | 349亿美元 |
| 复合年增长率 | 2.8% |
预计到2035年,脉衝式燃气涡轮机市场规模将达到50亿美元,主要得益于市场对适用于工业和公用事业应用的紧凑型、高效率、低维护成本燃气涡轮机的需求。由于其在高压环境下的卓越性能以及对自备电厂和製程工业的适用性,脉衝式燃气涡轮机的应用正在不断增长。
2025年,装置容量大于3兆瓦至100兆瓦的电力市场创造了39亿美元的收入。此容量范围支援中型工业设施、生质能和垃圾焚化发电厂以及区域供热系统。它兼顾了效率、灵活性和成本,有助于自备电力基础设施的现代化,并确保在各种应用情境下都能获得可靠的能源输出。
预计到 2035 年,北美蒸汽涡轮机市场规模将达到 9 亿美元。生质能和地热能发电厂对蒸汽涡轮机的日益普及,以及政府支持提高效率、升级改造和控制排放的计划,将进一步推动该地区市场的成长。
目录
第一章:方法论与范围
第二章:执行概要
第三章:行业洞察
- 产业生态系分析
- 原物料供应及采购分析
- 製造能力评估
- 供应链韧性与风险因素
- 配电网路分析
- 监管环境
- 产业影响因素
- 成长驱动因素
- 产业陷阱与挑战
- 成长潜力分析
- 波特的分析
- PESTEL 分析
- 蒸汽涡轮机成本结构分析
- 价格趋势分析(美元/兆瓦)
- 按地区
- 按产能
- 新兴机会与趋势
- 投资分析与工业4.0整合
第四章:竞争格局
- 介绍
- 按地区分類的公司市占率分析
- 北美洲
- 欧洲
- 亚太地区
- 中东和非洲
- 拉丁美洲
- 战略仪錶板
- 策略倡议
- 重要伙伴关係与合作
- 主要併购活动
- 产品创新与发布
- 市场扩张策略
- 竞争性标竿分析
- 创新与永续发展格局
第五章:市场规模及预测:依设计类型划分,2022-2035年
- 反应
- 衝动
第六章:市场规模及预测:依废气排放类型划分,2022-2035年
- 冷凝
- 非冷凝式
第七章:市场规模及预测:依燃料类型划分,2022-2035年
- 化石燃料
- 生物质
- 地热
第八章:市场规模及预测:依最终用途划分,2022-2035年
- 工业的
- 炼油厂
- 化工厂
- 糖厂
- 纸浆和造纸
- 其他的
- 公用事业
第九章:市场规模及预测:依产能划分,2022-2035年
- ≤ 3 兆瓦
- 3兆瓦 - 100兆瓦
- 大于 100 兆瓦
第十章:市场规模及预测:依技术划分,2022-2035年
- 蒸汽循环
- 复合循环
- 热电联产
第十一章:市场规模及预测:依地区划分,2022-2035年
- 北美洲
- 我们
- 加拿大
- 墨西哥
- 欧洲
- 英国
- 法国
- 俄罗斯
- 德国
- 西班牙
- 义大利
- 亚太地区
- 中国
- 日本
- 韩国
- 印度
- 澳洲
- 印尼
- 马来西亚
- 泰国
- 中东和非洲
- 沙乌地阿拉伯
- 阿联酋
- 伊朗
- 埃及
- 南非
- 奈及利亚
- 土耳其
- 摩洛哥
- 拉丁美洲
- 巴西
- 阿根廷
- 智利
第十二章:公司简介
- Ansaldo Energia
- Bharat Heavy Electricals Limited
- Chart Industries
- Dongfang Turbine
- Doosan Skoda Power
- EBARA CORPORATION
- Fuji Electric
- GE Vernova
- Hangzhou Turbine Power Group
- Kawasaki Heavy Industries
- MAN Energy Solutions
- Mitsubishi Heavy Industries
- NCON Turbo Tech
- Shin Nippon Machinery
- Siemens Energy
- Sumitomo Heavy Industries
- Toshiba Energy Systems & Solutions
- Trillium Flow Technologies
- Triveni Turbine
- Turbotech Precision Engineering
The Global Steam Turbine Market was valued at USD 26.2 billion in 2025 and is estimated to grow at a CAGR of 2.8% to reach USD 34.9 billion by 2035.
The market's expansion is driven by rising demand for reliable and efficient electricity alongside the construction of new power plants and the modernization of existing energy infrastructure. Steam turbines convert high-pressure steam into rotational mechanical energy, making them integral to industrial power generation. Increasing industrial electricity requirements, widespread adoption of combined heat and power systems, and integration of advanced control technologies are encouraging new turbine installations. The growing need for high-capacity units to support large-scale power generation further reinforces market growth. Industrialization, expansion of heavy manufacturing, and cogeneration integration continue to shape demand patterns. Energy transition policies are influencing deployment, with renewable applications like biomass and geothermal projects offering opportunities for turbines due to their high thermal efficiency and reliability. Sectors such as chemicals, petrochemicals, refineries, and district heating increasingly depend on turbines for efficient power and heat management.
| Market Scope | |
|---|---|
| Start Year | 2025 |
| Forecast Year | 2026-2035 |
| Start Value | $26.2 Billion |
| Forecast Value | $34.9 Billion |
| CAGR | 2.8% |
The impulse segment is expected to reach USD 5 billion by 2035, driven by demand for compact, high-efficiency, and low-maintenance turbines suited for industrial and utility applications. Its adoption is rising due to robust performance in high-pressure environments and suitability for captive power and process industries.
The >3 MW-100 MW segment generated USD 3.9 billion in 2025. This capacity range supports medium-scale industrial facilities, biomass and waste-to-energy plants, and district heating systems. It balances efficiency, flexibility, and cost, aiding the modernization of captive power infrastructure and ensuring reliable energy output across varied applications.
North America Steam Turbine Market is projected to reach USD 900 million by 2035. Growing adoption in biomass and geothermal plants, along with government programs supporting efficiency improvements, upgrades, and emissions control, will further drive the region's market growth.
Key players in the Global Steam Turbine Market include Siemens Energy, Mitsubishi Heavy Industries, Fuji Electric, Bharat Heavy Electricals Limited, Sumitomo Heavy Industries, Kawasaki Heavy Industries, Triveni Turbine, GE Vernova, Dongfang Turbine, ANSALDO Energia, Doosan Skoda Power, Hangzhou Turbine Power Group, Shin Nippon Machinery, Trillium Flow Technologies, NCON Turbo Tech, Ebara Corporation, Turbotech Precision Engineering, Chart Industries, and Toshiba Energy Systems & Solutions. Companies in the Global Steam Turbine Market are strengthening their position by investing in research and development to enhance the efficiency, reliability, and emissions performance of turbines. Strategic collaborations with power plant operators and technology providers enable deployment in renewable and hybrid energy projects. Firms are also focusing on digitalization, predictive maintenance, and smart control systems to optimize operations.
Table of Contents
Chapter 1 Methodology & Scope
- 1.1 Research design
- 1.1.1 Research approach
- 1.1.2 Data collection methods
- 1.2 Base estimates and calculations
- 1.2.1 Base year calculation
- 1.2.2 Market estimates & forecast parameters
- 1.3 Forecast
- 1.3.1 Key trends for market estimates
- 1.3.2 Quantified market impact analysis
- 1.3.2.1 Mathematical impact of growth parameters on forecast
- 1.3.3 Scenario analysis framework
- 1.4 Primary research and validation
- 1.4.1 Some of the primary sources (but not limited to)
- 1.5 Data mining sources
- 1.5.1 Paid Sources
- 1.5.2 Sources, by region
- 1.6 Research trail & scoring components
- 1.6.1 Research trail components
- 1.6.2 Scoring components
- 1.7 Research transparency addendum
- 1.7.1 Source attribution framework
- 1.7.2 Quality assurance metrics
- 1.7.3 Our commitment to trust
- 1.8 Market definitions
Chapter 2 Executive Summary
- 2.1 Industry synopsis, 2022 - 2035
- 2.1.1 Business trends
- 2.1.2 Design trends
- 2.1.3 Exhaust trends
- 2.1.4 Fuel trends
- 2.1.5 End use trends
- 2.1.6 Capacity trends
- 2.1.7 Technology trends
- 2.1.8 Regional trends
Chapter 3 Industry Insights
- 3.1 Industry ecosystem analysis
- 3.1.1 Raw material availability & sourcing analysis
- 3.1.2 Manufacturing capacity assessment
- 3.1.3 Supply chain resilience & risk factors
- 3.1.4 Distribution network analysis
- 3.2 Regulatory landscape
- 3.3 Industry impact forces
- 3.3.1 Growth drivers
- 3.3.2 Industry pitfalls & challenges
- 3.4 Growth potential analysis
- 3.5 Porter's analysis
- 3.5.1 Bargaining power of suppliers
- 3.5.2 Bargaining power of buyers
- 3.5.3 Threat of new entrants
- 3.5.4 Threat of substitutes
- 3.6 PESTEL analysis
- 3.6.1 Political factors
- 3.6.2 Economic factors
- 3.6.3 Social factors
- 3.6.4 Technological factors
- 3.6.5 Legal factors
- 3.6.6 Environmental factors
- 3.7 Cost structure analysis of steam turbine
- 3.8 Price trend analysis (USD/MW)
- 3.8.1 By region
- 3.8.2 By capacity
- 3.9 Emerging opportunities & trends
- 3.10 Investment analysis & industry 4.0 integration
Chapter 4 Competitive Landscape, 2025
- 4.1 Introduction
- 4.2 Company market share analysis, by region, 2025
- 4.2.1 North America
- 4.2.2 Europe
- 4.2.3 Asia Pacific
- 4.2.4 Middle East & Africa
- 4.2.5 Latin America
- 4.3 Strategic dashboard
- 4.4 Strategic initiatives
- 4.4.1 Key partnerships & collaborations
- 4.4.2 Major M&A activities
- 4.4.3 Product innovations & launches
- 4.4.4 Market expansion strategies
- 4.5 Competitive benchmarking
- 4.6 Innovation & sustainability landscape
Chapter 5 Market Size and Forecast, By Design, 2022 - 2035 (USD Million & MW)
- 5.1 Key trends
- 5.2 Reaction
- 5.3 Impulse
Chapter 6 Market Size and Forecast, By Exhaust, 2022 - 2035 (USD Million & MW)
- 6.1 Key trends
- 6.2 Condensing
- 6.3 Non-condensing
Chapter 7 Market Size and Forecast, By Fuel, 2022 - 2035 (USD Million & MW)
- 7.1 Key trends
- 7.2 Fossil fuel
- 7.3 Biomass
- 7.4 Geothermal
Chapter 8 Market Size and Forecast, By End Use, 2022 - 2035 (USD Million & MW)
- 8.1 Key trends
- 8.2 Industrial
- 8.2.1 Refinery
- 8.2.2 Chemical plant
- 8.2.3 Sugar plant
- 8.2.4 Pulp & paper
- 8.2.5 Others
- 8.3 Utility
Chapter 9 Market Size and Forecast, By Capacity, 2022 - 2035 (USD Million & MW)
- 9.1 Key trends
- 9.2 ≤ 3 MW
- 9.3 > 3 MW - 100 MW
- 9.4 > 100 MW
Chapter 10 Market Size and Forecast, By Technology, 2022 - 2035 (USD Million & MW)
- 10.1 Key trends
- 10.2 Steam cycle
- 10.3 Combined cycle
- 10.4 Cogeneration
Chapter 11 Market Size and Forecast, By Region, 2022 - 2035 (USD Million & MW)
- 11.1 Key trends
- 11.2 North America
- 11.2.1 U.S.
- 11.2.2 Canada
- 11.2.3 Mexico
- 11.3 Europe
- 11.3.1 UK
- 11.3.2 France
- 11.3.3 Russia
- 11.3.4 Germany
- 11.3.5 Spain
- 11.3.6 Italy
- 11.4 Asia Pacific
- 11.4.1 China
- 11.4.2 Japan
- 11.4.3 South Korea
- 11.4.4 India
- 11.4.5 Australia
- 11.4.6 Indonesia
- 11.4.7 Malaysia
- 11.4.8 Thailand
- 11.5 Middle East & Africa
- 11.5.1 Saudi Arabia
- 11.5.2 UAE
- 11.5.3 Iran
- 11.5.4 Egypt
- 11.5.5 South Africa
- 11.5.6 Nigeria
- 11.5.7 Turkey
- 11.5.8 Morocco
- 11.6 Latin America
- 11.6.1 Brazil
- 11.6.2 Argentina
- 11.6.3 Chile
Chapter 12 Company Profiles
- 12.1 Ansaldo Energia
- 12.2 Bharat Heavy Electricals Limited
- 12.3 Chart Industries
- 12.4 Dongfang Turbine
- 12.5 Doosan Skoda Power
- 12.6 EBARA CORPORATION
- 12.7 Fuji Electric
- 12.8 GE Vernova
- 12.9 Hangzhou Turbine Power Group
- 12.10 Kawasaki Heavy Industries
- 12.11 MAN Energy Solutions
- 12.12 Mitsubishi Heavy Industries
- 12.13 NCON Turbo Tech
- 12.14 Shin Nippon Machinery
- 12.15 Siemens Energy
- 12.16 Sumitomo Heavy Industries
- 12.17 Toshiba Energy Systems & Solutions
- 12.18 Trillium Flow Technologies
- 12.19 Triveni Turbine
- 12.20 Turbotech Precision Engineering
 2026年全球蒸气涡轮售后市场报告
 蒸汽轮机
蒸汽轮机 工业电阻式蒸气加湿器市场:依终端用户产业、容量范围、控制方式、通路和维护类型划分,全球预测(2026-2032年)工业蒸气加湿器市场按产品类型、最终用户产业、工作压力、安装方式和分销管道划分,全球预测(2026-2032年)
 全球蒸气涡轮服务市场规模、份额、趋势和成长分析报告(2026-2034年)2026年全球蒸气涡轮市场报告
 全球蒸汽涡轮机市场:依技术、设计、排气系统、应用、燃料和地区划分-市场规模、产业动态、机会分析和预测(2026-2035 年)
 蒸气涡轮市场-全球产业规模、份额、趋势、机会和预测:按类型、额定容量、排气类型、燃料类型、地区和竞争格局划分,2021-2031年蒸气涡轮市场-2026-2031年预测蒸汽涡轮机MRO市场-全球产业规模、份额、趋势、机会和预测,按服务类型、服务提供者、燃料类型、容量、最终用户产业、地区和竞争格局划分,2021-2031年预测