


 |
市场调查报告书
商品编码
1892837
硅光子学市场机会、成长驱动因素、产业趋势分析及预测(2026-2035年)Silicon Photonics Market Opportunity, Growth Drivers, Industry Trend Analysis, and Forecast 2026 - 2035 |
||||||
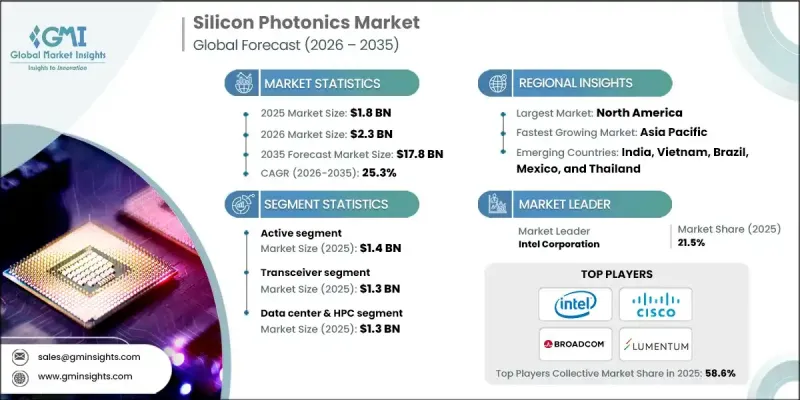
2025 年全球硅光子学市场价值为 18 亿美元,预计到 2035 年将以 25.3% 的复合年增长率成长至 178 亿美元。
为了满足日益增长的云端工作负载需求,超大规模资料中心正在迅速发展,这推动了对高频宽、高能源效率光链路的需求。与传统的铜互连相比,硅光子技术具有更低的延迟、更高的功率效率和更低的能耗,这对于千兆级资料中心和千兆级伺服器环境中的资料密集型操作至关重要。人工智慧和机器学习工作负载需要大规模并行处理以及GPU之间极高的资料传输速率,因此,对于低延迟、高速互连而言,硅光介面必不可少。全球电信营运商正在升级传输网路、城域网路和前传网络,以应对不断增长的5G流量并为早期部署6G做好准备,这使得硅光子技术成为一种经济高效的解决方案,既能扩展网路频宽,又能优化功耗。此外,对支援下一代超级电脑、智慧网路和先进通讯基础设施的紧凑型、高能源效率光互连的需求,也进一步推动了市场的发展。
| 市场范围 | |
|---|---|
| 起始年份 | 2025 |
| 预测年份 | 2026-2035 |
| 起始值 | 18亿美元 |
| 预测值 | 178亿美元 |
| 复合年增长率 | 25.3% |
2025年,有源光模组市场规模将达14亿美元。其成长主要得益于光纤骨干网路的扩展和5G基础设施的部署,这需要高速、低延迟的光互连和交换技术。製造商正致力于优化调製器和光电探测器的主动模组,以支援经济高效的资料中心和5G回传应用,同时实现与现有光纤网路的无缝整合。
预计2026年至2035年间,感测器市场将以33.4%的复合年增长率成长。推动感测器市场普及的因素包括非通讯应用(如医疗诊断和汽车光达)以及物联网、智慧出行和智慧医疗等需要紧凑、高灵敏度光学感测器的领域。
预计到 2035 年,加拿大硅光子学市场将以 12.4% 的复合年增长率成长。截至 2024 年,加拿大拥有超过 239 个营运中的资料中心,并且还有几个新的设施正在开发中。加拿大有利的气候和低成本再生能源(包括水力发电)的获取,使该国成为资料中心扩张和高速光互连技术应用的战略中心。
目录
第一章:方法论与范围
第二章:执行概要
第三章:行业洞察
- 产业生态系分析
- 影响价值链的因素
- 利润率分析
- 中断
- 未来展望
- 製造商
- 经销商
- 衝击力
- 成长驱动因素
- 资料中心需求不断成长
- AI/ML工作负载的爆炸性成长与GPU丛集的扩展
- 电信升级至 5G Advanced 和早期 6G 发展
- 消费性电子产品的普及率不断提高
- 汽车和工业雷射雷达的新兴需求
- 产业陷阱与挑战
- 片上雷射的整合与良率管理
- 高昂的开发和生产成本
- 成长驱动因素
- 成长潜力分析
- 监管环境
- 北美洲
- 欧洲
- 亚太地区
- 拉丁美洲
- 中东和非洲
- 波特的分析
- PESTEL 分析
- 技术与创新格局
- 当前技术趋势
- 新兴技术
- 新兴商业模式
- 合规要求
- 永续性措施
- 消费者情绪分析
- 专利和智慧财产权分析
- 地缘政治与贸易动态
第四章:竞争格局
- 介绍
- 公司市占率分析
- 按地区
- 北美洲
- 欧洲
- 亚太地区
- 拉丁美洲
- 中东和非洲
- 市场集中度分析
- 按地区
- 主要参与者的竞争基准化分析
- 财务绩效比较
- 收入
- 利润率
- 研发
- 产品组合比较
- 产品范围广度
- 科技
- 创新
- 地理分布比较
- 全球足迹分析
- 服务网路覆盖范围
- 按地区分類的市场渗透率
- 竞争定位矩阵
- 领导人
- 挑战者
- 追踪者
- 小众玩家
- 战略展望矩阵
- 财务绩效比较
- 2021-2024 年主要发展动态
- 併购
- 伙伴关係与合作
- 技术进步
- 扩张和投资策略
- 永续发展倡议
- 数位转型计划
- 新兴/新创企业竞争对手格局
第五章:市场估算与预测:依产品划分,2022-2035年
- 收发器
- 可变光衰减器
- 转变
- 电缆
- 感应器
- 其他的
第六章:市场估算与预测:依组件划分,2022-2035年
- 积极的
- 雷射
- 数据机
- 光电探测器
- 其他的
- 被动的
- 筛选
- 波导
第七章:市场估算与预测:依应用领域划分,2022-2035年
- 资料中心和高效能运算
- 电信
- 医疗的
- 其他的
第八章:市场估算与预测:依地区划分,2022-2035年
- 北美洲
- 我们
- 加拿大
- 欧洲
- 英国
- 德国
- 法国
- 义大利
- 西班牙
- 俄罗斯
- 亚太地区
- 中国
- 印度
- 日本
- 韩国
- 澳洲
- 拉丁美洲
- 巴西
- 墨西哥
- MEA
- 南非
- 沙乌地阿拉伯
- 阿联酋
第九章:公司简介
- 全球关键参与者
- Intel
- IBM
- Cisco
- Broadcom
- Ciena
- Juniper
- 区域关键参与者
- 北美洲
- Finisar
- Mellanox
- Luxtera
- Acacia
- 欧洲
- STMicroelectronics
- Rockley Photonics
- Reflex Photonics
- Sicoya
- 亚太地区
- Hamamatsu
- Oclaro
- Ranovus
- GlobalFoundries
- 北美洲
- 小众/颠覆者
- Neophotonics
The Global Silicon Photonics Market was valued at USD 1.8 billion in 2025 and is estimated to grow at a CAGR of 25.3% to reach USD 17.8 billion by 2035.
The rapid growth of hyperscale data centers to accommodate increasing cloud workloads is driving the demand for high-bandwidth, energy-efficient optical links. Silicon photonics provides lower latency, higher power efficiency, and reduced energy consumption compared to traditional copper interconnects, which is critical for data-intensive operations in multi-gigawatt data centers and multi-gig server environments. AI and machine learning workloads require massive parallel processing and extremely high data-transfer rates between GPUs, making optical silicon interfaces essential for low-latency, high-speed interconnections. Telecom operators worldwide are upgrading transport, metro, and fronthaul networks to handle escalating 5G traffic and prepare for early 6G deployment, positioning silicon photonics as a cost-effective solution for scaling network bandwidth while optimizing power consumption. The market is being further propelled by the need for compact, energy-efficient optical interconnects that support next-generation supercomputers, smart networking, and advanced communication infrastructures.
| Market Scope | |
|---|---|
| Start Year | 2025 |
| Forecast Year | 2026-2035 |
| Start Value | $1.8 Billion |
| Forecast Value | $17.8 billion |
| CAGR | 25.3% |
The active segment reached USD 1.4 billion in 2025. Its growth is fueled by expanding fiber backbones and 5G infrastructure deployments, which require high-speed, low-latency optical interconnects and switching. Manufacturers are focusing on optimizing active modules for modulators and photodetectors to support cost-effective data center and 5G backhaul applications while integrating seamlessly into existing fiber networks.
The sensor segment is projected to grow at a CAGR of 33.4% during 2026-2035. Adoption is being driven by non-communication applications such as healthcare diagnostics and automotive LiDAR, as well as IoT, smart mobility, and smart-health initiatives that demand compact, highly sensitive optical sensors.
Canada Silicon Photonics Market is expected to grow at a CAGR of 12.4% by 2035. With over 239 operational data centers as of 2024 and several new facilities under development, Canada's favorable climate and access to low-cost renewable energy, including hydro, position the country as a strategic hub for data center expansion and high-speed optical interconnect adoption.
Leading companies in the Global Silicon Photonics Market include Intel, Cisco, Ciena, Broadcom, Hamamatsu, Juniper, STMicroelectronics, Acacia, Finisar, Global Foundries, IBM, Lumentum, Luxtera, Mellanox, Neophotonics, Oclaro, Ranovus, Reflex Photonics, Rockley Photonics, and Sicoya. Key strategies adopted by companies in the Global Silicon Photonics Market include investing in research and development to enhance optical performance, energy efficiency, and miniaturization. Firms are forming strategic partnerships with cloud service providers, data center operators, and telecom companies to accelerate adoption. Expanding regional presence and targeting emerging markets allow companies to capture new growth opportunities. Additionally, they are focusing on integrated solutions that combine active and passive components for cost-effective deployment.
Table of Contents
Chapter 1 Methodology & Scope
- 1.1 Market scope and definition
- 1.2 Research design
- 1.2.1 Research approach
- 1.2.2 Data collection methods
- 1.3 Data mining sources
- 1.3.1 Global
- 1.3.2 Regional/Country
- 1.4 Base estimates and calculations
- 1.4.1 Base year calculation
- 1.4.2 Key trends for market estimation
- 1.5 Primary research and validation
- 1.5.1 Primary sources
- 1.6 Forecast model
- 1.7 Research assumptions and limitations
Chapter 2 Executive Summary
- 2.1 Industry 360° synopsis
- 2.2 Key market trends
- 2.2.1 Product trends
- 2.2.2 Component trends
- 2.2.3 Application trends
- 2.2.4 Regional trends
- 2.3 TAM Analysis, 2026-2035 (USD Million)
- 2.4 CXO perspectives: Strategic imperatives
- 2.4.1 Executive decision points
- 2.4.2 Critical Success Factors
- 2.5 Future Outlook and Strategic Recommendations
Chapter 3 Industry Insights
- 3.1 Industry ecosystem analysis
- 3.1.1 Factor affecting the value chain
- 3.1.2 Profit margin analysis
- 3.1.3 Disruptions
- 3.1.4 Future outlook
- 3.1.5 Manufacturers
- 3.1.6 Distributors
- 3.2 Impact forces
- 3.2.1 Growth drivers
- 3.2.1.1 Rising data center demands
- 3.2.1.2 Explosive AI/ML Workload Growth and GPU Cluster Expansion
- 3.2.1.3 Telecom Upgrades to 5G Advanced and Early 6G Development
- 3.2.1.4 Increasing adoption in consumer electronics
- 3.2.1.5 Emerging Demand from Automotive and Industrial LiDAR
- 3.2.2 Industry pitfalls & challenges
- 3.2.2.1 Integration of On-Chip Lasers and Yield Management
- 3.2.2.2 High development and production costs
- 3.2.1 Growth drivers
- 3.3 Growth potential analysis
- 3.4 Regulatory landscape
- 3.4.1 North America
- 3.4.2 Europe
- 3.4.3 Asia Pacific
- 3.4.4 Latin America
- 3.4.5 Middle East & Africa
- 3.5 Porter's analysis
- 3.6 PESTEL analysis
- 3.7 Technology and Innovation landscape
- 3.7.1 Current technological trends
- 3.7.2 Emerging technologies
- 3.8 Emerging Business Models
- 3.9 Compliance Requirements
- 3.10 Sustainability Measures
- 3.11 Consumer Sentiment Analysis
- 3.12 Patent and IP analysis
- 3.13 Geopolitical and trade dynamics
Chapter 4 Competitive Landscape, 2025
- 4.1 Introduction
- 4.2 Company market share analysis
- 4.2.1 By region
- 4.2.1.1 North America
- 4.2.1.2 Europe
- 4.2.1.3 Asia Pacific
- 4.2.1.4 Latin America
- 4.2.1.5 Middle East & Africa
- 4.2.2 Market Concentration Analysis
- 4.2.1 By region
- 4.3 Competitive Benchmarking of key Players
- 4.3.1 Financial Performance Comparison
- 4.3.1.1 Revenue
- 4.3.1.2 Profit Margin
- 4.3.1.3 R&D
- 4.3.2 Product Portfolio Comparison
- 4.3.2.1 Product Range Breadth
- 4.3.2.2 Technology
- 4.3.2.3 Innovation
- 4.3.3 Geographic Presence Comparison
- 4.3.3.1 Global Footprint Analysis
- 4.3.3.2 Service Network Coverage
- 4.3.3.3 Market Penetration by Region
- 4.3.4 Competitive Positioning Matrix
- 4.3.4.1 Leaders
- 4.3.4.2 Challengers
- 4.3.4.3 Followers
- 4.3.4.4 Niche Players
- 4.3.5 Strategic outlook matrix
- 4.3.1 Financial Performance Comparison
- 4.4 Key developments, 2021-2024
- 4.4.1 Mergers and Acquisitions
- 4.4.2 Partnerships and Collaborations
- 4.4.3 Technological Advancements
- 4.4.4 Expansion and Investment Strategies
- 4.4.5 Sustainability Initiatives
- 4.4.6 Digital Transformation Initiatives
- 4.5 Emerging/ Startup Competitors Landscape
Chapter 5 Market Estimates & Forecast, By Product, 2022-2035 (USD Million)
- 5.1 Key trends
- 5.2 Transceivers
- 5.3 Variable optical attenuator
- 5.4 Switch
- 5.5 Cable
- 5.6 Sensor
- 5.7 Others
Chapter 6 Market Estimates & Forecast, By Component, 2022-2035 (USD Million)
- 6.1 Key trends
- 6.2 Active
- 6.2.1 Laser
- 6.2.2 Modulator
- 6.2.3 Photodetector
- 6.2.4 Others
- 6.3 Passive
- 6.3.1 Filter
- 6.3.2 Waveguide
Chapter 7 Market Estimates & Forecast, By Application, 2022-2035 (USD Million)
- 7.1 Key trends
- 7.2 Data center & HPC
- 7.3 Telecommunications
- 7.4 Medical
- 7.5 Others
Chapter 8 Market Estimates & Forecast, By Region, 2022-2035 (USD Million)
- 8.1 Key trends
- 8.2 North America
- 8.2.1 U.S.
- 8.2.2 Canada
- 8.3 Europe
- 8.3.1 UK
- 8.3.2 Germany
- 8.3.3 France
- 8.3.4 Italy
- 8.3.5 Spain
- 8.3.6 Russia
- 8.4 Asia Pacific
- 8.4.1 China
- 8.4.2 India
- 8.4.3 Japan
- 8.4.4 South Korea
- 8.4.5 Australia
- 8.5 Latin America
- 8.5.1 Brazil
- 8.5.2 Mexico
- 8.6 MEA
- 8.6.1 South Africa
- 8.6.2 Saudi Arabia
- 8.6.3 UAE
Chapter 9 Company Profiles
- 9.1 Global Key Players
- 9.1.1 Intel
- 9.1.2 IBM
- 9.1.3 Cisco
- 9.1.4 Broadcom
- 9.1.5 Ciena
- 9.1.6 Juniper
- 9.2 Regional Key Players
- 9.2.1 North America
- 9.2.1.1 Finisar
- 9.2.1.2 Mellanox
- 9.2.1.3 Luxtera
- 9.2.1.4 Acacia
- 9.2.2 Europe
- 9.2.2.1 STMicroelectronics
- 9.2.2.2 Rockley Photonics
- 9.2.2.3 Reflex Photonics
- 9.2.2.4 Sicoya
- 9.2.3 Asia Pacific
- 9.2.3.1 Hamamatsu
- 9.2.3.2 Oclaro
- 9.2.3.3 Ranovus
- 9.2.3.4 GlobalFoundries
- 9.2.1 North America
- 9.3 Niche / Disruptors
- 9.3.1 Neophotonics
 全球光子封装市场(2026-2036)
 硅光电市场分析及预测(至2035年):依类型、产品、服务、技术、组件、应用、材料类型、装置、部署及最终用户划分
 硅光电市场报告:按产品、组件、应用和地区划分(2026-2034 年)
 2026年全球硅光电市场报告全球硅光子市场:市场规模、占有率、成长率、产业分析、依类型、应用和地区划分的分析以及未来预测(2026-2034)
 硅光电晶片市场(资料通讯):按数据速率、整合类型、外形规格、波长类型、应用和最终用户划分,全球预测(2026-2032年)硅光电模组市场:按组件类型、资料速率、波长、技术、应用和最终用户划分 - 全球预测 2026-2032通讯用硅光电晶片市场:按组件、数据速率、波长、整合度、应用和最终用户划分,全球预测,2026-2032年日本硅光子学市场报告(按产品、组件(光波导、光调製器、光电探测器、波分复用滤波器、雷射)、应用和地区划分,2026-2034 年)
 硅光电市场规模、份额和成长分析(按组件、产品和地区划分)-2026-2033年产业预测