


 |
市场调查报告书
商品编码
1892892
自动驾驶汽车市场机会、成长驱动因素、产业趋势分析及预测(2026-2035年)Autonomous Vehicle Market Opportunity, Growth Drivers, Industry Trend Analysis, and Forecast 2026 - 2035 |
||||||
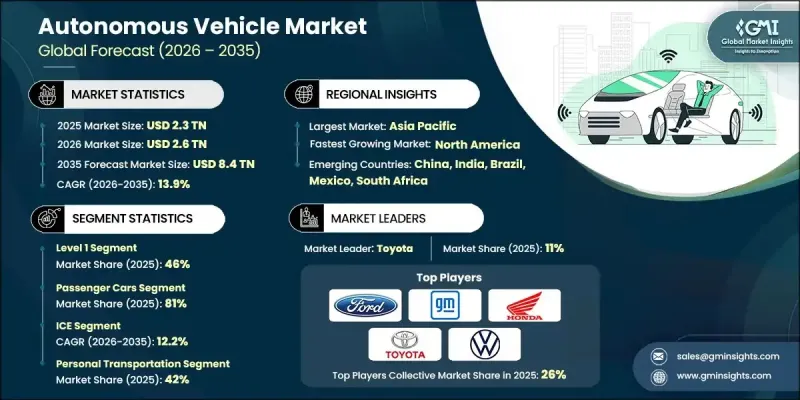
2025年全球自动驾驶汽车市场价值为2.3兆美元,预计2035年将以13.9%的复合年增长率成长至8.4兆美元。
模拟市场正成为开发、验证和完善自动驾驶系统的重要支柱。这些模拟技术能够创造可控、可重复且高度可扩展的虚拟环境,使开发人员能够分析车辆在各种复杂驾驶场景下的反应。汽车製造商、技术供应商和研究机构在自动驾驶汽车开发的整个生命週期中越来越依赖模拟技术,以满足严格的性能、安全性和监管要求。人工智慧、机器学习和运算基础设施的持续进步也提升了这些平台的深度和精度。现今的仿真环境涵盖了从精细环境建模到云端仿真,以及支援完整端到端测试工作流程的扩展开发流程。随着半自动驾驶系统的日益成熟,模拟工具在研究人机互动、预测驾驶员反应和评估协同决策方面发挥着至关重要的作用,而这需要更丰富、更分层的虚拟评估。
| 市场范围 | |
|---|---|
| 起始年份 | 2025 |
| 预测年份 | 2026-2035 |
| 起始值 | 2.3兆美元 |
| 预测值 | 8.4兆美元 |
| 复合年增长率 | 13.9% |
2025年,L1级自动驾驶系统市占率达到46%,预计2026年至2035年间将以13%的复合年增长率成长。该细分市场的强劲表现得益于监管部门的支持以及其在大众市场车辆中的广泛应用。 L1级系统提供单一功能的驾驶辅助,例如自适应巡航控制和车道维持辅助,但需要驾驶者保持高度注意力。随着监管机构对车辆安全的日益重视,以及保险资料显示事故风险降低,预计将创造巨大的成长机会,到2035年,L1级自动驾驶系统市场规模预计将达到3.69兆美元。
2025年,乘用车市占率占比达到81%,预计到2035年将以12.6%的复合年增长率成长。其市场主导地位主要归功于L1和L2级高阶驾驶辅助系统(ADAS)的广泛应用,目前已开发地区超过70%的新车都标配了这些系统。政府强制政策、安全性能的提升以及这些技术在中高阶车型中日益普及,正在加速消费者对辅助驾驶的接受度,使其成为全球主流功能。
预计到2025年,美国自动驾驶汽车市场规模将达到4,102亿美元。该地区的企业正在利用人工智慧和机器学习技术来提升车辆安全性、改善交通预测,并在复杂的城市和高速公路环境中实现更智慧的决策。大型科技公司和创新新创公司都在探索将自动驾驶汽车应用于叫车和配送服务等领域,为城市出行提供经济高效、可扩展的解决方案,并变革交通运输营运模式。
目录
第一章:方法论
第二章:执行概要
第三章:行业洞察
- 产业生态系分析
- 供应商格局
- 利润率
- 成本结构
- 每个阶段的价值增加
- 影响价值链的因素
- 中断
- 产业影响因素
- 成长驱动因素
- 对道路安全的需求日益增长
- 人工智慧和感测器技术的进步
- 政府法规和激励措施
- 不断发展的共乘和出行服务
- 产业陷阱与挑战
- 监管和法律方面的不确定性
- 高昂的研发与部署成本
- 市场机会
- 城市交通解决方案的扩展
- 与科技新创公司和原始设备製造商合作
- 自动驾驶车队的数据货币化
- 与智慧城市基础建设的融合
- 成长驱动因素
- 成长潜力分析
- 监管环境
- 全球的
- 联合国欧洲经济委员会WP.29框架与工作小组
- 联合国第155号条例
- 联合国第156号条例
- 联合国第157号条例
- 北美洲
- 美国联邦框架
- 美国国家公路交通安全管理局 (NHTSA) 自动驾驶车辆政策与指南
- 欧洲
- 欧盟型式认可条例 2019/2144
- 车辆一般安全条例(GSR)
- 亚太地区
- 中国工信部和国家发展改革委员会国家战略
- 中国智慧网联汽车标准
- 拉丁美洲
- 中东和非洲
- 全球的
- 波特的分析
- PESTEL 分析
- 技术与创新格局
- 当前技术趋势
- 光达技术(机械式、固态式、FMCW)
- 雷达技术(77-79 GHz,4D成像雷达)
- V2X 通讯协定
- 5G网路集成
- 新兴技术
- 调频连续波(FMCW)雷射雷达
- 具有高度探测功能的 4D 成像雷达
- 热成像及红外线摄影机
- 硬体安全模组(HSM)
- 当前技术趋势
- 定价分析
- 组件定价趋势
- 车辆增加成本分析
- 服务定价模式
- 生产统计
- 生产中心
- 消费中心
- 进出口
- 成本細項分析
- 自动驾驶汽车系统成本结构
- 製造和生产成本
- 营运成本分析
- 研发投资需求
- 价值链利润分析
- 专利分析
- 全球专利申请趋势
- 按技术领域分類的专利分布
- 领先的专利持有者和创新领导者
- IP活动的地理分布
- 永续性和环境方面
- 永续实践
- 减少废弃物策略
- 生产中的能源效率
- 环保倡议
- 碳足迹考量
- 投资与融资分析
- 创投与私募股权投资趋势
- 企业投资与策略收购
- 併购活动及估值倍数
- 各国政府资助研发项目
- 最终使用者行为及采纳分析
- 消费者乘用车细分市场
- 商业车队营运商的行为
- 叫车和行动支付用户行为
- 配送服务最终用户行为
- 工业及非道路最终用途行为
- 风险评估与缓解框架
- 技术风险
- 网路安全风险
- 安全与责任风险
- 监理和政策风险
- 供应链风险
第四章:竞争格局
- 介绍
- 公司市占率分析
- 北美洲
- 欧洲
- 亚太地区
- 拉丁美洲
- MEA
- 主要市场参与者的竞争分析
- 竞争定位矩阵
- 战略展望矩阵
- 关键进展
- 併购
- 合作伙伴关係与合作
- 新产品发布
- 扩张计划和资金
第五章:市场估计与预测:依自主程度划分,2022-2035年
- 一级
- 二级
- 3级
- 4级
- 5级
第六章:市场估价与预测:依车辆类型划分,2022-2035年
- 搭乘用车
- SUV
- 轿车
- 掀背车
- 商用车辆
- 轻型商用车(LCV)
- 中型商用车(MCV)
- 重型商用车(HCV)
第七章:市场估算与预测:依燃料类型划分,2022-2035年
- 冰
- 电的
- 杂交种
第八章:市场估算与预测:依应用领域划分,2022-2035年
- 个人交通工具
- 大众运输
- 货物运输
- 工业应用
- 其他的
第九章:市场估算与预测:依感测器类型划分,2022-2035年
- 光达
- 雷达
- 相机
- 超音波感测器
- GPS/IMU系统
第十章:市场估计与预测:依地区划分,2022-2035年
- 北美洲
- 我们
- 加拿大
- 欧洲
- 德国
- 英国
- 法国
- 义大利
- 西班牙
- 北欧
- 俄罗斯
- 波兰
- 罗马尼亚
- 亚太地区
- 中国
- 印度
- 日本
- 韩国
- 澳新银行
- 越南
- 印尼
- 拉丁美洲
- 巴西
- 墨西哥
- 阿根廷
- MEA
- 南非
- 沙乌地阿拉伯
- 阿联酋
第十一章:公司简介
- 全球公司
- Toyota
- Volkswagen
- General Motors
- Tesla
- BMW
- Mercedes-Benz
- Ford
- Nissan
- Honda
- Hyundai
- Waymo (Alphabet)
- 区域冠军
- Aurora Innovation
- AutoX
- Einride
- Motional (Hyundai-Aptiv JV)
- Oxbotica
- Plus (Formerly Plus.ai)
- Pony.ai
- Wayve Technologies
- WeRide
- Zoox
- 新兴玩家
- Beep
- EasyMile SAS
- Gatik
- Ghost Autonomy
- Helm.ai
- Kodiak Robotics
- May Mobility
- Navya
- Nuro
The Global Autonomous Vehicle Market was valued at USD 2.3 trillion in 2025 and is estimated to grow at a CAGR of 13.9% to reach USD 8.4 trillion by 2035.
This market is becoming a fundamental pillar in developing, validating, and refining autonomous driving systems. These simulation technologies create controlled, repeatable, and highly scalable virtual settings that allow developers to analyze how vehicles react to a wide range of complex driving scenarios. Automakers, technology providers, and research organizations increasingly depend on simulation throughout the entire lifecycle of autonomous vehicle development as they work to meet strict performance, safety, and regulatory requirements. Continuous progress in artificial intelligence, machine learning, and computing infrastructure is also improving the depth and accuracy of these platforms. Today's simulation environments span from detailed environment modeling to cloud-enabled simulations and expanded development pipelines that support full end-to-end testing workflows. As semi-autonomous systems mature, simulation tools play a crucial role in studying human-machine interaction, forecasting driver reactions, and evaluating shared decision-making, which requires richer, layered virtual assessments.
| Market Scope | |
|---|---|
| Start Year | 2025 |
| Forecast Year | 2026-2035 |
| Start Value | $2.3 Trillion |
| Forecast Value | $8.4 Trillion |
| CAGR | 13.9% |
The Level 1 segment held a 46% share in 2025 and is projected to grow at a CAGR of 13% between 2026 and 2035. This segment's strong performance is driven by regulatory support and its widespread adoption in mass-market vehicles. Level 1 systems offer single-function driver assistance, such as adaptive cruise control and lane-keeping support, while requiring the driver to remain fully attentive. Increasing regulatory focus on vehicle safety, along with insurance data highlighting reduced accident risks, is expected to create significant growth opportunities, with the Level 1 market projected to reach USD 3.69 trillion by 2035.
The passenger car segment accounted for an 81% share in 2025 and is expected to grow at a CAGR of 12.6% through 2035. Its dominance is due to the widespread integration of Level 1 and Level 2 advanced driver-assistance systems (ADAS), which are now standard in over 70% of new vehicles in developed regions. Government mandates, enhanced safety benefits, and increasing availability of these technologies across premium and mid-range vehicles are accelerating consumer acceptance of assisted driving, making it a mainstream feature globally.
U.S. Autonomous Vehicle Market reached USD 410.2 billion in 2025. Companies in the region are leveraging artificial intelligence and machine learning to enhance vehicle safety, improve traffic prediction, and enable smarter decision-making in complex urban and highway environments. Both major tech firms and innovative startups are exploring autonomous vehicles for applications such as ride-hailing and delivery services, offering cost-efficient, scalable solutions for urban mobility and transforming transportation operations.
Key companies active in the Global Autonomous Vehicle Market include aiMotive, Altair, Ansys, Dassault, Foretellix, Hexagon AB, IPG Automotive, LG, Mechanical Simulation, and Siemens. Companies in this market are reinforcing their competitive edge by enhancing simulation realism, building higher-fidelity digital twins, and integrating AI-driven analytics that improve scenario generation and automated validation. Many are expanding cloud-based platforms to support scalable testing for global teams, while still offering secure on-premises systems for customers with strict data governance needs. Vendors are also forming partnerships with OEMs, Tier 1 suppliers, and sensor manufacturers to create unified testing ecosystems that replicate full-vehicle behavior. Continuous updates that incorporate new driving regulations, road environments, and edge-case libraries help strengthen long-term customer reliance on their platforms.
Table of Contents
Chapter 1 Methodology
- 1.1 Market scope and definition
- 1.2 Research design
- 1.2.1 Research approach
- 1.2.2 Data collection methods
- 1.3 Data mining sources
- 1.3.1 Global
- 1.3.2 Regional/Country
- 1.4 Base estimates and calculations
- 1.4.1 Base year calculation
- 1.4.2 Key trends for market estimation
- 1.5 Primary research and validation
- 1.5.1 Primary sources
- 1.6 Forecast model
- 1.7 Research assumptions and limitations
Chapter 2 Executive Summary
- 2.1 Industry 3600 synopsis
- 2.2 Key market trends
- 2.2.1 Regional
- 2.2.2 Level of autonomy
- 2.2.3 Vehicle
- 2.2.4 Fuel
- 2.2.5 Application
- 2.2.6 Sensor
- 2.3 TAM analysis, 2026-2035
- 2.4 CXO perspectives: Strategic imperatives
- 2.4.1 Executive decision points
- 2.4.2 Critical success factors
- 2.5 Future outlook
- 2.6 Strategic recommendations
Chapter 3 Industry Insights
- 3.1 Industry ecosystem analysis
- 3.1.1 Supplier landscape
- 3.1.2 Profit margin
- 3.1.3 Cost structure
- 3.1.4 Value addition at each stage
- 3.1.5 Factor affecting the value chain
- 3.1.6 Disruptions
- 3.2 Industry impact forces
- 3.2.1 Growth drivers
- 3.2.1.1 Increasing demand for road safety
- 3.2.1.2 Advances in AI and sensor technologies
- 3.2.1.3 Government regulations and incentives
- 3.2.1.4 Growing ridesharing and mobility services
- 3.2.2 Industry pitfalls and challenges
- 3.2.2.1 Regulatory and legal uncertainties
- 3.2.2.2 High R&D and deployment costs
- 3.2.3 Market opportunities
- 3.2.3.1 Expansion in urban mobility solutions
- 3.2.3.2 Collaboration with tech startups and OEMs
- 3.2.3.3 Data monetization from autonomous fleets
- 3.2.3.4 Integration with smart city infrastructure
- 3.2.1 Growth drivers
- 3.3 Growth potential analysis
- 3.4 Regulatory landscape
- 3.4.1 Global
- 3.4.1.1 UNECE WP.29 framework & working groups
- 3.4.1.2 UN Regulation 155
- 3.4.1.3 UN Regulation 156
- 3.4.1.4 UN Regulation 157
- 3.4.2 North America
- 3.4.2.1 United States federal framework
- 3.4.2.2 NHTSA automated vehicles policy & guidance
- 3.4.3 Europe
- 3.4.3.1 EU Type-Approval Regulation 2019/2144
- 3.4.3.2 Vehicle General Safety Regulation (GSR)
- 3.4.4 Asia Pacific
- 3.4.4.1 China MIIT & NDRC National Strategy
- 3.4.4.2 China Intelligent & Connected Vehicle Standards
- 3.4.5 Latin America
- 3.4.6 Middle East & Africa
- 3.4.1 Global
- 3.5 Porter's analysis
- 3.6 PESTEL analysis
- 3.7 Technology and innovation landscape
- 3.7.1 Current technological trends
- 3.7.1.1 LiDAR Technology (Mechanical, Solid-State, FMCW)
- 3.7.1.2 Radar Technology (77-79 GHz, 4D Imaging Radar)
- 3.7.1.3 V2X communication protocols
- 3.7.1.4 5G network integration
- 3.7.2 Emerging technologies
- 3.7.2.1 Frequency-modulated continuous wave (FMCW) LiDAR
- 3.7.2.2 4D imaging radar with elevation detection
- 3.7.2.3 Thermal & infrared cameras
- 3.7.2.4 Hardware security modules (HSM)
- 3.7.1 Current technological trends
- 3.8 Pricing analysis
- 3.8.1.1 Component pricing trends
- 3.8.1.2 Vehicle incremental cost analysis
- 3.8.1.3 Service pricing models
- 3.9 Production statistics
- 3.9.1 Production hubs
- 3.9.2 Consumption hubs
- 3.9.3 Export and import
- 3.10 Cost breakdown analysis
- 3.10.1 Autonomous vehicle system cost structure
- 3.10.2 Manufacturing & production costs
- 3.10.3 Operating cost analysis
- 3.10.4 R&D investment requirements
- 3.10.5 Value chain margin analysis
- 3.11 Patent analysis
- 3.11.1 Global patent filing trends
- 3.11.2 Patent distribution by technology domain
- 3.11.3 Leading patent holders & innovation leaders
- 3.11.4 Geographic distribution of IP activity
- 3.12 Sustainability and environmental aspects
- 3.12.1 Sustainable practices
- 3.12.2 Waste reduction strategies
- 3.12.3 Energy efficiency in production
- 3.12.4 Eco-friendly initiatives
- 3.12.5 Carbon footprint considerations
- 3.13 Investment & funding analysis
- 3.13.1 Venture capital & private equity investment trends
- 3.13.2 Corporate investment & strategic acquisitions
- 3.13.3 M&A activity & valuation multiples
- 3.13.4 Government funding & R&D programs by country
- 3.14 End use behavior & adoption analysis
- 3.14.1 Consumer passenger vehicle segment
- 3.14.2 Commercial fleet operator behavior
- 3.14.3 Ride-hailing & maas user behavior
- 3.14.4 Delivery service End use behavior
- 3.14.5 Industrial & off-road End use behavior
- 3.15 Risk assessment & mitigation framework
- 3.15.1 Technology risks
- 3.15.2 Cybersecurity risks
- 3.15.3 Safety & liability risks
- 3.15.4 Regulatory & policy risks
- 3.15.5 Supply chain risks
Chapter 4 Competitive Landscape, 2025
- 4.1 Introduction
- 4.2 Company market share analysis
- 4.2.1 North America
- 4.2.2 Europe
- 4.2.3 Asia Pacific
- 4.2.4 LATAM
- 4.2.5 MEA
- 4.3 Competitive analysis of major market players
- 4.4 Competitive positioning matrix
- 4.5 Strategic outlook matrix
- 4.6 Key developments
- 4.6.1 Mergers & acquisitions
- 4.6.2 Partnerships & collaborations
- 4.6.3 New product launches
- 4.6.4 Expansion plans and funding
Chapter 5 Market Estimates & Forecast, By Level of Autonomy, 2022 - 2035 ($Bn, Units)
- 5.1 Key trends
- 5.2 Level 1
- 5.3 Level 2
- 5.4 Level 3
- 5.5 Level 4
- 5.6 Level 5
Chapter 6 Market Estimates & Forecast, By Vehicle, 2022 - 2035 ($Bn, Units)
- 6.1 Key trends
- 6.2 Passenger cars
- 6.2.1 SUV
- 6.2.2 Sedan
- 6.2.3 Hatchback
- 6.3 Commercial vehicles
- 6.3.1 Light commercial vehicles (LCV)
- 6.3.2 Medium commercial vehicles (MCV)
- 6.3.3 Heavy commercial vehicles (HCV)
Chapter 7 Market Estimates & Forecast, By Fuel, 2022 - 2035 ($Bn, Units)
- 7.1 Key trends
- 7.2 ICE
- 7.3 Electric
- 7.4 Hybrid
Chapter 8 Market Estimates & Forecast, By Application, 2022 - 2035 ($Bn, Units)
- 8.1 Key trends
- 8.2 Personal transportation
- 8.3 Public transportation
- 8.4 Goods transportation
- 8.5 Industrial applications
- 8.6 Others
Chapter 9 Market Estimates & Forecast, By Sensor, 2022 - 2035 ($Bn, Units)
- 9.1 Key trends
- 9.2 LiDAR
- 9.3 Radar
- 9.4 Cameras
- 9.5 Ultrasonic sensors
- 9.6 GPS/IMU systems
Chapter 10 Market Estimates & Forecast, By Region, 2022 - 2035 ($Bn, Units)
- 10.1 Key trends
- 10.2 North America
- 10.2.1 US
- 10.2.2 Canada
- 10.3 Europe
- 10.3.1 Germany
- 10.3.2 UK
- 10.3.3 France
- 10.3.4 Italy
- 10.3.5 Spain
- 10.3.6 Nordics
- 10.3.7 Russia
- 10.3.8 Poland
- 10.3.9 Romania
- 10.4 Asia Pacific
- 10.4.1 China
- 10.4.2 India
- 10.4.3 Japan
- 10.4.4 South Korea
- 10.4.5 ANZ
- 10.4.6 Vietnam
- 10.4.7 Indonesia
- 10.5 Latin America
- 10.5.1 Brazil
- 10.5.2 Mexico
- 10.5.3 Argentina
- 10.6 MEA
- 10.6.1 South Africa
- 10.6.2 Saudi Arabia
- 10.6.3 UAE
Chapter 11 Company Profiles
- 11.1 Global companies
- 11.1.1 Toyota
- 11.1.2 Volkswagen
- 11.1.3 General Motors
- 11.1.4 Tesla
- 11.1.5 BMW
- 11.1.6 Mercedes-Benz
- 11.1.7 Ford
- 11.1.8 Nissan
- 11.1.9 Honda
- 11.1.10 Hyundai
- 11.1.11 Waymo (Alphabet)
- 11.2 Regional Champions
- 11.2.1 Aurora Innovation
- 11.2.2 AutoX
- 11.2.3 Einride
- 11.2.4 Motional (Hyundai-Aptiv JV)
- 11.2.5 Oxbotica
- 11.2.6 Plus (Formerly Plus.ai)
- 11.2.7 Pony.ai
- 11.2.8 Wayve Technologies
- 11.2.9 WeRide
- 11.2.10 Zoox
- 11.3 Emerging players
- 11.3.1 Beep
- 11.3.2 EasyMile SAS
- 11.3.3 Gatik
- 11.3.4 Ghost Autonomy
- 11.3.5 Helm.ai
- 11.3.6 Kodiak Robotics
- 11.3.7 May Mobility
- 11.3.8 Navya
- 11.3.9 Nuro
 Ultracruise 与城市自动驾驶市场机会、成长要素、产业趋势分析及 2026 年至 2035 年预测
 全球自动驾驶汽车市场规模、份额、趋势和成长分析报告(2026-2034)
 2026-2030年全球L4级自动驾驶汽车市场
 按自主等级、推进方式、负载容量、车辆类型、应用和最终用户产业分類的全球自主物流车辆市场预测(2026-2032年)按营运模式、车辆类型、自动驾驶等级、所有权模式和应用程式分類的按需自动驾驶出行市场,全球预测,2026-2032年重型自主移动机器人市场:按导航技术、有效载荷能力、机器人类型、电池类型、环境、终端用户产业和应用划分-全球预测(2026-2032 年)
 全球国防机器人与自动驾驶车辆市场(2026-2036)L4级自动驾驶汽车市场:按组件、车辆类型、动力系统、国家及地区划分-全球产业分析、市场规模、市场份额及2025-2032年预测
 2032年自动驾驶合规系统市场预测:按合规类型、部署模式、车辆类型、技术、最终用户和地区分類的全球分析全球自主物流协调市场预测(至2032年):依解决方案类型、组件、技术、应用、最终用户和地区划分