


 |
市场调查报告书
商品编码
1892894
电动运输工具市场机会、成长驱动因素、产业趋势分析及预测(2026-2035年)Electric Transporters Market Opportunity, Growth Drivers, Industry Trend Analysis, and Forecast 2026 - 2035 |
||||||
2025年全球电动运输工具市场价值为5,79亿美元,预计2035年将以8.2%的复合年增长率成长至1,209亿美元。
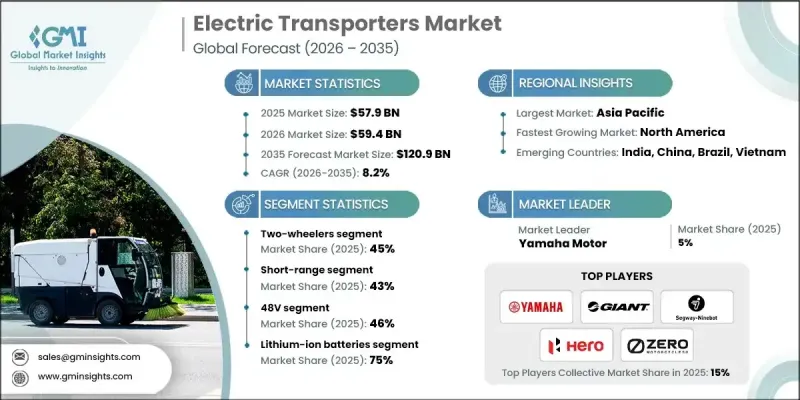
由于燃料成本上涨和传统能源市场持续动盪,企业正稳步转向电动出行。随着油价逼近每桶80美元(预计还会上涨5美元),电动运输工具正成为更具成本效益的替代方案,既能降低燃料成本,也能减少维护需求。这些车辆的整体拥有成本越来越低,尤其是在电力价格稳定或再生能源资源丰富的地区。主要城市人口的快速成长持续给城市道路网络带来压力,超过10亿人仍然缺乏可靠的全天候道路。随着交通拥堵日益严重,小型电动运输工具正获得越来越多的发展动力。电子商务的蓬勃发展加速了对用于最后一公里配送的电动货运车辆的需求,而标准化资料格式和通讯协定的技术进步则提高了平台间的互通性。监管政策的不断完善以及全球范围内为加强安全性和相容性所做的努力,也正在加速电动运输工具在消费者和商业应用场景中的普及。
| 市场范围 | |
|---|---|
| 起始年份 | 2025 |
| 预测年份 | 2026-2035 |
| 起始值 | 579亿美元 |
| 预测值 | 1209亿美元 |
| 复合年增长率 | 8.2% |
2025年,两轮车细分市场占据45%的市场份额,预计从2026年到2035年将以8.5%的复合年增长率成长。该细分市场引领电气化进程,因为它需要相对较小的电池系统,这有助于在行业整体电池成本持续下降的情况下保持价格竞争力。
短程电动车市场在2025年占据43%的份额,预计到2035年将以8.6%的最高成长率成长。这类车辆专为100公里以下的日常城市出行而设计,并可利用现有的充电基础设施。其低成本、轻量化设计、操控性和易于停车等优点,吸引了通勤者以及专注于微出行和最后一公里配送的企业。
亚太地区电动交通工具市场在2025年占了73%的市场份额,预计在2025年至2034年期间将以7.8%的复合年增长率成长。中国强劲的生产活动以及印度和东南亚市场日益增长的接受度继续推动该地区的市场主导地位。中国约占全球电动交通工具销量的78%,这得益于消费者的广泛接受、政府的支持以及庞大的产业产能。
目录
第一章:方法论
第二章:执行概要
第三章:行业洞察
- 产业生态系分析
- 供应商格局
- 利润率分析
- 成本结构
- 每个阶段的价值增加
- 影响价值链的因素
- 中断
- 产业影响因素
- 成长驱动因素
- 都市化和交通拥堵
- 环境问题和监管支持
- 电子商务和物流的成长
- 电池技术的进步和成本的下降
- 燃油价格上涨和营运成本下降
- 产业陷阱与挑战
- 充电基础设施不足和里程焦虑
- 前期成本高,投资回收期长
- 市场机会
- 拓展最后一公里配送解决方案
- 电池更换和快速充电基础设施的发展
- 与智慧城市和城市交通计划的融合
- 物流和公共运输车队电气化
- 技术创新和模组化车辆设计
- 成长潜力分析
- 监管环境
- 全球监管概览
- 北美监理框架
- 欧洲监管框架
- 亚太地区监理框架
- 拉丁美洲监管框架
- 中东和非洲监管框架
- 安全标准与认证
- 网路安全和资料隐私法规
- 环境与排放法规
- 监理合规成本分析
- 全球监管概览
- 波特的分析
- PESTEL 分析
- 技术与创新格局
- 当前技术趋势
- 电池技术
- 马达技术
- 电力电子与控制系统
- 互联互通与远端资讯处理
- 充电基础设施
- 新兴技术
- 下一代电池技术
- 先进的充电技术
- 自动驾驶和ADAS功能
- 高级连结(新兴)
- 车网互动(V2G)技术
- 当前技术趋势
- 价格趋势
- 按地区
- 副产品
- 生产统计
- 生产中心
- 消费中心
- 进出口
- 定价分析与市场经济学
- 价格趋势概述
- 按车辆类型定价
- 区域定价差异
- 电池成本对车辆定价的影响
- 总拥有成本 (TCO) 分析
- 政府激励措施和补贴的影响
- 共享微出行定价模式
- 价格弹性分析
- 未来价格展望
- 成本細項分析
- 製造成本结构
- 研发成本分析
- 监理合规成本
- 分销和物流成本
- 行销和销售成本
- 营运成本(共享出行)
- 充电基础设施成本
- 保固及售后成本
- 成本削减路线图
- 专利分析
- 永续性和环境方面
- 永续实践
- 减少废弃物策略
- 生产中的能源效率
- 环保倡议
- 碳足迹考量
- 最终使用者行为分析
- 消费者采纳模式
- 使用模式和行程特征
- 模式选择与替代分析
- 购买决策因素
- 共享出行用户行为
- 车队营运决策
- 公车机构采购行为
- 安全意识与风险意识
- 品牌忠诚度与转换行为
- 未来行为趋势
- 风险评估与缓解框架
- 技术风险
- 监理与合规风险
- 供应链风险
- 市场和竞争风险
- 财务风险
- 营运风险(共享出行)
- 声誉和品牌风险
- 环境与气候风险
- 保险和责任风险
- 风险优先矩阵
- 未来展望与机会
- 新兴科技趋势
- 监理演变及影响
- 商业模式创新
- 投资机会
- 策略建议
- 风险分析与缓解策略
- 情境分析
第四章:竞争格局
- 介绍
- 公司市占率分析
- 北美洲
- 欧洲
- 亚太地区
- 拉丁美洲
- MEA
- 主要市场参与者的竞争分析
- 竞争定位矩阵
- 战略展望矩阵
- 关键进展
- 併购
- 合作伙伴关係与合作
- 新产品发布
- 扩张计划和资金
第五章:市场估算与预测:依电动车划分,2022-2035年
- 两轮车
- 电动自行车
- 电动滑板车
- 电动摩托车
- 三轮车
- 个人运输工具
- 滑板
- 悬浮滑板
第六章:市场估算与预测:依电压等级划分,2022-2035年
- 24伏
- 36伏
- 48伏
- 高于 48V
第七章:市场估计与预测:依电池类型划分,2022-2035年
- 锂离子
- 铅酸
- 镍氢化物
- 固态
第八章:市场估算与预测:依区间划分,2022-2035年
- 短程(城市,≤100 公里/天)
- 中程(区域性,100-300公里/天)
- 远程(≥300公里/天)
第九章:市场估算与预测:依应用领域划分,2022-2035年
- 微出行
- 共乘
- 货运及货物运输
- 大众运输
- 个人休閒
- 其他的
第十章:市场估计与预测:依最终用途划分,2022-2035年
- 个人购买
- 商业企业
- 政府和非营利组织买家
- 工业与物流
- 其他的
第十一章:市场估计与预测:按地区划分,2022-2035年
- 北美洲
- 我们
- 加拿大
- 欧洲
- 德国
- 英国
- 法国
- 义大利
- 西班牙
- 俄罗斯
- 北欧
- 葡萄牙
- 克罗埃西亚
- 亚太地区
- 中国
- 印度
- 日本
- 澳洲
- 韩国
- 新加坡
- 泰国
- 印尼
- 越南
- 拉丁美洲
- 巴西
- 墨西哥
- 阿根廷
- MEA
- 南非
- 沙乌地阿拉伯
- 阿联酋
- 土耳其
第十二章:公司简介
- 全球参与者
- Accell
- Bosch eBike Systems
- BYD Company
- CATL (Contemporary Amperex Technology)
- Energica Motor Company
- NIU Technologies
- Proterra
- Segway Ninebot
- Yadea
- Zero Motorcycles
- 区域玩家
- Giant Manufacturing
- Harley-Davidson
- Nova Bus
- Stromer
- Gazelle
- Tern Bicycles
- Gogoro
- Ather Energy
- Hero Motorcorp
- Piaggio
- Emerging Technology Innovators
- Lime
- Aventon Bikes
- Tier Mobility
- BMW Motorrad
- Yamaha Motor
The Global Electric Transporters Market was valued at USD 57.9 billion in 2025 and is estimated to grow at a CAGR of 8.2% to reach USD 120.9 billion by 2035.
Businesses are steadily shifting toward electric mobility due to rising fuel costs and ongoing instability in conventional energy markets. As oil prices move toward USD 80 per barrel with an expected USD 5 per barrel increase, electric transporters are becoming cost-efficient alternatives that reduce both fuel spending and maintenance needs. These vehicles increasingly present a favorable total cost of ownership, particularly in regions with dependable electricity rates or strong access to renewable power. Rapid population growth in major cities continues to strain urban road networks, and more than 1 billion people still lack reliable all-weather roads. As traffic congestion worsens, compact electric transporters are gaining momentum. Expanding e-commerce is accelerating demand for electric cargo transporters used in last-mile delivery, while technological progress in standardized data formats and communication protocols is improving platform interoperability. Advancing regulatory clarity and global efforts to strengthen safety and compatibility are also helping accelerate adoption across consumer and commercial use cases.
| Market Scope | |
|---|---|
| Start Year | 2025 |
| Forecast Year | 2026-2035 |
| Start Value | $57.9 Billion |
| Forecast Value | $120.9 Billion |
| CAGR | 8.2% |
The two-wheeler segment held a 45% share in 2025 and is expected to grow at a CAGR of 8.5% from 2026 to 2035. This segment leads electrification because it requires relatively small battery systems, which helps sustain competitive pricing as industry-wide battery costs continue to decrease.
The short-range segment accounted for a 43% share in 2025 and is projected to grow at the highest rate of 8.6% through 2035. These vehicles are designed for daily urban trips under 100 km and make use of readily available charging infrastructure. Their lower cost, lightweight design, maneuverability, and ease of parking appeal to commuters and companies focused on micro-mobility and last-mile delivery.
Asia Pacific Electric Transporters Market captured 73% share in 2025 and is expected to grow at a CAGR of 7.8% throughout 2025-2034. Strong production activity in China and rising adoption in markets across India and Southeast Asia continue to influence regional dominance. China represents approximately 78% of global electric transporter sales volume, supported by widespread consumer acceptance, government-backed initiatives, and large-scale industry capacity.
Major companies in the Global Electric Transporters Market include Ather Energy, BMW Motorrad, Giant, Harley-Davidson, Hero MotoCorp, Niu Technologies, Segway Ninebot, Yadea Technology, Yamaha Motor, and Zero Motorcycles. Leading manufacturers are expanding their Electric Transporters Market presence by strengthening battery efficiency, improving motor performance, and prioritizing affordable product lines for urban users. Many companies are investing in modular platforms that allow them to scale models across multiple price tiers while optimizing production costs. Collaboration with charging infrastructure providers remains a core strategy as firms work to ensure convenient access to energy for users. Businesses are also forming alliances with fleet operators to increase adoption in commercial delivery applications. Continuous research in lightweight materials, safety systems, and digital connectivity helps brands differentiate their offerings. Manufacturers are further enhancing their reach by expanding global distribution networks and aligning with regional regulatory frameworks to accelerate certification and market entry.
Table of Contents
Chapter 1 Methodology
- 1.1 Market scope and definition
- 1.2 Research design
- 1.2.1 Research approach
- 1.2.2 Data collection methods
- 1.3 Data mining sources
- 1.3.1 Global
- 1.3.2 Regional/Country
- 1.4 Base estimates and calculations
- 1.4.1 Base year calculation
- 1.4.2 Key trends for market estimation
- 1.5 Primary research and validation
- 1.5.1 Primary sources
- 1.6 Forecast model
- 1.7 Research assumptions and limitations
Chapter 2 Executive Summary
- 2.1 Industry 3600 synopsis, 2022 - 2035
- 2.2 Key market trends
- 2.2.1 Regional
- 2.2.2 Electric Vehicle
- 2.2.3 Voltage
- 2.2.4 Battery
- 2.2.5 Range
- 2.2.6 Application
- 2.2.7 End Use
- 2.3 TAM Analysis, 2026-2035
- 2.4 CXO perspectives: Strategic imperatives
- 2.4.1 Executive decision points
- 2.4.2 Critical success factors
- 2.5 Future outlook and strategic recommendations
Chapter 3 Industry Insights
- 3.1 Industry ecosystem analysis
- 3.1.1 Supplier landscape
- 3.1.2 Profit margin analysis
- 3.1.3 Cost structure
- 3.1.4 Value addition at each stage
- 3.1.5 Factor affecting the value chain
- 3.1.6 Disruptions
- 3.2 Industry impact forces
- 3.2.1.1 Growth drivers
- 3.2.1.2 Urbanization and traffic congestion
- 3.2.1.3 Environmental concerns and regulatory support
- 3.2.1.4 Growth in e-commerce and logistics
- 3.2.1.5 Advances in battery technology and declining costs
- 3.2.1.6 Rising fuel prices and lower operating costs
- 3.2.2 Industry pitfalls and challenges
- 3.2.2.1 Limited charging infrastructure and range anxiety
- 3.2.2.2 High upfront costs and long payback period
- 3.2.3 Market opportunities
- 3.2.3.1 Expansion of last-mile delivery solutions
- 3.2.3.2 Development of battery-swapping and fast-charging infrastructure
- 3.2.3.3 Integration with smart city and urban mobility initiatives
- 3.2.3.4 Fleet electrification for logistics and public transport
- 3.2.3.5 Technological innovation and modular vehicle design
- 3.3 Growth potential analysis
- 3.4 Regulatory landscape
- 3.4.1 Global regulatory overview
- 3.4.1.1 North America regulatory framework
- 3.4.1.2 Europe regulatory framework
- 3.4.1.3 Asia Pacific regulatory framework
- 3.4.1.4 Latin America regulatory framework
- 3.4.1.5 Middle East & Africa regulatory framework
- 3.4.2 Safety standards & certifications
- 3.4.3 Cybersecurity & data privacy regulations
- 3.4.4 Environmental & emissions regulations
- 3.4.5 Regulatory compliance cost analysis
- 3.4.1 Global regulatory overview
- 3.5 Porter's analysis
- 3.6 PESTEL analysis
- 3.7 Technology and innovation landscape
- 3.7.1 Current technological trends
- 3.7.1.1 Battery technologies
- 3.7.1.2 Electric motor technologies
- 3.7.1.3 Power electronics & control systems
- 3.7.1.4 Connectivity & telematics
- 3.7.1.5 Charging infrastructure
- 3.7.2 Emerging technologies
- 3.7.2.1 Next-generation battery technologies
- 3.7.2.2 Advanced charging technologies
- 3.7.2.3 Autonomous & ADAS features
- 3.7.2.4 Advanced connectivity (emerging)
- 3.7.2.5 Vehicle-to-grid (V2G) technologies
- 3.7.1 Current technological trends
- 3.8 Price trends
- 3.8.1 By region
- 3.8.2 By product
- 3.9 Production statistics
- 3.9.1 Production hubs
- 3.9.2 Consumption hubs
- 3.9.3 Export and import
- 3.10 Pricing analysis & market economics
- 3.10.1 Pricing trends overview
- 3.10.2 Pricing by vehicle type
- 3.10.3 Regional pricing variations
- 3.10.4 Battery cost impact on vehicle pricing
- 3.10.5 Total cost of ownership (TCO) analysis
- 3.10.6 Government incentives & subsidies impact
- 3.10.7 Shared micromobility pricing models
- 3.10.8 Pricing elasticity analysis
- 3.10.9 Future pricing outlook
- 3.11 Cost breakdown analysis
- 3.11.1 Manufacturing cost structure
- 3.11.2 R&D cost analysis
- 3.11.3 Regulatory compliance costs
- 3.11.4 Distribution & logistics costs
- 3.11.5 Marketing & sales costs
- 3.11.6 Operational costs (shared mobility)
- 3.11.7 Charging infrastructure costs
- 3.11.8 Warranty & aftersales costs
- 3.11.9 Cost reduction roadmap
- 3.12 Patent analysis
- 3.13 Sustainability and environmental aspects
- 3.13.1 Sustainable practices
- 3.13.2 Waste reduction strategies
- 3.13.3 Energy efficiency in production
- 3.13.4 Eco-friendly Initiatives
- 3.13.5 Carbon footprint considerations
- 3.14 End use behavior analysis
- 3.14.1 Consumer adoption patterns
- 3.14.2 Usage patterns & trip characteristics
- 3.14.3 Mode choice & substitution analysis
- 3.14.4 Purchase decision factors
- 3.14.5 Shared mobility user behavior
- 3.14.6 Fleet operator decision-making
- 3.14.7 Transit agency procurement behavior
- 3.14.8 Safety perception & risk awareness
- 3.14.9 Brand loyalty & switching behavior
- 3.14.10 Future behavior trends
- 3.15 Risk assessment & mitigation framework
- 3.15.1 Technology risks
- 3.15.2 Regulatory & compliance risks
- 3.15.3 Supply chain risks
- 3.15.4 Market & competitive risks
- 3.15.5 Financial risks
- 3.15.6 Operational risks (shared mobility)
- 3.15.7 Reputational & brand risks
- 3.15.8 Environmental & climate risks
- 3.15.9 Insurance & liability risks
- 3.15.10 Risk prioritization matrix
- 3.16 Future outlook & opportunities
- 3.16.1 Emerging technology trends
- 3.16.2 Regulatory evolution & impact
- 3.16.3 Business model innovation
- 3.16.4 Investment opportunities
- 3.16.5 Strategic recommendations
- 3.16.6 Risk analysis & mitigation strategies
- 3.16.7 Scenario analysis
Chapter 4 Competitive Landscape, 2025
- 4.1 Introduction
- 4.2 Company market share analysis
- 4.2.1 North America
- 4.2.2 Europe
- 4.2.3 Asia Pacific
- 4.2.4 LATAM
- 4.2.5 MEA
- 4.3 Competitive analysis of major market players
- 4.4 Competitive positioning matrix
- 4.5 Strategic outlook matrix
- 4.6 Key developments
- 4.6.1 Mergers & acquisitions
- 4.6.2 Partnerships & collaborations
- 4.6.3 New Product Launches
- 4.6.4 Expansion Plans and funding
Chapter 5 Market Estimates & Forecast, By Electric Vehicle, 2022 - 2035 (USD Mn, Units)
- 5.1 Key trends
- 5.2 Two-wheelers
- 5.2.1 E-bikes
- 5.2.2 E-scooters
- 5.2.3 Electric motorcycles
- 5.3 Three-wheelers
- 5.4 Personal transporters
- 5.4.1 Skateboards
- 5.4.2 Hoverboards
Chapter 6 Market Estimates & Forecast, By Voltage, 2022 - 2035 (USD Mn, Units)
- 6.1 Key trends
- 6.2 24V
- 6.3 36V
- 6.4 48V
- 6.5 Above 48V
Chapter 7 Market Estimates & Forecast, By Battery, 2022 - 2035 (USD Mn, Units)
- 7.1 Key trends
- 7.2 Lithium-ion
- 7.3 Lead-acid
- 7.4 Nickel-metal hydride
- 7.5 Solid state
Chapter 8 Market Estimates & Forecast, By Range, 2022 - 2035 (USD Mn, Units)
- 8.1 Key trends
- 8.2 Short-range (urban, ≤100 km / day)
- 8.3 Mid-range (regional, 100-300 km / day)
- 8.4 Long-range (≥300 km / day)
Chapter 9 Market Estimates & Forecast, By Application, 2022 - 2035 (USD Mn, Units)
- 9.1 Key trends
- 9.2 Micro-mobility
- 9.3 Ridesharing
- 9.4 Freight & cargo transport
- 9.5 Public transport
- 9.6 Personal leisure
- 9.7 Others
Chapter 10 Market Estimates & Forecast, By End Use, 2022 - 2035 (USD Mn, Units)
- 10.1 Key trends
- 10.2 Personal purchase
- 10.3 Commercial enterprises
- 10.4 Government & Non-Profit Buyers
- 10.5 Industrial & Logistics
- 10.6 Others
Chapter 11 Market Estimates & Forecast, By Region, 2022 - 2035 (USD Mn, Units)
- 11.1 Key trends
- 11.2 North America
- 11.2.1 US
- 11.2.2 Canada
- 11.3 Europe
- 11.3.1 Germany
- 11.3.2 UK
- 11.3.3 France
- 11.3.4 Italy
- 11.3.5 Spain
- 11.3.6 Russia
- 11.3.7 Nordics
- 11.3.8 Portugal
- 11.3.9 Croatia
- 11.4 Asia Pacific
- 11.4.1 China
- 11.4.2 India
- 11.4.3 Japan
- 11.4.4 Australia
- 11.4.5 South Korea
- 11.4.6 Singapore
- 11.4.7 Thailand
- 11.4.8 Indonesia
- 11.4.9 Vietnam
- 11.5 Latin America
- 11.5.1 Brazil
- 11.5.2 Mexico
- 11.5.3 Argentina
- 11.6 MEA
- 11.6.1 South Africa
- 11.6.2 Saudi Arabia
- 11.6.3 UAE
- 11.6.4 Turkey
Chapter 12 Company Profiles
- 12.1 Global Players
- 12.1.1 Accell
- 12.1.2 Bosch eBike Systems
- 12.1.3 BYD Company
- 12.1.4 CATL (Contemporary Amperex Technology)
- 12.1.5 Energica Motor Company
- 12.1.6 NIU Technologies
- 12.1.7 Proterra
- 12.1.8 Segway Ninebot
- 12.1.9 Yadea
- 12.1.10 Zero Motorcycles
- 12.2 Regional Players
- 12.2.1 Giant Manufacturing
- 12.2.2 Harley-Davidson
- 12.2.3 Nova Bus
- 12.2.4 Stromer
- 12.2.5 Gazelle
- 12.2.6 Tern Bicycles
- 12.2.7 Gogoro
- 12.2.8 Ather Energy
- 12.2.9 Hero Motorcorp
- 12.2.10 Piaggio
- 12.3 Emerging Technology Innovators
- 12.3.1 Lime
- 12.3.2 Aventon Bikes
- 12.3.3 Tier Mobility
- 12.3.4 BMW Motorrad
- 12.3.5 Yamaha Motor
 全球电动交通设备市场规模、份额、趋势和成长分析报告(2026-2034年)
 2026年全球智慧电动自行车电池租赁市场报告
 电动车市场-全球产业规模、份额、趋势、机会、预测:按产品类型、电压类型、电池类型、地区和竞争格局划分,2021-2031年
 厢型车和运输车市场:2026-2032年全球预测(按车辆类型、负载容量、乘客容量、动力传动系统、轴距、应用和销售管道)
 全球电动交通可靠性工程市场:未来预测(至2032年)-依可靠性功能、运输模式、系统层、应用、最终用户和地区进行分析城市交通和低碳交通市场预测至2032年:按模式、基础设施、技术、应用、最终用户和区域分類的全球分析
 电动交通市场规模、份额和成长分析(按车辆类型、电压、电池、最终用途和地区划分)-2026-2033年产业预测
 电动计程车和垂直起降场市场规模、份额和成长分析(按车辆类型、飞机类型和地区划分)-2026-2033年产业预测
 电动车网路市场规模、份额和成长分析(按充电基础设施、软体和服务、最终用户和地区划分)—2026-2033年产业预测全球电动车市场机会与策略(至2034年)