


 |
市场调查报告书
商品编码
1892902
码头调度软体市场机会、成长驱动因素、产业趋势分析及预测(2026-2035年)Dock Scheduling Software Market Opportunity, Growth Drivers, Industry Trend Analysis, and Forecast 2026 - 2035 |
||||||
2025 年全球码头调度软体市场价值为 58 亿美元,预计到 2035 年将以 12.2% 的复合年增长率增长至 181 亿美元。
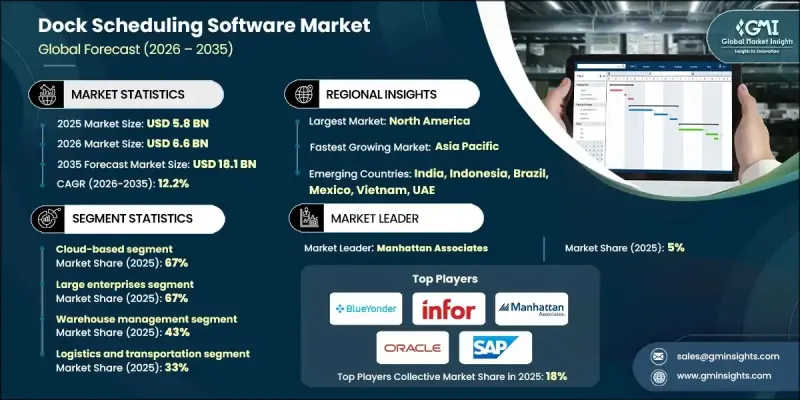
对营运效率日益增长的需求正在推动相关软体的普及,因为最大限度地减少卡车在码头停留的时间对于降低成本和缩短週转时间至关重要。码头调度软体能够帮助企业优化装卸货门的使用,并安排预约,从而减少车辆閒置时间,并提升为零售、食品杂货和电子商务等行业的大批量货运承运商提供的服务水平。劳动力短缺和不断上涨的招募成本迫使仓库更加重视人员配置。调度软体能够根据预期的货运量预测人员需求,并将员工分配到最繁忙的码头。此外,该软体还支援合规性和行业安全标准,能够追踪驾驶员的工作时间,报告违规行为,并确保遵守服务时间规定,同时保障驾驶员安全和营运效率。
| 市场范围 | |
|---|---|
| 起始年份 | 2025 |
| 预测年份 | 2026-2035 |
| 起始值 | 58亿美元 |
| 预测值 | 181亿美元 |
| 复合年增长率 | 12.2% |
到 2025 年,基于云端的细分市场将占据 67% 的市场份额,预计到 2035 年将以 12.5% 的复合年增长率成长。云端部署透过 SaaS 订阅模式实现了即时营运商整合、行动存取和更低的预付成本,同时减轻了 IT 管理负担。
大型企业在2025年占据了67%的市场份额,这主要得益于其庞大的仓储网路、多个装卸货平台以及复杂的多承运商营运模式。这些企业利用人工智慧支援的最佳化、多站点可视性以及与WMS和TMS系统的深度集成,以确保区域和全国配送中心流程的一致性。
预计2025年,美国码头调度软体市场规模将达47.6亿美元。卡车运力紧张、货运速度加快以及对滞留时间的监管日益严格,是推动市场成长的主要因素。自动化、物联网设备和自助服务入口网站提高了营运效率,并提升了配送中心产品收货的及时性。
目录
第一章:方法论
第二章:执行概要
第三章:行业洞察
- 产业生态系分析
- 供应商格局
- 利润率
- 成本结构
- 每个阶段的价值增加
- 影响价值链的因素
- 中断
- 产业影响因素
- 成长驱动因素
- 需要减少停留时间
- 劳动力优化
- 监理与合规压力
- 现代供应链的复杂性
- 产业陷阱与挑战
- 整合复杂度
- 营运商和员工对采用的抵触情绪
- 市场机会
- 拓展中小企业市场
- 电子商务与全通路物流
- 新兴市场(亚太地区、拉丁美洲、中东和非洲)
- 自动化与机器人集成
- 成长驱动因素
- 成长潜力分析
- 监管环境
- 全球的
- 安全与性能标准
- 环境与永续发展法规
- 资料隐私和跨境资料传输
- 运输和货运法规
- 产业特定合规性
- 北美洲
- 欧洲
- 亚太地区
- 拉丁美洲
- 中东和非洲
- 全球的
- 波特的分析
- PESTEL 分析
- 技术与创新格局
- 当前技术趋势
- 调度引擎和最佳化演算法
- 车载资讯和预计到达时间数据
- 即时场地/拖车位置
- 行动司机应用程式和营运商入口网站
- 新兴技术
- 人工智慧驱动的预测性调度和异常检测
- 用于堆场/码头流程规划的数位孪生和仿真
- 用于预约溯源和审计追踪的区块链
- 自主式堆场车辆与机器人装卸
- 当前技术趋势
- 定价分析
- 按部署模式定价
- 按单位指标定价
- 按功能等级定价
- 专业服务及整合费用
- 成本細項分析
- 供应商成本结构
- 成本构成要素的实施
- 持续营运成本
- 间接客户成本
- 专利分析
- 主要供应商的专利所有权
- 自由实施权和智慧财产权诉讼趋势
- 永续性和环境方面
- 永续实践
- 减少废弃物策略
- 生产中的能源效率
- 环保倡议
- 碳足迹考量
- 风险评估与缓解框架
- 供应链风险
- 金融和经济风险
- 监理与合规风险
- 营运风险
- 技术与创新风险
- 最终使用者行为与消费分析
- 最终用户细分框架
- 第三方物流及物流供应商的行为及多租户需求
- 零售与电子商务采用模式
- 製造与准时制用户行为
第四章:竞争格局
- 介绍
- 公司市占率分析
- 北美洲
- 欧洲
- 亚太地区
- 拉丁美洲
- MEA
- 主要市场参与者的竞争分析
- 竞争定位矩阵
- 战略展望矩阵
- 关键进展
- 併购
- 合作伙伴关係与合作
- 新产品发布
- 扩张计划和资金
第五章:市场估算与预测:依部署模式划分,2022-2035年
- 基于云端的
- 现场
- 杂交种
第六章:市场估算与预测:依企业规模划分,2022-2035年
- 大型企业
- 中小企业
第七章:市场估算与预测:依应用领域划分,2022-2035年
- 仓库管理
- 交通运输管理
- 场地管理
- 交叉转运作业
- 其他的
第八章:市场估算与预测:依解法划分,2022-2035年
- 独立式码头调度软体
- 整合供应链管理解决方案
- 码头调度堆场管理系统
第九章:市场估算与预测:依组件划分,2022-2035年
- 软体
- 服务
第十章:市场估计与预测:依最终用途划分,2022-2035年
- 物流和运输
- 零售与电子商务
- 製造业
- 餐饮
- 医疗保健和製药
- 批发和分销
- 其他的
第十一章:市场估计与预测:按地区划分,2022-2035年
- 北美洲
- 我们
- 加拿大
- 欧洲
- 德国
- 英国
- 法国
- 义大利
- 西班牙
- 北欧
- 俄罗斯
- 波兰
- 罗马尼亚
- 亚太地区
- 中国
- 印度
- 日本
- 韩国
- 澳新银行
- 越南
- 印尼
- 拉丁美洲
- 巴西
- 墨西哥
- 阿根廷
- MEA
- 南非
- 沙乌地阿拉伯
- 阿联酋
第十二章:公司简介
- 全球公司
- Blue Yonder
- C3 Solutions
- Descartes Systems
- FourKites
- Infor
- Korber Supply Chain
- Manhattan Associates
- Oracle
- project44
- SAP
- Zebra Technologies
- 区域玩家
- SIGHT Connect
- Alpega
- Dock411
- E2 open
- GoRamp
- Kale Logistics Solutions
- Opendock
- Softeon
- Transporeon
- Trimble Transportation
- Velostics
- YardView
- 新兴玩家
- Arrivy
- Conduit
- DataDocks
- Epicor Software
- Extensiv (formerly 3 PL Central)
- LoadingCalendar
The Global Dock Scheduling Software Market was valued at USD 5.8 billion in 2025 and is estimated to grow at a CAGR of 12.2% to reach USD 18.1 billion by 2035.
The rising demand for operational efficiency is driving adoption, as minimizing the time trucks spend at docks is essential for reducing costs and turnaround times. Dock scheduling software enables companies to optimize door usage and arrange appointments, decreasing idle time and improving service levels for carriers handling high-volume shipments across retail, grocery, and e-commerce sectors. Labor shortages and rising hiring costs are compelling warehouses to allocate personnel more strategically. Scheduling software predicts staffing requirements based on expected shipment volumes and assigns employees to the busiest docks. Additionally, regulatory compliance and industry safety standards are supported, with the software tracking driver hours, reporting violations, and ensuring adherence to hours-of-service regulations while maintaining driver safety and operational efficiency.
| Market Scope | |
|---|---|
| Start Year | 2025 |
| Forecast Year | 2026-2035 |
| Start Value | $5.8 Billion |
| Forecast Value | $18.1 Billion |
| CAGR | 12.2% |
The cloud-based segment held a 67% share in 2025 and is expected to grow at a CAGR of 12.5% through 2035. Cloud deployment allows real-time carrier integration, mobile access, and lower upfront costs via the SaaS subscription model, while reducing IT management burdens.
The large enterprises segment held a 67% market share in 2025, driven by extensive warehouse networks, multiple dock doors, and complex multi-carrier operations. These enterprises leverage AI-supported optimization, multi-site visibility, and deep integration with WMS and TMS systems to maintain consistent processes across regional and national distribution centers.
U.S. Dock Scheduling Software Market generated USD 4.76 billion in 2025. Growth is fueled by tight trucking capacity, faster freight movement, and stricter regulatory scrutiny on detention times. Automation, IoT devices, and self-service portals enhance operational accuracy and improve the timeliness of product reception at distribution centers.
Key players in the Global Dock Scheduling Software Market include Descartes Systems, Manhattan Associates, Oracle, SAP, Epicor Software, Infor, Blue Yonder, Zebra Technologies, 4SIGHT Connect, and C3 Solutions. Companies in the dock scheduling software market are focusing on several strategies to strengthen their market presence. Providers are investing in AI and machine learning capabilities to enhance predictive scheduling and real-time dock optimization. Cloud deployment is being expanded to offer scalable, mobile-accessible solutions that reduce IT complexity for clients. Strategic partnerships with WMS, TMS, and ERP providers enhance platform integration, providing seamless operational workflows. Companies are also targeting large enterprises and multi-site distribution networks, offering advanced analytics, multi-carrier management, and AI-powered insights.
Table of Contents
Chapter 1 Methodology
- 1.1 Market scope and definition
- 1.2 Research design
- 1.2.1 Research approach
- 1.2.2 Data collection methods
- 1.3 Data mining sources
- 1.3.1 Global
- 1.3.2 Regional/Country
- 1.4 Base estimates and calculations
- 1.4.1 Base year calculation
- 1.4.2 Key trends for market estimation
- 1.5 Primary research and validation
- 1.5.1 Primary sources
- 1.6 Forecast model
- 1.7 Research assumptions and limitations
Chapter 2 Executive Summary
- 2.1 Industry 360° synopsis
- 2.2 Key market trends
- 2.2.1 Regional
- 2.2.2 Deployment mode
- 2.2.3 Enterprise size
- 2.2.4 Solution
- 2.2.5 Application
- 2.2.6 Component
- 2.2.7 End Use
- 2.3 TAM analysis, 2026-2035
- 2.4 CXO perspectives: Strategic imperatives
- 2.4.1 Executive decision points
- 2.4.2 Critical success factors
- 2.5 Future outlook
- 2.6 Strategic recommendations
Chapter 3 Industry Insights
- 3.1 Industry ecosystem analysis
- 3.1.1 Supplier landscape
- 3.1.2 Profit margin
- 3.1.3 Cost structure
- 3.1.4 Value addition at each stage
- 3.1.5 Factor affecting the value chain
- 3.1.6 Disruptions
- 3.2 Industry impact forces
- 3.2.1 Growth drivers
- 3.2.1.1 Need to reduce dwell time
- 3.2.1.2 Labor optimization
- 3.2.1.3 Regulatory & compliance pressures
- 3.2.1.4 Complexity of modern supply chains
- 3.2.2 Industry pitfalls and challenges
- 3.2.2.1 Integration complexity
- 3.2.2.2 Carrier & staff adoption resistance
- 3.2.3 Market opportunities
- 3.2.3.1 Expansion into SMB segment
- 3.2.3.2 E-commerce & omnichannel logistics
- 3.2.3.3 Emerging markets (APAC, LATAM, MEA)
- 3.2.3.4 Automation & robotics integration
- 3.2.1 Growth drivers
- 3.3 Growth potential analysis
- 3.4 Regulatory landscape
- 3.4.1 Global
- 3.4.1.1 Safety & performance standards
- 3.4.1.2 Environmental & sustainability regulations
- 3.4.1.3 Data privacy & cross-border data transfer
- 3.4.1.4 Transport & freight regulations
- 3.4.1.5 Industry-specific compliance
- 3.4.2 North America
- 3.4.3 Europe
- 3.4.4 Asia Pacific
- 3.4.5 Latin America
- 3.4.6 Middle East & Africa
- 3.4.1 Global
- 3.5 Porter's analysis
- 3.6 PESTEL analysis
- 3.7 Technology and innovation landscape
- 3.7.1 Current technological trends
- 3.7.1.1 Scheduling engines & optimization algorithms
- 3.7.1.2 Telematics & ETA feeds
- 3.7.1.3 Real-time yard/trailer location
- 3.7.1.4 Mobile driver apps & carrier portals
- 3.7.2 Emerging technologies
- 3.7.2.1 AI-driven predictive scheduling and anomaly detection
- 3.7.2.2 Digital twins and simulation for yard/dock flow planning
- 3.7.2.3 Blockchain for appointment provenance and audit trails
- 3.7.2.4 Autonomous yard vehicles and robotic dock handling
- 3.7.1 Current technological trends
- 3.8 Pricing analysis
- 3.8.1.1 Pricing by deployment mode
- 3.8.1.2 Pricing by unit metrics
- 3.8.1.3 Pricing by functionality tier
- 3.8.1.4 Professional services & integration costs
- 3.9 Cost breakdown analysis
- 3.9.1 Vendor cost structure
- 3.9.2 Implementation of cost components
- 3.9.3 Ongoing operational costs
- 3.9.4 Indirect customer costs
- 3.10 Patent analysis
- 3.10.1 Patent ownership by major vendors
- 3.10.2 Freedom-to-operate and IP litigation trends
- 3.11 Sustainability and environmental aspects
- 3.11.1 Sustainable practices
- 3.11.2 Waste reduction strategies
- 3.11.3 Energy efficiency in production
- 3.11.4 Eco-friendly initiatives
- 3.11.5 Carbon footprint considerations
- 3.12 Risk assessment & mitigation framework
- 3.12.1 Supply chain risks
- 3.12.2 Financial & economic risks
- 3.12.3 Regulatory & compliance risks
- 3.12.4 Operational risks
- 3.12.5 Technology & innovation risks
- 3.13 End use behavior & consumption analysis
- 3.13.1 End use segmentation framework
- 3.13.2. 3 PL & logistics provider behavior and multi-tenant needs
- 3.13.3 Retail & e-commerce adoption patterns
- 3.13.4 Manufacturing & JIT user behavior
Chapter 4 Competitive Landscape, 2025
- 4.1 Introduction
- 4.2 Company market share analysis
- 4.2.1 North America
- 4.2.2 Europe
- 4.2.3 Asia Pacific
- 4.2.4 LATAM
- 4.2.5 MEA
- 4.3 Competitive analysis of major market players
- 4.4 Competitive positioning matrix
- 4.5 Strategic outlook matrix
- 4.6 Key developments
- 4.6.1 Mergers & acquisitions
- 4.6.2 Partnerships & collaborations
- 4.6.3 New product launches
- 4.6.4 Expansion plans and funding
Chapter 5 Market Estimates & Forecast, By Deployment mode, 2022 - 2035 ($Mn)
- 5.1 Key trends
- 5.2 Cloud-based
- 5.3 On-premises
- 5.4 Hybrid
Chapter 6 Market Estimates & Forecast, By Enterprise Size, 2022 - 2035 ($Mn)
- 6.1 Key trends
- 6.2 Large enterprises
- 6.3 SMEs
Chapter 7 Market Estimates & Forecast, By Application, 2022 - 2035 ($Mn)
- 7.1 Key trends
- 7.2 Warehouse management
- 7.3 Transportation management
- 7.4 Yard management
- 7.5 Cross-docking operations
- 7.6 Others
Chapter 8 Market Estimates & Forecast, By Solution, 2022 - 2035 ($Mn)
- 8.1 Key trends
- 8.2 Standalone dock scheduling software
- 8.3 Integrated supply chain management solution
- 8.4 Yard management system with dock scheduling
Chapter 9 Market Estimates & Forecast, By Component, 2022 - 2035 ($Mn)
- 9.1 Key trends
- 9.2 Software
- 9.3 Services
Chapter 10 Market Estimates & Forecast, By End Use, 2022 - 2035 ($Mn)
- 10.1 Key trends
- 10.2 Logistics and transportation
- 10.3 Retail and e-commerce
- 10.4 Manufacturing
- 10.5 Food and beverage
- 10.6 Healthcare and pharmaceuticals
- 10.7 Wholesale and distribution
- 10.8 Others
Chapter 11 Market Estimates & Forecast, By Region, 2022 - 2035 ($Mn)
- 11.1 Key trends
- 11.2 North America
- 11.2.1 US
- 11.2.2 Canada
- 11.3 Europe
- 11.3.1 Germany
- 11.3.2 UK
- 11.3.3 France
- 11.3.4 Italy
- 11.3.5 Spain
- 11.3.6 Nordics
- 11.3.7 Russia
- 11.3.8 Poland
- 11.3.9 Romania
- 11.4 Asia Pacific
- 11.4.1 China
- 11.4.2 India
- 11.4.3 Japan
- 11.4.4 South Korea
- 11.4.5 ANZ
- 11.4.6 Vietnam
- 11.4.7 Indonesia
- 11.5 Latin America
- 11.5.1 Brazil
- 11.5.2 Mexico
- 11.5.3 Argentina
- 11.6 MEA
- 11.6.1 South Africa
- 11.6.2 Saudi Arabia
- 11.6.3 UAE
Chapter 12 Company Profiles
- 12.1 Global companies
- 12.1.1 Blue Yonder
- 12.1.2 C3 Solutions
- 12.1.3 Descartes Systems
- 12.1.4 FourKites
- 12.1.5 Infor
- 12.1.6 Korber Supply Chain
- 12.1.7 Manhattan Associates
- 12.1.8 Oracle
- 12.1.9 project44
- 12.1.10 SAP
- 12.1.11 Zebra Technologies
- 12.2 Regional players
- 12.2.1. SIGHT Connect
- 12.2.2 Alpega
- 12.2.3 Dock411
- 12.2.4. E2 open
- 12.2.5 GoRamp
- 12.2.6 Kale Logistics Solutions
- 12.2.7 Opendock
- 12.2.8 Softeon
- 12.2.9 Transporeon
- 12.2.10 Trimble Transportation
- 12.2.11 Velostics
- 12.2.12 YardView
- 12.3 Emerging players
- 12.3.1 Arrivy
- 12.3.2 Conduit
- 12.3.3 DataDocks
- 12.3.4 Epicor Software
- 12.3.5. Extensiv (formerly 3 PL Central)
- 12.3.6 LoadingCalendar
 2026年全球广播自动化软体市场报告
 AI办公室软体市场按类型、部署模式、组织规模和最终用户划分-全球预测(2026-2032年)调度自动化软体市场:按元件、部署模式、组织规模、业务功能、垂直产业和全球预测(2026-2032 年)
 向软体定义自动化转型:推动因素与挑战
 人工智慧驱动的自动化市场预测至2032年:按自动化类型、技术、应用、最终用户和地区分類的全球分析
 广播自动化软体市场-全球产业规模、份额、趋势、机会和预测,依产品、应用、地区和竞争格局划分,2020-2030年预测低程式码自动化平台市场预测至 2032 年:按组件、部署类型、组织规模、应用程式、最终用户和地区进行的全球分析
 全球码头调度软体市场自动细胞摇床市场报告:2031 年趋势、预测与竞争分析
 码头调度软体市场按部署模式(基于云端、本地)、组织规模(中小型企业、大型企业)和地区划分,2025 年至 2033 年