


 |
市场调查报告书
商品编码
1892909
石油及天然气电动潜水帮浦市场机会、成长驱动因素、产业趋势分析及预测(2026-2035年)Oil and Gas Electric Submersible Pump Market Opportunity, Growth Drivers, Industry Trend Analysis, and Forecast 2026 - 2035 |
||||||
2025年全球油气用电动潜水帮浦市场价值为64亿美元,预计2035年将以7.6%的复合年增长率成长至130亿美元。
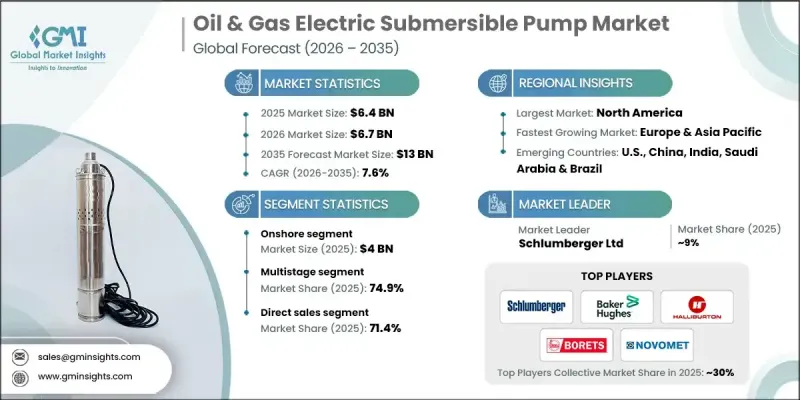
新兴经济体人口成长和快速工业化正推动前所未有的能源需求,尤其是在成熟市场。能源需求的激增促使油气产业采用更先进、更有效率的开采技术,其中电潜泵(ESP)发挥关键作用。电潜泵被广泛用于提高老油田的产量,并优化大规模作业的开采效率。儘管电潜泵优势显着,但高昂的前期成本等挑战使得小型业者难以采用,尤其是在油价低迷时期。然而,泵浦设计的创新、更耐用材料的运用以及即时监控系统的集成,正使电潜泵的效率、可靠性和成本效益不断提高,从而在能源需求持续增长的情况下,为全球产量增长提供支持。
| 市场范围 | |
|---|---|
| 起始年份 | 2025 |
| 预测年份 | 2026-2035 |
| 起始值 | 64亿美元 |
| 预测值 | 130亿美元 |
| 复合年增长率 | 7.6% |
2025年陆上油气市场规模达40亿美元,预计2026年至2035年将以7.7%的复合年增长率成长。成长的主要驱动力是维持成熟陆上油田产量的需求,而人工举升解决方案对于维持这些油田的生产至关重要。陆上作业通常比海上专案更具成本效益,因此对那些希望在控制营运成本的同时优化生产效率的营运商来说更具吸引力。不断增长的油气需求以及针对老旧油藏的强化采收技术,进一步推动了电潜泵(ESP)在高效流体处理和提高产量方面的应用。
2025年,多级电潜泵市占率达到74.9%,预计2026年至2035年将以7.3%的复合年增长率成长。多层电潜泵配备多个叶轮,能够提供必要的提升力,将大量石油、水和天然气从深层油藏输送到地面。这些泵浦非常适合高产能、复杂的油井,包括非常规油气田和海上油气田。随着勘探活动向更深、更具挑战性的油藏推进,多级系统的需求将持续稳定成长。
美国油气产业电动潜水帮浦市场预计在2025年达到14.1亿美元,并有望在2035年之前以8.1%的复合年增长率成长。电动潜水泵技术的进步,例如可靠性的提升、效率的提高以及与数位监控系统的集成,是推动市场成长的主要因素。这些进步使营运商能够优化效能并最大限度地减少停机时间。此外,海上专案的投资以及对提高油井产量成本效益的需求,也是重要的成长动力。
目录
第一章:方法论与范围
第二章:执行概要
第三章:行业洞察
- 产业生态系分析
- 供应商格局
- 利润率
- 每个阶段的价值增加
- 影响价值链的因素
- 产业影响因素
- 成长驱动因素
- 全球能源需求不断成长
- ESP技术的进步
- 深水和超深水勘探
- 日益关注减少碳排放
- 产业陷阱与挑战
- 前期成本高
- 复杂的安装和维护
- 成长驱动因素
- 成长潜力分析
- 未来市场趋势
- 技术与创新格局
- 当前技术趋势
- 新兴技术
- 价格趋势
- 按地区
- 按泵类型
- 监管环境
- 标准和合规要求
- 区域监理框架
- 认证标准
- 贸易统计
- 主要进口国
- 主要出口国
- 波特的分析
- PESTEL 分析
第四章:竞争格局
- 介绍
- 公司市占率分析
- 按地区
- 北美洲
- 欧洲
- 亚太地区
- 拉丁美洲
- 中东和非洲
- 按地区
- 公司矩阵分析
- 主要市场参与者的竞争分析
- 竞争定位矩阵
- 关键进展
- 併购
- 合作伙伴关係与合作
- 新产品发布
- 扩张计划
第五章:市场估算与预测:依泵浦类型划分,2022-2035年
- 离心式
- 轴流
- 正位移
- 渐进性龋齿
第六章:市场估算与预测:依马达类型划分,2022-2035年
- 感应电机
- 永磁电机(PMM)
- 高温电机
第七章:市场估算与预测:依功率等级划分,2022-2035年
- 最高可达 500 匹马力
- 500-1000马力
- 1000-2000马力
- 超过2000马力
第八章:市场估算与预测:依部署方式划分,2022-2035年
- 传统钻井平台部署
- 替代性无钻井部署
第九章:市场估算与预测:依井深划分,2022-2035年
- 浅井(≤ 1,000 公尺)
- 中级(1,000-2,500公尺)
- 深海(2500-4000公尺)
- 超深(> 4,000 公尺)
第十章:市场估计与预测:依控制系统划分,2022-2035年
- 固定频率
- 变速
- 数位化优化(智慧/物联网系统)
第十一章:市场估价与预测:依部署类型划分,2022-2035年
- 陆上
- 离岸
第十二章:市场估算与预测:依营运模式划分,2022-2035年
- 单级
- 多级
第十三章:市场估算与预测:依应用领域划分,2022-2035年
- 石油生产
- 天然气生产
- 水注入
- 人工举升(EOR)
- 热恢復
第十四章:市场估算与预测:依配销通路划分,2022-2035年
- 直销
- 间接销售
第十五章:市场估计与预测:依地区划分,2022-2035年
- 北美洲
- 我们
- 加拿大
- 欧洲
- 德国
- 英国
- 法国
- 义大利
- 西班牙
- 亚太地区
- 中国
- 印度
- 日本
- 韩国
- 澳洲
- 印尼
- 马来西亚
- 拉丁美洲
- 巴西
- 墨西哥
- 阿根廷
- MEA
- 沙乌地阿拉伯
- 阿联酋
- 南非
第十六章:公司简介
- Atlas Copco AB
- Baker Hughes
- Borets International Ltd
- Crompton Greaves Consumer Electricals Limited
- EBARA CORPORATION
- Flowserve Corporation
- Gorman-Rupp Pumps
- Grundfos Holding A/S
- Halliburton
- Novomet
- Schlumberger Ltd
- Sulzer Ltd
- Tsurumi Manufacturing Co. Ltd.
- Weatherford
- WILO SE
The Global Oil & Gas Electric Submersible Pump Market was valued at USD 6.4 billion in 2025 and is estimated to grow at a CAGR of 7.6% to reach USD 13 billion by 2035.
The rising population and rapid industrialization in emerging economies are driving an unprecedented demand for energy, especially in well-established markets. This surge in energy requirements is pushing the oil and gas sector to adopt more advanced and efficient extraction technologies, with electric submersible pumps playing a key role. ESPs are widely deployed to enhance production in aging fields and optimize extraction efficiency for large-scale operations. Despite the benefits, challenges such as high upfront costs make ESP adoption difficult for smaller operators, particularly during periods of low oil prices. However, innovations in pump design, more durable materials, and the integration of real-time monitoring systems are making ESPs increasingly efficient, reliable, and cost-effective, supporting global production growth as energy demand continues to rise.
| Market Scope | |
|---|---|
| Start Year | 2025 |
| Forecast Year | 2026-2035 |
| Start Value | $6.4 Billion |
| Forecast Value | $13 Billion |
| CAGR | 7.6% |
The onshore segment accounted for USD 4 billion in 2025 and is expected to grow at a CAGR of 7.7% from 2026 to 2035. Growth is driven by the need to maintain output from mature onshore oilfields, where artificial lift solutions are critical for sustaining production. Onshore operations also tend to be more cost-effective than offshore projects, making them attractive to operators seeking to optimize productivity while controlling operational expenses. Rising hydrocarbon demand and enhanced recovery techniques for aging reservoirs are further boosting ESP adoption for efficient fluid handling and higher production rates.
The multistage segment held a 74.9% share in 2025 and is anticipated to grow at a CAGR of 7.3% from 2026 to 2035. Multistage ESPs, with multiple impellers, provide the necessary lift to transfer significant volumes of oil, water, and gas from deep reservoirs to the surface. These pumps are ideal for high-capacity, complex wells, including unconventional and offshore fields. As exploration moves toward deeper and more challenging reservoirs, the demand for multistage systems continues to rise steadily.
US Oil & Gas Electric Submersible Pump Market is generating USD 1.41 billion in 2025 and is expected to grow at a CAGR of 8.1% through 2035. Adoption is being driven by technological improvements in ESPs, such as enhanced reliability, greater efficiency, and integration with digital monitoring systems, which allow operators to optimize performance and minimize downtime. Investments in offshore projects, coupled with the need for cost-effective methods to maximize output from declining wells, are also significant growth factors.
Key players operating in the Global Oil & Gas Electric Submersible Pump Market include Schlumberger Ltd, Halliburton, Baker Hughes, Atlas Copco AB, Flowserve Corporation, Grundfos Holding A/S, Crompton Greaves Consumer Electricals Limited, EBARA CORPORATION, Gorman-Rupp Pumps, Novomet, Sulzer Ltd, Weatherford, WILO SE, Tsurumi Manufacturing Co. Ltd., and Borets International Ltd. Companies in the Oil & Gas Electric Submersible Pump Market are focusing on innovation, R&D, and digital integration to strengthen their market position. They are developing advanced pump designs with enhanced durability, energy efficiency, and real-time monitoring capabilities to optimize production and minimize downtime. Strategic partnerships with technology providers and digital solution companies allow operators to implement predictive maintenance and automation solutions. Firms are also expanding their geographic presence in emerging oil-producing regions and providing tailored services for onshore and offshore applications.
Table of Contents
Chapter 1 Methodology & Scope
- 1.1 Market scope and definition
- 1.2 Research design
- 1.2.1 Research approach
- 1.2.2 Data collection methods
- 1.3 Data mining sources
- 1.3.1 Global
- 1.3.2 Regional/Country
- 1.4 Base estimates and calculations
- 1.4.1 Base year calculation
- 1.4.2 Key trends for market estimation
- 1.5 Primary research and validation
- 1.5.1 Primary sources
- 1.6 Forecast model
- 1.7 Research assumptions and limitations
Chapter 2 Executive Summary
- 2.1 Industry 360° synopsis
- 2.2 Key market trends
- 2.2.1 Regional
- 2.2.2 Pump type
- 2.2.3 Motor types
- 2.2.4 Power rating
- 2.2.5 Deployment method
- 2.2.6 Well depth
- 2.2.7 Control system
- 2.2.8 Deployment type
- 2.2.9 Operation
- 2.2.10 Application
- 2.3 CXO perspectives: Strategic imperatives
- 2.3.1 Key decision points for industry executives
- 2.3.2 Critical success factors for market players
- 2.4 Future outlook and strategic recommendations
Chapter 3 Industry Insights
- 3.1 Industry ecosystem analysis
- 3.1.1 Supplier landscape
- 3.1.2 Profit margin
- 3.1.3 Value addition at each stage
- 3.1.4 Factor affecting the value chain
- 3.2 Industry impact forces
- 3.2.1 Growth drivers
- 3.2.1.1 Increasing global energy demand
- 3.2.1.2 Advancements in ESP technology
- 3.2.1.3 Deepwater and ultra-deepwater exploration
- 3.2.1.4 Rising focus on carbon emission reduction
- 3.2.2 Industry pitfalls & challenges
- 3.2.2.1 High initial costs
- 3.2.2.2 Complex installation and maintenance
- 3.2.1 Growth drivers
- 3.3 Growth potential analysis
- 3.4 Future market trends
- 3.5 Technology and innovation landscape
- 3.5.1 Current technological trends
- 3.5.2 Emerging technologies
- 3.6 Price trends
- 3.6.1 By region
- 3.6.2 By pump type
- 3.7 Regulatory landscape
- 3.7.1 Standards and compliance requirements
- 3.7.2 Regional regulatory frameworks
- 3.7.3 Certification standards
- 3.8 Trade statistics
- 3.8.1 Major importing countries
- 3.8.2 Major exporting countries
- 3.9 Porter's analysis
- 3.10 PESTEL analysis
Chapter 4 Competitive Landscape, 2025
- 4.1 Introduction
- 4.2 Company market share analysis
- 4.2.1 By Region
- 4.2.1.1 North America
- 4.2.1.2 Europe
- 4.2.1.3 Asia Pacific
- 4.2.1.4 Latin America
- 4.2.1.5 Middle East & Africa
- 4.2.1 By Region
- 4.3 Company matrix analysis
- 4.4 Competitive analysis of major market players
- 4.5 Competitive positioning matrix
- 4.6 Key developments
- 4.6.1 Mergers & acquisitions
- 4.6.2 Partnerships & collaborations
- 4.6.3 New product launches
- 4.6.4 Expansion plans
Chapter 5 Market Estimates & Forecast, By Pump Type, 2022 - 2035, (USD Billion) (Thousand Units)
- 5.1 Key trends
- 5.2 Centrifugal
- 5.3 Axial flow
- 5.4 Positive displacement
- 5.5 Progressive cavity
Chapter 6 Market Estimates & Forecast, By Motor Types, 2022 - 2035, (USD Billion) (Thousand Units)
- 6.1 Key trends
- 6.2 Induction motors
- 6.3 Permanent magnet motors (PMMs)
- 6.4 High-temperature motors
Chapter 7 Market Estimates & Forecast, By Power Rating, 2022 - 2035, (USD Billion) (Thousand Units)
- 7.1 Key trends
- 7.2 Up to 500 HP
- 7.3 500-1000 HP
- 7.4 1000-2000 HP
- 7.5 Above 2000 HP
Chapter 8 Market Estimates & Forecast, By Deployment Method, 2022 - 2035, (USD Billion) (Thousand Units)
- 8.1 Key trends
- 8.2 Conventional rig-based deployment
- 8.3 Alternative & rigless deployment
Chapter 9 Market Estimates & Forecast, By Well Depth, 2022 - 2035, (USD Billion) (Thousand Units)
- 9.1 Key trends
- 9.2 Shallow wells (≤ 1,000 m)
- 9.3 Intermediate (1,000-2,500 m)
- 9.4 Deep (2,500-4,000 m)
- 9.5 Ultra-deep (> 4,000 m)
Chapter 10 Market Estimates & Forecast, By Control system, 2022 - 2035, (USD Billion) (Thousand Units)
- 10.1 Key trends
- 10.2 Fixed frequency
- 10.3 Variable speed
- 10.4 Digital optimization (Intelligent/IoT-enabled systems)
Chapter 11 Market Estimates & Forecast, By Deployment Type, 2022 - 2035, (USD Billion) (Thousand Units)
- 11.1 Key trends
- 11.2 Onshore
- 11.3 Offshore
Chapter 12 Market Estimates & Forecast, By Operation, 2022 - 2035, (USD Billion) (Thousand Units)
- 12.1 Key trends
- 12.2 Single stage
- 12.3 Multistage
Chapter 13 Market Estimates & Forecast, By Application, 2022 - 2035, (USD Billion) (Thousand Units)
- 13.1 Key trends
- 13.2 Oil production
- 13.3 Gas production
- 13.4 Water injection
- 13.5 Artificial lift (EOR)
- 13.6 Thermal recovery
Chapter 14 Market Estimates & Forecast, By Distribution Channel, 2022 - 2035, (USD Billion) (Thousand Units)
- 14.1 Key trends
- 14.2 Direct sales
- 14.3 Indirect sales
Chapter 15 Market Estimates & Forecast, By Region, 2022 - 2035, (USD Billion) (Thousand Units)
- 15.1 Key trends
- 15.2 North America
- 15.2.1 U.S.
- 15.2.2 Canada
- 15.3 Europe
- 15.3.1 Germany
- 15.3.2 UK
- 15.3.3 France
- 15.3.4 Italy
- 15.3.5 Spain
- 15.4 Asia Pacific
- 15.4.1 China
- 15.4.2 India
- 15.4.3 Japan
- 15.4.4 South Korea
- 15.4.5 Australia
- 15.4.6 Indonesia
- 15.4.7 Malaysia
- 15.5 Latin America
- 15.5.1 Brazil
- 15.5.2 Mexico
- 15.5.3 Argentina
- 15.6 MEA
- 15.6.1 Saudi Arabia
- 15.6.2 UAE
- 15.6.3 South Africa
Chapter 16 Company Profiles
- 16.1 Atlas Copco AB
- 16.2 Baker Hughes
- 16.3 Borets International Ltd
- 16.4 Crompton Greaves Consumer Electricals Limited
- 16.5 EBARA CORPORATION
- 16.6 Flowserve Corporation
- 16.7 Gorman-Rupp Pumps
- 16.8 Grundfos Holding A/S
- 16.9 Halliburton
- 16.10 Novomet
- 16.11 Schlumberger Ltd
- 16.12 Sulzer Ltd
- 16.13 Tsurumi Manufacturing Co. Ltd.
- 16.14 Weatherford
- 16.15 WILO SE
 电动潜水帮浦市场:按级数、马达类型、额定功率、最终用户和应用划分-2026年至2032年全球预测电动潜水泵浦系统市场:按泵浦类型、马达类型、级数、材料、额定功率和最终用途产业划分,全球预测,2026-2032年
 石油和天然气产业电动潜水泵(ESP)市场-全球产业规模、份额、趋势、机会和预测:按应用、运作方式、地区和竞争格局划分,2021-2031年
 电动式潜水帮浦市场规模、份额和成长分析(按产品类型、扬程类型和地区划分)-2026-2033年产业预测
 2032 年电动潜水帮浦市场预测:按井型、操作、马达类型、帮浦等级、应用、最终用户和地区分類的全球分析
 欧洲石油和天然气用电动潜油泵:市场占有率分析、产业趋势和成长预测(2025-2030)
 电动潜水帮浦市场机会、成长动力、产业趋势分析及 2024 - 2032 年预测
 潜油电泵市场规模、份额、趋势分析报告:按产品、最终用途、地区、细分市场预测,2024-2030 年