


 |
市场调查报告书
商品编码
1913309
加工蔬果市场机会、成长要素、产业趋势分析及预测(2026-2035年)Processed Fruits and Vegetables Market Opportunity, Growth Drivers, Industry Trend Analysis, and Forecast 2026 - 2035 |
||||||
全球加工水果和蔬菜市场预计到 2025 年将达到 3,997 亿美元,到 2035 年将达到 6,206 亿美元,年复合成长率为 4.5%。
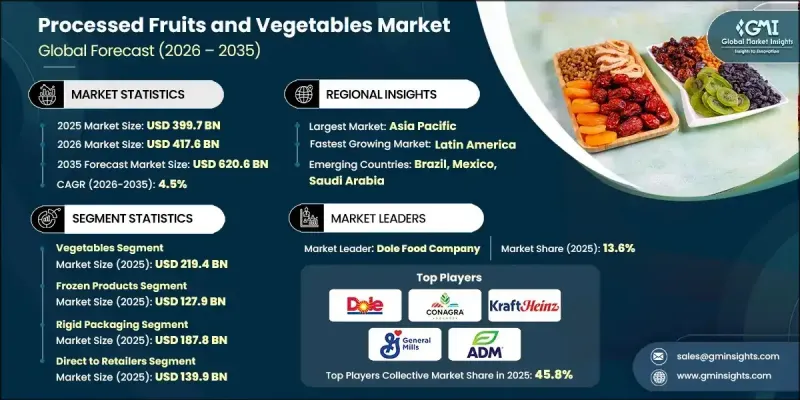
成长的驱动力在于消费模式的转变,而这种转变强调日常饮食的便利性和时间效率。都市化、工作时间延长以及家庭结构的改变持续减少人们用于准备膳食的时间,从而推动了对无需烹饪的即食食品的需求。加工蔬果满足了这些需求,其优势包括保质期长、品质稳定以及在各种消费场景下易于使用。同时,人们对营养和均衡饮食的日益重视也提升了消费者对加工农产品的正面看法。许多消费者现在认为,只要营养价值得以维持,这些产品就可以作为新鲜食品的可行替代品。消费者对低加工食品、冷冻产品以及以植物性食物为主的饮食习惯的接受度不断提高,正在扩大消费者群体,并巩固零售和餐饮管道的长期市场扩张。
| 市场覆盖范围 | |
|---|---|
| 开始年份 | 2025 |
| 预测年份 | 2026-2035 |
| 起始值 | 3997亿美元 |
| 预测金额 | 6206亿美元 |
| 复合年增长率 | 4.5% |
预计到2025年,蔬菜市场规模将达到2,194亿美元。蔬菜因其在家庭、餐饮服务和工业食品生产中的广泛用途,已成为加工蔬果市场的主要产品系列。与水果相比,蔬菜保质期长、天然糖分含量低,且能适应世界各地的烹饪风格,这些优势支撑了其强劲而稳定的需求。
冷冻食品将在加工食品中占据主导地位,到 2025 年市场规模将达到 1,279 亿美元。这些产品因其保质期长、营养价值、口感和风味得以保留而备受青睐,可满足商业和消费者的各种需求。
预计到2025年,北美加工蔬果市场将占据23%的市场份额,这主要得益于先进的加工技术、强大的低温运输基础设施和严格的食品安全标准。美国凭藉其大规模的製造业基地、较高的人均加工食品消费量以及完善的零售和餐饮服务业网络,在区域生产中处于领先地位。
目录
第一章调查方法和范围
第二章执行摘要
第三章业界考察
- 生态系分析
- 供应商情况
- 利润率
- 每个阶段的附加价值
- 影响价值链的因素
- 中断
- 产业影响因素
- 司机
- 消费者对方便食品的需求不断成长
- 人们越来越关注健康和保健
- 有组织的零售和电子商务的扩张
- 产业潜在风险与挑战
- 对季节性原料的高度依赖
- 严格的食品安全和品质法规
- 市场机会
- 拓展至植物来源及功能性产品领域
- 有可能出口到当地产量有限的地区。
- 司机
- 成长潜力分析
- 监管环境
- 北美洲
- 欧洲
- 亚太地区
- 拉丁美洲
- 中东和非洲
- 波特五力分析
- PESTEL 分析
- 价格趋势
- 按地区
- 产品类型
- 未来市场趋势
- 科技与创新趋势
- 当前技术趋势
- 新兴技术
- 专利状态
- 贸易统计(HS编码)(註:仅提供主要国家的贸易统计)
- 主要进口国
- 主要出口国
- 永续性和环境方面
- 永续努力
- 减少废弃物策略
- 生产中的能源效率
- 环保倡议
- 碳足迹考量
第四章 竞争情势
- 介绍
- 公司市占率分析
- 按地区
- 北美洲
- 欧洲
- 亚太地区
- 拉丁美洲
- 中东和非洲
- 按地区
- 企业矩阵分析
- 主要市场公司的竞争分析
- 竞争定位矩阵
- 重大进展
- 併购
- 伙伴关係与合作
- 新产品发布
- 扩张计划
第五章 依产品类型分類的市场估算与预测,2022-2035年
- 水果
- 柑橘
- 莓果
- 核果
- 热带水果
- 其他水果
- 蔬菜
- 叶菜类和十字花科蔬菜
- 根茎类和球茎类蔬菜
- 其他蔬菜
第六章 按加工类型分類的市场估算与预测,2022-2035年
- 罐装和瓶装产品
- 冷冻产品
- 干/脱水产品
- 新鲜切製/极简加工
- 果汁和浓缩液
- 果酱和果冻
- 食物泥和酱汁
- 其他的
7. 按包装类型分類的市场估价与预测,2022-2035 年
- 硬包装
- 金属罐
- 玻璃瓶
- 硬质塑胶容器
- 软包装
- 立式袋
- 杀菌袋
- 包装袋、薄膜和包装纸
- 散装包装
- 桶和罐
- 吨桶/IBC容器
- 无菌散装容器
- 其他的
第八章 按分销管道分類的市场估算与预测,2022-2035年
- 线上平台
- 直接销售给零售商
- 批发商
- 其他的
第九章 2022-2035年各地区市场估算与预测
- 北美洲
- 美国
- 加拿大
- 欧洲
- 德国
- 英国
- 法国
- 西班牙
- 义大利
- 其他欧洲地区
- 亚太地区
- 中国
- 印度
- 日本
- 澳洲
- 韩国
- 亚太其他地区
- 拉丁美洲
- 巴西
- 墨西哥
- 其他拉丁美洲地区
- 中东和非洲
- 沙乌地阿拉伯
- 南非
- 阿拉伯聯合大公国
- 其他中东和非洲地区
第十章:公司简介
- Dole Food Company
- Conagra Brands, Inc.
- Del Monte Foods, Inc.
- Nestle SA
- The Kraft Heinz Company
- General Mills, Inc.
- B&G Foods, Inc.
- ADM
- ABC Fruits
- Conagra
- Vebzy Nature
- Grofresh Agrofoods Pvt Ltd
The Global Processed Fruits and Vegetables Market was valued at USD 399.7 billion in 2025 and is estimated to grow at a CAGR of 4.5% to reach USD 620.6 billion by 2035.
Growth is supported by changing consumption patterns that favor convenience and time efficiency in daily meals. Urbanization, longer working schedules, and evolving household structures continue to reduce time available for food preparation, strengthening demand for ready-to-use and ready-to-eat food options. Processed fruits and vegetables address these needs by offering extended shelf life, consistent quality, and ease of use across multiple consumption settings. At the same time, rising awareness of nutrition and balanced diets is supporting positive consumer perception of processed produce. Many consumers now view these products as practical alternatives to fresh options when nutritional value is preserved. Growing acceptance of minimally processed formats, frozen offerings, and plant-forward eating habits is widening the consumer base and reinforcing long-term market expansion across retail and foodservice channels.
| Market Scope | |
|---|---|
| Start Year | 2025 |
| Forecast Year | 2026-2035 |
| Start Value | $399.7 Billion |
| Forecast Value | $620.6 Billion |
| CAGR | 4.5% |
The vegetables category generated USD 219.4 billion in 2025. Vegetables represent the dominant product group within the processed fruits and vegetables market due to broad utilization across households, foodservice operations, and industrial food production. Their longer storage potential, lower natural sugar content compared to fruits, and adaptability across global cuisines contribute to strong and consistent demand.
The frozen formats segment accounted for USD 127.9 billion in 2025, holding a leading share within processing types. These products are favored for their ability to preserve nutritional content, texture, and taste while offering extended storage life, supporting both commercial and consumer use.
North America Processed Fruits and Vegetables Market held 23% share in 2025, supported by advanced processing capabilities, robust cold-chain infrastructure, and strong food safety standards. The United States leads regional production due to a large manufacturing base, high per-capita consumption of convenience foods, and well-developed retail and foodservice networks.
Key companies active in the Global Processed Fruits and Vegetables Market include Nestle S.A., Dole Food Company, The Kraft Heinz Company, General Mills, Inc., Del Monte Foods, Inc., Conagra Brands, Inc., B&G Foods, Inc., ADM, Grofresh Agrofoods Pvt Ltd, Vebzy Nature and ABC Fruits. Companies operating in the Global Processed Fruits and Vegetables Market strengthen their position through product innovation, supply chain efficiency, and geographic expansion. Leading players invest in processing technologies that maintain nutritional integrity while improving shelf stability. Portfolio diversification across formats and price points helps address varied consumer preferences. Firms also focus on sourcing optimization and long-term partnerships with growers to ensure consistent raw material supply. Expansion into emerging markets, along with enhanced distribution networks, supports volume growth.
Table of Contents
Chapter 1 Methodology & Scope
- 1.1 Market scope and definition
- 1.2 Research design
- 1.2.1 Research approach
- 1.2.2 Data collection methods
- 1.3 Data mining sources
- 1.3.1 Global
- 1.3.2 Regional/Country
- 1.4 Base estimates and calculations
- 1.4.1 Base year calculation
- 1.4.2 Key trends for market estimation
- 1.5 Primary research and validation
- 1.5.1 Primary sources
- 1.6 Forecast model
- 1.7 Research assumptions and limitations
Chapter 2 Executive Summary
- 2.1 Industry 360° synopsis
- 2.2 Key market trends
- 2.2.1 Regional
- 2.2.2 Product Type
- 2.2.3 Processing Form
- 2.2.4 Packaging Type
- 2.2.5 Distribution Channel
- 2.3 TAM Analysis, 2026-2035
- 2.4 CXO perspectives: Strategic imperatives
- 2.4.1 Executive decision points
- 2.4.2 Critical success factors
- 2.5 Future Outlook and Strategic Recommendations
Chapter 3 Industry Insights
- 3.1 Industry ecosystem analysis
- 3.1.1 Supplier Landscape
- 3.1.2 Profit Margin
- 3.1.3 Value addition at each stage
- 3.1.4 Factor affecting the value chain
- 3.1.5 Disruptions
- 3.2 Industry impact forces
- 3.2.1 Growth drivers
- 3.2.1.1 Rising consumer demand for convenience foods
- 3.2.1.2 Growing health & wellness consciousness
- 3.2.1.3 Expansion of organized retail & e-commerce
- 3.2.2 Industry pitfalls and challenges
- 3.2.2.1 High Dependency on Seasonal Raw Materials
- 3.2.2.2 Stringent Food Safety and Quality Regulations
- 3.2.3 Market opportunities
- 3.2.3.1 Expansion into Plant-Based and Functional Products
- 3.2.3.2 Export potential to regions with limited local production
- 3.2.1 Growth drivers
- 3.3 Growth potential analysis
- 3.4 Regulatory landscape
- 3.4.1 North America
- 3.4.2 Europe
- 3.4.3 Asia Pacific
- 3.4.4 Latin America
- 3.4.5 Middle East & Africa
- 3.5 Porter's analysis
- 3.6 PESTEL analysis
- 3.7 Price trends
- 3.7.1 By region
- 3.7.2 Product Type
- 3.8 Future market trends
- 3.9 Technology and Innovation Landscape
- 3.9.1 Current technological trends
- 3.9.2 Emerging technologies
- 3.10 Patent Landscape
- 3.11 Trade statistics (HS code) (Note: the trade statistics will be provided for key countries only)
- 3.11.1 Major importing countries
- 3.11.2 Major exporting countries
- 3.12 Sustainability and environmental aspects
- 3.12.1 Sustainable practices
- 3.12.2 Waste reduction strategies
- 3.12.3 Energy efficiency in production
- 3.12.4 Eco-friendly initiatives
- 3.13 Carbon footprint considerations
Chapter 4 Competitive Landscape, 2025
- 4.1 Introduction
- 4.2 Company market share analysis
- 4.2.1 By region
- 4.2.1.1 North America
- 4.2.1.2 Europe
- 4.2.1.3 Asia Pacific
- 4.2.1.4 LATAM
- 4.2.1.5 MEA
- 4.2.1 By region
- 4.3 Company matrix analysis
- 4.4 Competitive analysis of major market players
- 4.5 Competitive positioning matrix
- 4.6 Key developments
- 4.6.1 Mergers & acquisitions
- 4.6.2 Partnerships & collaborations
- 4.6.3 New product launches
- 4.6.4 Expansion plans
Chapter 5 Market Estimates and Forecast, By Product Type, 2022 - 2035 (USD Billion) (Kilo Tons)
- 5.1 Key trends
- 5.2 Fruits
- 5.2.1 Citrus fruits
- 5.2.2 Berries
- 5.2.3 Stone fruits
- 5.2.4 Tropical fruits
- 5.2.5 Other fruits
- 5.3 Vegetables
- 5.3.1 Leafy & cruciferous vegetables
- 5.3.2 Root & bulb vegetables
- 5.3.3 Other vegetables
Chapter 6 Market Estimates and Forecast, By Processing Form, 2022 - 2035 (USD Billion) (Kilo Tons)
- 6.1 Key trends
- 6.2 Canned / jarred products
- 6.3 Frozen products
- 6.4 Dried & dehydrated
- 6.5 Fresh-cut / minimally processed
- 6.6 Juices & concentrates
- 6.7 Preserves, jams & jellies
- 6.8 Purees & sauces
- 6.9 Others
Chapter 7 Market Estimates and Forecast, By Packaging Type, 2022 - 2035 (USD Billion) (Kilo Tons)
- 7.1 Key trends
- 7.2 Rigid packaging
- 7.2.1 Metal cans
- 7.2.2 Glass jars
- 7.2.3 Rigid plastic containers
- 7.3 Flexible packaging
- 7.3.1 Stand-up pouches
- 7.3.2 Retort pouches
- 7.3.3 Bags, films & wraps
- 7.4 Bulk packaging
- 7.4.1 Drums & pails
- 7.4.2 Totes & IBC containers
- 7.4.3 Aseptic bulk containers
- 7.5 Others
Chapter 8 Market Estimates and Forecast, By Distribution Channel, 2022 - 2035 (USD Billion) (Kilo Tons)
- 8.1 Key trends
- 8.2 Online platforms
- 8.3 Direct to retailers
- 8.4 Wholesalers
- 8.5 Others
Chapter 9 Market Estimates and Forecast, By Region, 2022 - 2035 (USD Billion) (Kilo Tons)
- 9.1 Key trends
- 9.2 North America
- 9.2.1 U.S.
- 9.2.2 Canada
- 9.3 Europe
- 9.3.1 Germany
- 9.3.2 UK
- 9.3.3 France
- 9.3.4 Spain
- 9.3.5 Italy
- 9.3.6 Rest of Europe
- 9.4 Asia Pacific
- 9.4.1 China
- 9.4.2 India
- 9.4.3 Japan
- 9.4.4 Australia
- 9.4.5 South Korea
- 9.4.6 Rest of Asia Pacific
- 9.5 Latin America
- 9.5.1 Brazil
- 9.5.2 Mexico
- 9.5.3 Rest of Latin America
- 9.6 Middle East and Africa
- 9.6.1 Saudi Arabia
- 9.6.2 South Africa
- 9.6.3 UAE
- 9.6.4 Rest of Middle East and Africa
Chapter 10 Company Profiles
- 10.1 Dole Food Company
- 10.2 Conagra Brands, Inc.
- 10.3 Del Monte Foods, Inc.
- 10.4 Nestle S.A.
- 10.5 The Kraft Heinz Company
- 10.6 General Mills, Inc.
- 10.7 B&G Foods, Inc.
- 10.8 ADM
- 10.9 ABC Fruits
- 10.10 Conagra
- 10.11 Vebzy Nature
- 10.12 Grofresh Agrofoods Pvt Ltd


