


 |
市场调查报告书
商品编码
1913336
植物来源棒市场机会、成长要素、产业趋势分析及2026年至2035年预测Plant-Based Bars Market Opportunity, Growth Drivers, Industry Trend Analysis, and Forecast 2026 - 2035 |
||||||
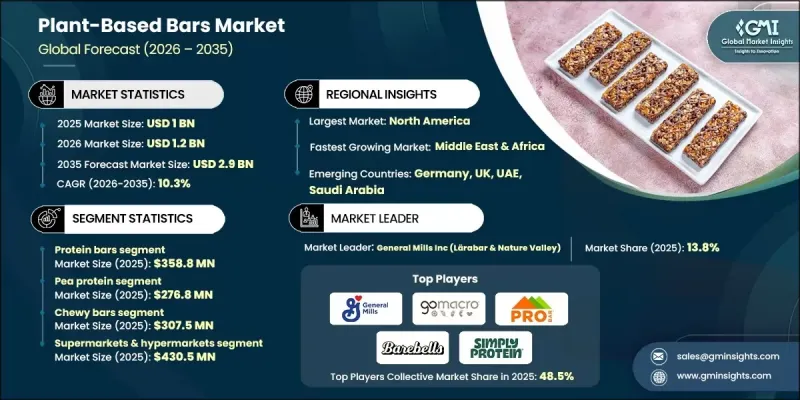
全球植物来源棒市场预计到 2025 年将达到 10 亿美元,到 2035 年将达到 29 亿美元,年复合成长率为 10.3%。
随着消费者对植物来源营养和弹性素食习惯的日益追求,市场正稳步增长。人们对植物性饮食的健康和永续性益处的认识不断提高,正逐步减少动物性蛋白质的摄入,从而扩大植物来源棒的消费群。注重健康的消费者和一般消费者都越来越倾向于选择便携、无过敏原、洁净标示且方便的零食,这也支撑了市场需求。人们对个人健康的偏好也影响着购买行为,他们积极寻找能够促进心血管健康、体重管理和整体平衡的功能性零食。植物来源棒定位为高蛋白、高纤维和天然产品,与以预防保健为中心的生活方式转变不谋而合。健身习惯的养成和积极参与体育活动的趋势持续推动市场需求,植物来源棒正成为便捷补充蛋白质、能量和肌肉支持的热门选择。为此,製造商正在开发以提升运动表现为核心的功能性营养产品。
| 市场覆盖范围 | |
|---|---|
| 开始年份 | 2025 |
| 预测年份 | 2026-2035 |
| 起始值 | 10亿美元 |
| 预测金额 | 29亿美元 |
| 复合年增长率 | 10.3% |
预计到2025年,蛋白棒市场规模将达到3.588亿美元。由于产品类型与消费者对营养丰富、注重生活方式的零食产品的需求高度契合,因此有望引领整个市场。蛋白棒被广泛认为是两餐之间、运动后恢復和持久饱腹的理想选择,因此越来越受到注重健身人士以及寻求非动物蛋白替代品的弹性素食者的青睐。
预计到2025年,豌豆蛋白市场规模将达到2.768亿美元。其广泛应用得益于其优异的营养成分、中性的感官特性以及广泛的消费者接受度。豌豆蛋白具有高消化率和均衡的氨基酸组成,因此适合食物敏感人群,尤其是那些需要避免常见过敏原的人。其配方的多样性使生产商能够实现所需的质地和一致性,同时支持洁净标示和非基因改造(非GMO)声明,从而巩固了其在植物来源强化蛋白零食产品中的地位。
预计到2025年,北美植物基能量棒市场将占据42%的市场份额,其中美国将占据该地区的大部分美国份额。美国市场受益于庞大的健康意识消费群体、成熟的包装零食生态系统以及强大的线上线下分销网络。消费者对植物性饮食习惯的高度认知,以及根深蒂固的健身和健康文化,持续推动产品的普及。不断扩充的产品线、频繁的新品产品推出以及在网路平台上的强大曝光度,进一步巩固了植物来源能量棒在美国市场的渗透率,并成为其关键的成长引擎。
目录
第一章调查方法和范围
第二章执行摘要
第三章业界考察
- 生态系分析
- 供应商情况
- 利润率
- 每个阶段的附加价值
- 影响价值链的因素
- 中断
- 产业影响因素
- 司机
- 消费者对植物来源营养和弹性素食的需求日益增长
- 人们越来越关注健康和保健
- 运动营养和积极生活方式市场的扩张
- 产业潜在风险与挑战
- 洁净标示配方中的保存期限和稳定性问题
- 特种植物蛋白供应链波动性
- 市场机会
- 拓展机构和餐饮服务业的管道
- 永续包装创新与高端定位
- 司机
- 成长潜力分析
- 监管环境
- 北美洲
- 欧洲
- 亚太地区
- 拉丁美洲
- 中东和非洲
- 波特五力分析
- PESTEL 分析
- 价格趋势
- 按地区
- 产品类型
- 未来市场趋势
- 科技与创新趋势
- 当前技术趋势
- 新兴技术
- 专利状态
- 贸易统计(HS编码)(註:仅提供主要国家的贸易统计)
- 主要进口国
- 主要出口国
- 永续性和环境方面
- 永续努力
- 减少废弃物策略
- 生产中的能源效率
- 环保倡议
- 碳足迹考量
第四章 竞争情势
- 介绍
- 公司市占率分析
- 按地区
- 北美洲
- 欧洲
- 亚太地区
- 拉丁美洲
- 中东和非洲
- 按地区
- 企业矩阵分析
- 主要市场公司的竞争分析
- 竞争定位矩阵
- 重大进展
- 併购
- 伙伴关係与合作
- 新产品发布
- 扩张计划
第五章 依产品类型分類的市场估算与预测,2022-2035年
- 谷物棒和Granola片棒
- 蛋白质棒
- 能量棒
- 代餐棒
- 水果坚果棒
- 其他的
6. 2022-2035年按来源分類的市场估计与预测
- 大豆蛋白
- 豌豆蛋白
- 米蛋白质
- 小麦蛋白
- 坚果蛋白
- 杏仁
- 腰果
- 花生
- 其他的
7. 按生产方式分類的市场估算与预测,2022-2035 年
- 咀嚼棒
- 脆脆巧克力棒
- 软烤棒
- 低温冷压吧
- 挤压棒材
- 免装订酒吧
第八章 按分销管道分類的市场估算与预测,2022-2035年
- 超级市场和大卖场
- 便利商店
- 专卖店和健康食品店
- 线上零售与电子商务
- 其他的
第九章 2022-2035年各地区市场估算与预测
- 北美洲
- 美国
- 加拿大
- 欧洲
- 德国
- 英国
- 法国
- 西班牙
- 义大利
- 其他欧洲地区
- 亚太地区
- 中国
- 印度
- 日本
- 澳洲
- 韩国
- 亚太其他地区
- 拉丁美洲
- 巴西
- 墨西哥
- 其他拉丁美洲地区
- 中东和非洲
- 沙乌地阿拉伯
- 南非
- 阿拉伯聯合大公国
- 其他中东和非洲地区
第十章:公司简介
- BHU Foods
- PROBAR, Inc
- Barebells
- General Mills Inc(Larabar &Nature Valley)
- Simply Protein
- NuGo Nutrition
- Rise Bar
- Raw Rev
- GoMacro
- Orgain
- No Cow
- Nutree Life
- Numix
The Global Plant-Based Bars Market was valued at USD 1 billion in 2025 and is estimated to grow at a CAGR of 10.3% to reach USD 2.9 billion by 2035.
The market is gaining steady momentum as consumers increasingly gravitate toward plant-based nutrition and flexitarian eating patterns. Growing understanding of the health and sustainability benefits associated with plant-focused diets is encouraging a gradual reduction in animal protein intake, which is broadening the consumer base for plant-based bars. Demand is further supported by the rising preference for portable, allergen-friendly, clean-label, and easy-to-consume snack options among both health-driven and mainstream buyers. Heightened focus on personal wellness is also shaping purchasing behavior, with consumers actively seeking functional snack options that support cardiovascular health, weight management, and overall physical balance. Plant-based bars positioned as protein-rich, fiber-dense, and naturally sourced products align well with evolving lifestyle priorities centered on preventive health. Increasing participation in fitness-oriented routines and physically active lifestyles continues to stimulate demand, as plant-based bars are widely chosen for convenient protein intake, energy replenishment, and muscle support. Manufacturers are responding by developing formulations centered on performance-focused and functional nutrition benefits.
| Market Scope | |
|---|---|
| Start Year | 2025 |
| Forecast Year | 2026-2035 |
| Start Value | $1 Billion |
| Forecast Value | $2.9 Billion |
| CAGR | 10.3% |
The protein bars segment reached USD 358.8 million in 2025. This product category leads the overall segmentation due to its strong alignment with consumer demand for nutrition-forward and lifestyle-oriented snack products. Protein bars are widely perceived as practical options for consumption between meals, post-activity recovery, and prolonged satiety, which has strengthened their appeal among fitness-focused individuals as well as flexitarian consumers seeking non-animal protein alternatives.
The pea protein segment generated USD 276.8 million in 2025. Its widespread adoption is driven by its favorable nutritional profile, neutral sensory characteristics, and broad consumer acceptance. High digestibility and a well-balanced amino acid composition make pea protein suitable for individuals with dietary sensitivities, particularly those avoiding common allergens. Its formulation versatility allows producers to achieve desirable texture and consistency while supporting clean-label positioning and non-GMO claims, reinforcing its role in plant-based, protein-enriched snack products.
North America Plant-Based Bars Market represented 42% share in 2025, with the United States accounting for the majority share within the region. The U.S. market benefits from a large population of wellness-focused consumers, a mature packaged snack ecosystem, and strong distribution through both physical retail and digital channels. High awareness of plant-based eating patterns, coupled with a deeply ingrained fitness and wellness culture, continues to support product adoption. Expanding product assortments, frequent new launches, and strong visibility across online platforms further strengthen market penetration in the U.S., making it a key growth engine for plant-based bar manufacturers.
Key companies active in the Global Plant-Based Bars Market include PROBAR, Inc, BHU Foods, Barebells, Simply Protein, General Mills Inc., through its Larabar and Nature Valley brands, Rise Bar, NuGo Nutrition, Raw Rev, Orgain, GoMacro, No Cow, Numix, Nutree Life, and others operating across global and regional markets. Companies operating in the Global Plant-Based Bars Market are strengthening their market position by prioritizing product innovation focused on protein quality, functional benefits, and ingredient transparency. Many brands are investing in research to refine formulations that enhance taste, texture, and nutritional density while maintaining clean-label standards. Expansion across U.S. retail formats, including specialty health stores and direct-to-consumer platforms, remains a core strategy. Firms are also leveraging targeted marketing that emphasizes lifestyle alignment, fitness support, and everyday convenience. Strategic pricing, sustainable sourcing narratives, and portfolio diversification aimed at different consumer needs are being used to deepen brand loyalty and expand reach across the U.S. market.
Table of Contents
Chapter 1 Methodology & Scope
- 1.1 Market scope and definition
- 1.2 Research design
- 1.2.1 Research approach
- 1.2.2 Data collection methods
- 1.3 Data mining sources
- 1.3.1 Global
- 1.3.2 Regional/Country
- 1.4 Base estimates and calculations
- 1.4.1 Base year calculation
- 1.4.2 Key trends for market estimation
- 1.5 Primary research and validation
- 1.5.1 Primary sources
- 1.6 Forecast model
- 1.7 Research assumptions and limitations
Chapter 2 Executive Summary
- 2.1 Industry 3600 synopsis
- 2.2 Key market trends
- 2.2.1 Regional
- 2.2.2 Product Type
- 2.2.3 Source
- 2.2.4 Processing Method
- 2.2.5 Distribution Channel
- 2.3 TAM Analysis, 2026-2035
- 2.4 CXO perspectives: Strategic imperatives
- 2.4.1 Executive decision points
- 2.4.2 Critical success factors
- 2.5 Future Outlook and Strategic Recommendations
Chapter 3 Industry Insights
- 3.1 Industry ecosystem analysis
- 3.1.1 Supplier Landscape
- 3.1.2 Profit Margin
- 3.1.3 Value addition at each stage
- 3.1.4 Factor affecting the value chain
- 3.1.5 Disruptions
- 3.2 Industry impact forces
- 3.2.1 Growth drivers
- 3.2.1.1 Rising consumer demand for plant-based nutrition & flexitarian diets
- 3.2.1.2 Growing health & wellness consciousness
- 3.2.1.3 Sports nutrition & active lifestyle market expansion
- 3.2.2 Industry pitfalls and challenges
- 3.2.2.1 Shelf life & stability issues with clean label formulations
- 3.2.2.2 Supply chain volatility for specialty plant proteins
- 3.2.3 Market opportunities
- 3.2.3.1 Institutional & foodservice channel expansion
- 3.2.3.2 Sustainable packaging innovation & premium positioning
- 3.2.1 Growth drivers
- 3.3 Growth potential analysis
- 3.4 Regulatory landscape
- 3.4.1 North America
- 3.4.2 Europe
- 3.4.3 Asia Pacific
- 3.4.4 Latin America
- 3.4.5 Middle East & Africa
- 3.5 Porter's analysis
- 3.6 PESTEL analysis
- 3.7 Price trends
- 3.7.1 By region
- 3.7.2 Product type
- 3.8 Future market trends
- 3.9 Technology and Innovation Landscape
- 3.9.1 Current technological trends
- 3.9.2 Emerging technologies
- 3.10 Patent Landscape
- 3.11 Trade statistics (HS code) (Note: the trade statistics will be provided for key countries only)
- 3.11.1 Major importing countries
- 3.11.2 Major exporting countries
- 3.12 Sustainability and environmental aspects
- 3.12.1 Sustainable practices
- 3.12.2 Waste reduction strategies
- 3.12.3 Energy efficiency in production
- 3.12.4 Eco-friendly initiatives
- 3.13 Carbon footprint considerations
Chapter 4 Competitive Landscape, 2025
- 4.1 Introduction
- 4.2 Company market share analysis
- 4.2.1 By region
- 4.2.1.1 North America
- 4.2.1.2 Europe
- 4.2.1.3 Asia Pacific
- 4.2.1.4 LATAM
- 4.2.1.5 MEA
- 4.2.1 By region
- 4.3 Company matrix analysis
- 4.4 Competitive analysis of major market players
- 4.5 Competitive positioning matrix
- 4.6 Key developments
- 4.6.1 Mergers & acquisitions
- 4.6.2 Partnerships & collaborations
- 4.6.3 New product launches
- 4.6.4 Expansion plans
Chapter 5 Market Estimates and Forecast, By Product Type, 2022 - 2035 (USD Million) (Units)
- 5.1 Key trends
- 5.2 Cereal & granola bars
- 5.3 Protein bars
- 5.4 Energy bars
- 5.5 Meal replacement bars
- 5.6 Fruits & nuts bars
- 5.7 Others
Chapter 6 Market Estimates and Forecast, By Source, 2022 - 2035 (USD Million) (Units)
- 6.1 Key trends
- 6.2 Soy protein
- 6.3 Pea protein
- 6.4 Rice protein
- 6.5 Wheat protein
- 6.6 Nut proteins
- 6.6.1 Almond
- 6.6.2 Cashew
- 6.6.3 Peanut
- 6.7 Others
Chapter 7 Market Estimates and Forecast, By Processing Method, 2022 - 2035 (USD Million) (Units)
- 7.1 Key trends
- 7.2 Chewy bars
- 7.3 Crunchy bars
- 7.4 Soft-baked bars
- 7.5 Raw & cold-pressed bars
- 7.6 Extruded bars
- 7.7 Binder-free bars
Chapter 8 Market Estimates and Forecast, By Distribution Channel, 2022 - 2035 (USD Million) (Units)
- 8.1 Key trends
- 8.2 Supermarkets & hypermarkets
- 8.3 Convenience stores
- 8.4 Specialty & health food stores
- 8.5 Online retail & e-commerce
- 8.6 Others
Chapter 9 Market Estimates and Forecast, By Region, 2022 - 2035 (USD Million) (Units)
- 9.1 Key trends
- 9.2 North America
- 9.2.1 U.S.
- 9.2.2 Canada
- 9.3 Europe
- 9.3.1 Germany
- 9.3.2 UK
- 9.3.3 France
- 9.3.4 Spain
- 9.3.5 Italy
- 9.3.6 Rest of Europe
- 9.4 Asia Pacific
- 9.4.1 China
- 9.4.2 India
- 9.4.3 Japan
- 9.4.4 Australia
- 9.4.5 South Korea
- 9.4.6 Rest of Asia Pacific
- 9.5 Latin America
- 9.5.1 Brazil
- 9.5.2 Mexico
- 9.5.3 Rest of Latin America
- 9.6 Middle East and Africa
- 9.6.1 Saudi Arabia
- 9.6.2 South Africa
- 9.6.3 UAE
- 9.6.4 Rest of Middle East and Africa
Chapter 10 Company Profiles
- 10.1 BHU Foods
- 10.2 PROBAR, Inc
- 10.3 Barebells
- 10.4 General Mills Inc (Larabar & Nature Valley)
- 10.5 Simply Protein
- 10.6 NuGo Nutrition
- 10.7 Rise Bar
- 10.8 Raw Rev
- 10.9 GoMacro
- 10.10 Orgain
- 10.11 No Cow
- 10.12 Nutree Life
- 10.13 Numix


