


 |
市场调查报告书
商品编码
1913345
乳蛋白质市场机会、成长要素、产业趋势分析及预测(2026年至2035年)Milk Protein Market Opportunity, Growth Drivers, Industry Trend Analysis, and Forecast 2026 - 2035 |
||||||
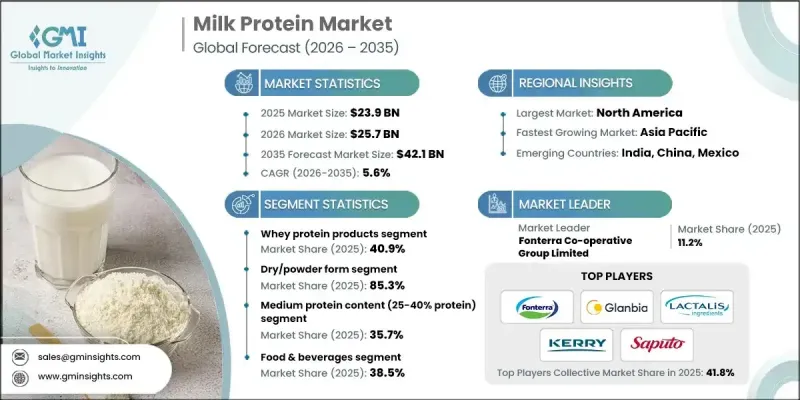
全球乳蛋白质市场预计到 2025 年将达到 239 亿美元,到 2035 年将达到 421 亿美元,年复合成长率为 5.6%。
乳蛋白质凭藉其卓越的营养价值和功能性,稳居基础原料地位,并在众多营养产品类型中广受认可。消费者日益关注均衡饮食、积极生活方式和整体健康,显着提升了对强化蛋白质食品和饮料的需求。这一转变使乳蛋白质成为兼顾营养价值和功能性的生产商的首选原料。除了营养益处外,乳蛋白质还能改善质地、浓稠度和产品稳定性,进而提高配方效率。消费者对洁净标示和天然成分的偏好不断增长,进一步巩固了他们对乳蛋白的信任。同时,加工技术的不断进步改进了过滤和分离方法,从而生产出吸收率和利用率更高的优质产品。这些改进使生产商能够提供量身定制的乳蛋白质解决方案,以满足不断变化的营养需求和特定的健康消费模式。
| 市场覆盖范围 | |
|---|---|
| 开始年份 | 2025 |
| 预测年份 | 2026-2035 |
| 起始值 | 239亿美元 |
| 预测金额 | 421亿美元 |
| 复合年增长率 | 5.6% |
2025年,干粉状产品市占率占比达85.3%,预计2026年至2035年将以6.3%的复合年增长率成长。此形态因其保质期长、易于运输以及适用于多种食品和营养应用而被广泛采用。其稳定性好、配方柔软性,使其成为大规模生产的首选。
液态和浓缩乳蛋白的需求正在稳定成长,尤其是在那些对质地顺滑和快速溶解性要求较高的领域。随着消费者对便利营养的需求日益增长,这些形式的乳蛋白在饮料和乳製品配方中越来越受欢迎。
预计到 2025 年,中等浓度(40%-70%)乳蛋白质将占市场份额的 35.7%,到 2035 年将以 5.4% 的复合年增长率增长。此类别产品兼具成本效益和功能性,因此在以营养为重点的产品线中广泛应用,并且仍然是一个有吸引力的选择。
预计到2025年,北美乳蛋白质市占率将达到32%。该地区受益于消费者对富含蛋白质、加工最少的产品的强劲需求以及完善的生产基础设施。根深蒂固的健康意识文化持续推动营养食品和饮料领域的创新。
目录
第一章调查方法和范围
第二章执行摘要
第三章业界考察
- 生态系分析
- 供应商情况
- 利润率
- 每个阶段的附加价值
- 影响价值链的因素
- 中断
- 产业影响因素
- 司机
- 人们越来越关注健康和保健
- 运动和营养品市场日益增长
- 增加食品中的蛋白质强化程度
- 产业潜在风险与挑战
- 原奶价格波动
- 乳糖不耐症和乳製品过敏
- 市场机会
- 拓展生物活性蛋白的应用
- 个性化营养产品开发
- 司机
- 成长潜力分析
- 监管环境
- 北美洲
- 欧洲
- 亚太地区
- 拉丁美洲
- 中东和非洲
- 波特五力分析
- PESTEL 分析
- 价格趋势
- 按地区
- 依产品类型
- 未来市场趋势
- 科技与创新趋势
- 当前技术趋势
- 新兴技术
- 专利状态
- 贸易统计(HS编码)
(註:贸易统计数据仅涵盖主要国家。)
- 主要进口国
- 主要出口国
- 永续性和环境方面
- 永续努力
- 减少废弃物策略
- 生产中的能源效率
- 环保倡议
- 考虑到碳足迹
第四章 竞争情势
- 介绍
- 公司市占率分析
- 按地区
- 北美洲
- 欧洲
- 亚太地区
- 拉丁美洲
- 中东和非洲
- 按地区
- 企业矩阵分析
- 主要市场公司的竞争分析
- 竞争定位矩阵
- 重大进展
- 併购
- 伙伴关係与合作
- 新产品发布
- 业务拓展计划
第五章 依产品类型分類的市场估算与预测,2022-2035年
- 酪蛋白产品
- 酸性酪蛋白
- 凝乳酶酪蛋白
- 酪蛋白酸钠
- 酪蛋白酸钙
- 胶束酪蛋白
- 乳清蛋白产品
- 乳清蛋白浓缩物(WPC)
- 乳清蛋白隔离群(WPI) - 蛋白质含量 90% 以上
- 乳清蛋白水解物(WPH)
- 天然乳清蛋白
- 乳蛋白质浓缩物和分离物
- 乳蛋白质浓缩物(MPC 40-85%)
- 乳蛋白质分离物(MPI 85-90%)
- 全脂乳蛋白质
- 特殊蛋白质产品
- 生物活性蛋白(乳铁蛋白、免疫球蛋白)
- 水解乳蛋白质
- 有机乳蛋白质
第六章 按类型分類的市场估算与预测,2022-2035年
- 干粉状
- 液态/浓缩态
- 特殊形式
- 蛋白质脆片和挤压製品
- 微囊化蛋白质
- 即食混合料
7. 按蛋白质含量等级分類的市场估算与预测,2022-2035 年
- 低蛋白含量(25-40%蛋白质)
- 中等蛋白质含量(40-70%)
- 高蛋白(70-85%)
- 蛋白质含量极高(超过 85%)
第八章 按应用领域分類的市场估算与预测,2022-2035年
- 饮食
- 营养补充品
- 运动营养
- 婴儿奶粉
- 临床营养
- 化妆品和个人护理
- 动物营养
9. 2022-2035年按分销管道分類的市场估算与预测
- B2B 直销(原料供应)
- B2C零售通路
- 专卖店和健康食品零售商
- 超级市场和大卖场
- 便利商店
- 线上/电子商务管道
- 品牌官方网站
- 线上市场(亚马逊、阿里巴巴)
- 订阅模式
- 餐饮业通路
- 餐厅和快餐店
- 咖啡馆/果汁吧
- 机构餐饮服务
- 药局和医疗机构的管道
- 医院药房
- 零售药房
- 医用营养食品批发商
第十章 2022-2035年各地区市场估计与预测
- 北美洲
- 美国
- 加拿大
- 欧洲
- 德国
- 英国
- 法国
- 西班牙
- 义大利
- 其他欧洲地区
- 亚太地区
- 中国
- 印度
- 日本
- 澳洲
- 韩国
- 亚太其他地区
- 拉丁美洲
- 巴西
- 墨西哥
- 阿根廷
- 其他拉丁美洲地区
- 中东和非洲
- 沙乌地阿拉伯
- 南非
- 阿拉伯聯合大公国
- 其他中东和非洲地区
第十一章:公司简介
- Fonterra Co-operative Group Limited
- Glanbia plc
- Lactalis Ingredients
- Kerry Group plc
- Saputo Inc.
- Arla Foods amba
- Royal FrieslandCampina NV
- Nestle SA(Nutrition &Health Science)
- Hilmar Ingredients
- Milk Specialties Global
- Agropur Cooperative
- Carbery Group
- Glanbia Performance Nutrition(Optimum Nutrition Brand)
- Idaho Milk Products
- Arla Foods Ingredients Group P/S
The Global Milk Protein Market was valued at USD 23.9 billion in 2025 and is estimated to grow at a CAGR of 5.6% to reach USD 42.1 billion by 2035.
Milk protein remains a foundational ingredient due to its strong nutritional profile and functional performance, making it widely valued across nutrition-driven product categories. Rising consumer focus on balanced diets, active lifestyles, and overall wellness has significantly increased interest in protein-enriched foods and beverages. This shift has positioned milk protein as a preferred ingredient for manufacturers seeking both nutritional value and functional performance. Beyond its dietary benefits, milk protein supports formulation efficiency by enhancing texture, consistency, and product stability. Growing preference for clean-label and naturally sourced ingredients has further strengthened consumer trust in milk-derived proteins. At the same time, ongoing advancements in processing technologies have enabled improved filtration and separation methods, resulting in higher-quality products with better absorption and usability. These improvements allow producers to tailor milk protein solutions to meet evolving nutritional expectations and specific health-focused consumption patterns.
| Market Scope | |
|---|---|
| Start Year | 2025 |
| Forecast Year | 2026-2035 |
| Start Value | $23.9 Billion |
| Forecast Value | $42.1 Billion |
| CAGR | 5.6% |
The dry or powder form segment accounted for 85.3% share in 2025 and is projected to grow at a CAGR of 6.3% from 2026 to 2035. This format is widely adopted due to its long shelf life, ease of transportation, and adaptability across a broad range of food and nutrition applications. Its stability and formulation flexibility continue to make it a preferred option for large-scale manufacturing.
Demand for liquid and concentrated milk protein formats is steadily increasing, particularly where smooth texture and rapid solubility are prioritized. These formats are gaining stronger acceptance across beverage and dairy-based formulations as consumer demand for convenience-driven nutrition rises.
Milk proteins with medium concentration levels ranging from 40% to 70% captured 35.7% share in 2025 and is anticipated to grow at a CAGR of 5.4% through 2035. This category remains attractive due to its balance between cost efficiency and functional performance, supporting widespread adoption across nutrition-focused product lines.
North America Milk Protein Market held a 32% share in 2025. The region benefits from strong consumer interest in protein-rich, minimally processed products and from well-established manufacturing infrastructure. A deeply rooted wellness culture continues to drive innovation across nutrition-oriented food and beverage segments.
Key companies operating in the Milk Protein Market include Kerry Group plc, Arla Foods Ingredients Group P/S, Royal FrieslandCampina N.V., Glanbia plc, Hilmar Ingredients, Nestle S.A. (Nutrition & Health Science), Agropur Cooperative, Lactalis Ingredients, Idaho Milk Products, Saputo Inc., Milk Specialties Global, Fonterra Co-operative Group Limited, Carbery Group, Arla Foods amba, and Glanbia Performance Nutrition under the Optimum Nutrition brand. Companies in the Milk Protein Market are reinforcing their market position through innovation, capacity expansion, and portfolio diversification. Many players are investing in advanced processing technologies to enhance product purity, consistency, and functional performance. Strategic partnerships with food and beverage manufacturers are being used to expand application reach and accelerate product adoption.
Table of Contents
Chapter 1 Methodology & Scope
- 1.1 Market scope and definition
- 1.2 Research design
- 1.2.1 Research approach
- 1.2.2 Data collection methods
- 1.3 Data mining sources
- 1.3.1 Global
- 1.3.2 Regional/Country
- 1.4 Base estimates and calculations
- 1.4.1 Base year calculation
- 1.4.2 Key trends for market estimation
- 1.5 Primary research and validation
- 1.5.1 Primary sources
- 1.6 Forecast model
- 1.7 Research assumptions and limitations
Chapter 2 Executive Summary
- 2.1 Industry 360° synopsis
- 2.2 Key market trends
- 2.2.1 Regional
- 2.2.2 Product Type
- 2.2.3 Form
- 2.2.4 Protein Content Level
- 2.2.5 Application
- 2.2.6 Distribution Channel
- 2.3 TAM Analysis, 2025-2035
- 2.4 CXO perspectives: Strategic imperatives
- 2.4.1 Executive decision points
- 2.4.2 Critical success factors
- 2.5 Future Outlook and Strategic Recommendations
Chapter 3 Industry Insights
- 3.1 Industry ecosystem analysis
- 3.1.1 Supplier landscape
- 3.1.2 Profit margin
- 3.1.3 Value addition at each stage
- 3.1.4 Factor affecting the value chain
- 3.1.5 Disruptions
- 3.2 Industry impact forces
- 3.2.1 Growth drivers
- 3.2.1.1 Rising health & wellness consciousness
- 3.2.1.2 Growing sports & active nutrition market
- 3.2.1.3 Increasing protein fortification in foods
- 3.2.2 Industry pitfalls and challenges
- 3.2.2.1 Raw milk price volatility
- 3.2.2.2 Lactose intolerance & dairy allergies
- 3.2.3 Market opportunities
- 3.2.3.1 Bioactive protein applications expansion
- 3.2.3.2 Personalized nutrition product development
- 3.2.1 Growth drivers
- 3.3 Growth potential analysis
- 3.4 Regulatory landscape
- 3.4.1 North America
- 3.4.2 Europe
- 3.4.3 Asia Pacific
- 3.4.4 Latin America
- 3.4.5 Middle East & Africa
- 3.5 Porter's analysis
- 3.6 PESTEL analysis
- 3.7 Price trends
- 3.7.1 By region
- 3.7.2 By product type
- 3.8 Future market trends
- 3.9 Technology and Innovation landscape
- 3.9.1 Current technological trends
- 3.9.2 Emerging technologies
- 3.10 Patent Landscape
- 3.11 Trade statistics (HS code)
( Note: The trade statistics will be provided for key countries only)
- 3.11.1 Major importing countries
- 3.11.2 Major exporting countries
- 3.12 Sustainability and environmental aspects
- 3.12.1 Sustainable practices
- 3.12.2 Waste reduction strategies
- 3.12.3 Energy efficiency in production
- 3.12.4 Eco-friendly initiatives
- 3.13 Carbon footprint consideration
Chapter 4 Competitive Landscape, 2025
- 4.1 Introduction
- 4.2 Company market share analysis
- 4.2.1 By region
- 4.2.1.1 North America
- 4.2.1.2 Europe
- 4.2.1.3 Asia Pacific
- 4.2.1.4 LATAM
- 4.2.1.5 MEA
- 4.2.1 By region
- 4.3 Company matrix analysis
- 4.4 Competitive analysis of major market players
- 4.5 Competitive positioning matrix
- 4.6 Key developments
- 4.6.1 Mergers & acquisitions
- 4.6.2 Partnerships & collaborations
- 4.6.3 New Product Launches
- 4.6.4 Expansion Plans
Chapter 5 Market Estimates and Forecast, By Product Type, 2022-2035 (USD Billion) (Kilo Tons)
- 5.1 Key trends
- 5.2 Casein products
- 5.2.1 Acid casein
- 5.2.2 Rennet casein
- 5.2.3 Sodium caseinate
- 5.2.4 Calcium caseinate
- 5.2.5 Micellar casein
- 5.3 Whey protein products
- 5.3.1 Whey protein concentrate (WPC)
- 5.3.2 Whey protein isolate (WPI) - >90% protein
- 5.3.3 Whey protein hydrolysate (WPH)
- 5.3.4 Native whey protein
- 5.4 Milk protein concentrates & isolates
- 5.4.1 Milk protein concentrate (MPC 40-85%)
- 5.4.2 Milk protein isolate (MPI 85-90%)
- 5.4.3 Total milk protein
- 5.5 Specialty protein products
- 5.5.1 Bioactive proteins (lactoferrin, immunoglobulins)
- 5.5.2 Hydrolyzed milk proteins
- 5.5.3 Organic milk proteins
Chapter 6 Market Estimates and Forecast, By Form, 2022-2035 (USD Billion) (Kilo Tons)
- 6.1 Key trends
- 6.2 Dry/powder form
- 6.3 Liquid/concentrated form
- 6.4 Specialty forms
- 6.4.1 Protein crisps & extrudates
- 6.4.2 Micro-encapsulated proteins
- 6.4.3 Ready-to-mix blends
Chapter 7 Market Estimates and Forecast, By Protein Content Level, 2022-2035 (USD Billion) (Kilo Tons)
- 7.1 Key trends
- 7.2 Low Protein Content (25-40% Protein)
- 7.3 Medium Protein (40-70%)
- 7.4 High Protein (70-85%)
- 7.5 Ultra-High Protein (>85%)
Chapter 8 Market Estimates and Forecast, By Application, 2022-2035 (USD Billion) (Kilo Tons)
- 8.1 Key trends
- 8.2 Food & Beverages
- 8.3 Dietary Supplements
- 8.4 Sports Nutrition
- 8.5 Infant Formula
- 8.6 Clinical Nutrition
- 8.7 Cosmetics & Personal Care
- 8.8 Animal Nutrition
Chapter 9 Market Estimates and Forecast, By Distribution Channel, 2022-2035 (USD Billion) (Kilo Tons)
- 9.1 Key trends
- 9.2 B2B direct sales (ingredient supply)
- 9.3 B2C retail channels
- 9.3.1 Specialty stores & health food retailers
- 9.3.2 Supermarkets & hypermarkets
- 9.3.3 Convenience stores
- 9.4 Online/e-commerce channels
- 9.4.1 Brand direct websites
- 9.4.2 Online marketplaces (amazon, Alibaba)
- 9.4.3 Subscription models
- 9.5 Food service channels
- 9.5.1 Restaurants & quick service
- 9.5.2 Cafes & juice bars
- 9.5.3 Institutional food service
- 9.6 Pharmacy & medical channels
- 9.6.1 Hospital pharmacies
- 9.6.2 Retail pharmacies
- 9.6.3 Medical nutrition distributors
Chapter 10 Market Estimates and Forecast, By Region, 2022-2035 (USD Billion) (Kilo Tons)
- 10.1 Key trends
- 10.2 North America
- 10.2.1 U.S.
- 10.2.2 Canada
- 10.3 Europe
- 10.3.1 Germany
- 10.3.2 UK
- 10.3.3 France
- 10.3.4 Spain
- 10.3.5 Italy
- 10.3.6 Rest of Europe
- 10.4 Asia Pacific
- 10.4.1 China
- 10.4.2 India
- 10.4.3 Japan
- 10.4.4 Australia
- 10.4.5 South Korea
- 10.4.6 Rest of Asia Pacific
- 10.5 Latin America
- 10.5.1 Brazil
- 10.5.2 Mexico
- 10.5.3 Argentina
- 10.5.4 Rest of Latin America
- 10.6 Middle East and Africa
- 10.6.1 Saudi Arabia
- 10.6.2 South Africa
- 10.6.3 UAE
- 10.6.4 Rest of Middle East and Africa
Chapter 11 Company Profiles
- 11.1 Fonterra Co-operative Group Limited
- 11.2 Glanbia plc
- 11.3 Lactalis Ingredients
- 11.4 Kerry Group plc
- 11.5 Saputo Inc.
- 11.6 Arla Foods amba
- 11.7 Royal FrieslandCampina N.V.
- 11.8 Nestle S.A. (Nutrition & Health Science)
- 11.9 Hilmar Ingredients
- 11.10 Milk Specialties Global
- 11.11 Agropur Cooperative
- 11.12 Carbery Group
- 11.13 Glanbia Performance Nutrition (Optimum Nutrition Brand)
- 11.14 Idaho Milk Products
- 11.15 Arla Foods Ingredients Group P/S
 乳蛋白质市场-全球产业规模、份额、趋势、机会和预测:按类型、畜牧业、形态、用途、功能、加工方法、地区和竞争格局划分,2021-2031年
 全球乳蛋白质市场:预测(2025-2030 年)
 全球乳蛋白质市场