


 |
市场调查报告书
商品编码
1913358
虚拟製作市场机会、成长要素、产业趋势分析及2026年至2035年预测Virtual Production Market Opportunity, Growth Drivers, Industry Trend Analysis, and Forecast 2026 - 2035 |
||||||
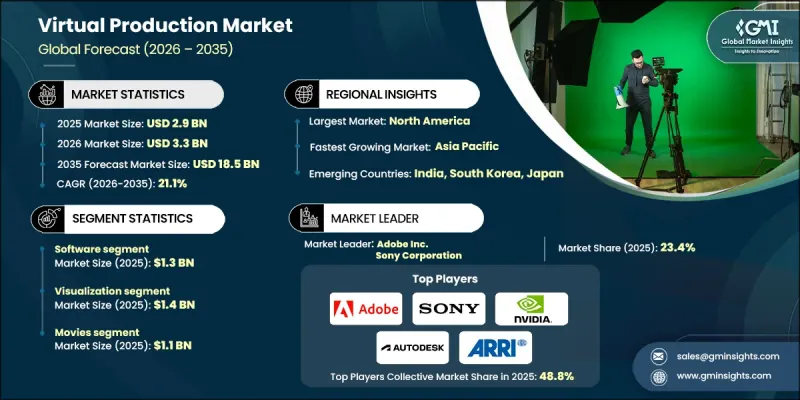
全球虚拟製作市场预计到 2025 年将达到 29 亿美元,到 2035 年将达到 185 亿美元,年复合成长率为 21.1%。
推动市场成长的因素包括:电影製作中视觉特效(VFX)的日益普及、广告中虚拟技术的广泛应用,以及虚拟製作工作室中LED幕墙LED幕墙技术正在改变整个产业,使工作室能够即时动态调整逼真的数位环境,从而无需建造大规模实体布景和多个拍摄地点。这项创新从根本上改变了内容製作的速度和扩充性,提高了创造性柔软性,大幅缩短了製作时间和成本,并使电影製作人能够高效地创建庞大而沉浸式的世界。
| 市场覆盖范围 | |
|---|---|
| 开始年份 | 2025 |
| 预测年份 | 2026-2035 |
| 起始值 | 29亿美元 |
| 预测金额 | 185亿美元 |
| 复合年增长率 | 21.1% |
预计到2025年,软体产业的收入将达到13亿美元。这一成长主要得益于对高级视觉特效工具、即时渲染解决方案和人工智慧驱动的软体应用日益增长的需求。为了满足不断增长的需求,各公司正致力于改进即时渲染技术、提高人工智慧自动化程度,并为娱乐、游戏和广告产业开发可扩展的软体解决方案。
预计从 2026 年到 2035 年,全实时LED幕墙市场将以 25.3% 的复合年增长率成长。虚拟製作中对沉浸式、可变背景的需求不断增长,推动了这一增长,因为全实时LED幕墙可以提供逼真且适应性强的环境,同时降低与实体布景相关的成本和时间。
受美国蓬勃发展的娱乐产业、技术普及以及电影、游戏和广告业对创新解决方案的需求所推动,预计到2025年,美国虚拟製作市场规模将达到9.914亿美元。各公司正致力于推广虚拟製作技术、增强视觉特效能力并优化服务,以满足美国市场的特定需求。
目录
第一章调查方法和范围
第二章执行摘要
第三章业界考察
- 生态系分析
- 供应商情况
- 利润率
- 成本结构
- 每个阶段的附加价值
- 影响价值链的因素
- 中断
- 生态系分析
- 产业影响因素
- 司机
- 电影製作公司对视觉特效(VFX)的需求不断成长
- 拓展虚拟製作在商业广告中的应用
- LED幕墙技术的应用日益普及
- 人工智慧在虚拟生产的应用日益广泛
- 游戏产业对虚拟製作的需求日益增长
- 挑战与困难
- 熟练专业人员短缺
- 高资本支出和初始设定成本
- 市场机会
- 即时渲染技术的进步
- 电视和串流媒体领域虚拟製作的兴起
- 司机
- 成长潜力分析
- 监管环境
- 北美洲
- 欧洲
- 亚太地区
- 拉丁美洲
- 中东和非洲
- 波特五力分析
- PESTEL 分析
- 科技与创新趋势
- 当前技术趋势
- 新兴技术
- 新兴经营模式
- 合规要求
- 永续性措施
- 消费者心理分析
- 专利和智慧财产权分析
- 地缘政治和贸易趋势
第四章 竞争情势
- 介绍
- 公司市占率分析
- 按地区
- 北美洲
- 欧洲
- 亚太地区
- 拉丁美洲
- 中东和非洲
- 市场集中度分析
- 按地区
- 主要企业的竞争标竿分析
- 财务绩效比较
- 收入
- 利润率
- 研究与开发
- 产品系列比较
- 产品线的广度
- 科技
- 创新
- 地理分布比较
- 全球扩张分析
- 服务网路覆盖
- 按地区分類的市场渗透率
- 竞争定位矩阵
- 领导企业
- 受让人
- 追踪者
- 小众玩家
- 战略展望矩阵
- 财务绩效比较
- 2021-2024 年主要发展动态
- 併购
- 伙伴关係与合作
- 技术进步
- 扩张与投资策略
- 永续发展倡议
- 数位转型计划
- 新兴/Start-Ups竞赛的趋势
第五章 按组件分類的市场估算与预测,2022-2035年
- 硬体
- 软体
- 服务
第六章 按类型分類的市场估算与预测,2022-2035年
- 视觉化
- Pitchvis
- 普雷维斯
- 虚拟球探
- 技术视觉化
- 特技演员
- Postvis
- 绩效捕捉
- 混合绿幕直播
- 全LED幕墙
7. 依最终用途分類的市场估计与预测,2022-2035 年
- 电影
- 电视剧
- 商业广告
- 线上影片
- podcast室
- 新闻广播
- 体育和娱乐节目
- 娱乐节目
- 天气及交通工作室
- 政治和金融说明
- 实况活动直播
- 教育及公共服务频道
- 其他的
第八章 2022-2035年各地区市场估算与预测
- 北美洲
- 美国
- 加拿大
- 欧洲
- 德国
- 英国
- 法国
- 西班牙
- 义大利
- 荷兰
- 亚太地区
- 中国
- 印度
- 日本
- 澳洲
- 韩国
- 拉丁美洲
- 巴西
- 墨西哥
- 阿根廷
- 中东和非洲
- 沙乌地阿拉伯
- 南非
- 阿拉伯聯合大公国
第九章:公司简介
- 主要企业
- Adobe Inc.
- Sony Corporation
- NVIDIA Corporation
- Epic Games Inc.
- 按地区分類的主要企业
- 北美洲
- Autodesk Inc.
- FuseFX
- Mo-Sys Engineering Ltd.
- 欧洲
- ARRI AG
- BORIS FX, INC
- Asia-Pacific
- HTC Corporation
- Insta360
- 北美洲
- 颠覆者/小众玩家
- Pixotope
The Global Virtual Production Market was valued at USD 2.9 billion in 2025 and is estimated to grow at a CAGR of 21.1% to reach USD 18.5 billion by 2035.
The market is being propelled by the rising adoption of VFX in film production, increased use of virtual technologies in commercials, and the growing integration of LED wall technology in virtual production studios. AI-driven content creation within virtual environments and the demand for gaming content are further accelerating growth. The industry is being reshaped by LED wall technology, allowing studios to create photorealistic digital environments that can be dynamically adjusted in real time, eliminating the need for extensive physical sets or multiple shooting locations. This innovation enhances creative flexibility, dramatically reduces production time and costs, and allows filmmakers to produce vast, immersive worlds with greater efficiency, fundamentally transforming the speed and scalability of content creation.
| Market Scope | |
|---|---|
| Start Year | 2025 |
| Forecast Year | 2026-2035 |
| Start Value | $2.9 Billion |
| Forecast Value | $18.5 Billion |
| CAGR | 21.1% |
The software segment generated USD 1.3 billion in 2025. Growth is fueled by the rising demand for advanced VFX tools, real-time rendering solutions, and AI-enabled software applications. Firms are focusing on delivering improved real-time rendering, enhancing automation with AI, and developing scalable software solutions for the entertainment, gaming, and advertising sectors to meet growing demand.
The full live LED wall segment is expected to grow at a CAGR of 25.3% during 2026-2035. The rising need for immersive, changeable backgrounds in virtual productions is driving this growth, as full live LED walls eliminate the costs and time associated with physical sets while providing realistic, adaptable environments.
U.S. Virtual Production Market reached USD 991.4 million in 2025, driven by the country's thriving entertainment industry, technology adoption, and demand for innovative solutions in film, gaming, and advertising. Companies are concentrating on advancing virtual production technologies, enhancing VFX capabilities, and tailoring offerings to meet specific needs within the U.S. market.
Key players in the Global Virtual Production Market include Adobe Inc., Sony Corporation, NVIDIA Corporation, Autodesk Inc., ARRI AG, Epic Games Inc., FuseFX, HTC Corporation, Insta360, Pixotope, BORIS FX, Inc., and Mo-Sys Engineering Ltd. To strengthen their market position, companies in the Global Virtual Production Market focus on continuous innovation in AI-enhanced VFX, real-time rendering, and LED wall technologies. They invest in R&D to create scalable, efficient solutions that reduce production time and costs while enhancing creative flexibility. Strategic collaborations with studios, gaming companies, and advertising agencies expand their client base, while acquisitions of niche technology providers enable access to complementary expertise. Firms also prioritize expanding regional presence, offering tailored solutions, and providing robust customer support to build long-term partnerships and solidify their competitive edge in an evolving global market.
Table of Contents
Chapter 1 Methodology and scope
- 1.1 Market scope and definition
- 1.2 Research design
- 1.2.1 Research approach
- 1.2.2 Data collection methods
- 1.3 Data mining sources
- 1.3.1 Global
- 1.3.2 Regional/Country
- 1.4 Base estimates and calculations
- 1.4.1 Base year calculation
- 1.4.2 Key trends for market estimation
- 1.5 Primary research and validation
- 1.5.1 Primary sources
- 1.6 Forecast model
- 1.7 Research assumptions and limitations
Chapter 2 Executive summary
- 2.1 Industry 3600 synopsis
- 2.2 Key market trends
- 2.2.1 Component trend
- 2.2.2 Type trends
- 2.2.3 End use trends
- 2.2.4 Regional trends
- 2.3 TAM Analysis, 2026-2035 (USD Million)
- 2.4 CXO perspectives: Strategic imperatives
- 2.4.1 Executive decision points
- 2.4.2 critical success factors
- 2.5 Future outlook and strategic recommendations
Chapter 3 Industry insights
- 3.1 Industry ecosystem analysis
- 3.1.1 Supplier landscape
- 3.1.2 Profit margin
- 3.1.3 Cost structure
- 3.1.4 Value addition at each stage
- 3.1.5 Factor affecting the value chain
- 3.1.6 Disruptions
- 3.2 Industry ecosystem analysis
- 3.3 Industry impact forces
- 3.3.1 Growth drivers
- 3.3.1.1 Increasing demand for visual effects (VFX) in movie production studios
- 3.3.1.2 Rising applications of virtual production in commercial ads
- 3.3.1.3 Growing Implementation of LED wall technology
- 3.3.1.4 Growing implementation of AI in virtual production
- 3.3.1.5 Growing demand for virtual production in gaming
- 3.3.2 Pitfalls and challenges
- 3.3.2.1 Lack of skilled professionals
- 3.3.2.2 High capital expenditure and initial setup
- 3.3.3 Market opportunities
- 3.3.3.1 Advancements in real-time rendering technology
- 3.3.3.2 Expansion of virtual production in TV and streaming
- 3.3.1 Growth drivers
- 3.4 Growth potential analysis
- 3.5 Regulatory landscape
- 3.5.1 North America
- 3.5.2 Europe
- 3.5.3 Asia Pacific
- 3.5.4 Latin America
- 3.5.5 Middle East & Africa
- 3.6 Porter's analysis
- 3.7 PESTEL analysis
- 3.8 Technology and Innovation landscape
- 3.8.1 Current technological trends
- 3.8.2 Emerging technologies
- 3.9 Emerging Business Models
- 3.10 Compliance Requirements
- 3.11 Sustainability Measures
- 3.12 Consumer Sentiment Analysis
- 3.13 Patent and IP analysis
- 3.14 Geopolitical and trade dynamics
Chapter 4 Competitive landscape, 2025
- 4.1 Introduction
- 4.2 Company market share analysis
- 4.2.1 By region
- 4.2.1.1 North America
- 4.2.1.2 Europe
- 4.2.1.3 Asia Pacific
- 4.2.1.4 Latin America
- 4.2.1.5 Middle East & Africa
- 4.2.2 Market concentration analysis
- 4.2.1 By region
- 4.3 Competitive benchmarking of key players
- 4.3.1 Financial performance comparison
- 4.3.1.1 Revenue
- 4.3.1.2 Profit margin
- 4.3.1.3 R&D
- 4.3.2 Product portfolio comparison
- 4.3.2.1 Product range breadth
- 4.3.2.2 Technology
- 4.3.2.3 Innovation
- 4.3.3 Geographic presence comparison
- 4.3.3.1 Global footprint analysis
- 4.3.3.2 Service network coverage
- 4.3.3.3 Market penetration by region
- 4.3.4 Competitive positioning matrix
- 4.3.4.1 Leaders
- 4.3.4.2 Challengers
- 4.3.4.3 Followers
- 4.3.4.4 Niche players
- 4.3.5 Strategic outlook matrix
- 4.3.1 Financial performance comparison
- 4.4 Key developments, 2021-2024
- 4.4.1 Mergers and acquisitions
- 4.4.2 Partnerships and collaborations
- 4.4.3 Technological advancements
- 4.4.4 Expansion and investment strategies
- 4.4.5 Sustainability initiatives
- 4.4.6 Digital transformation initiatives
- 4.5 Emerging/ startup competitors landscape
Chapter 5 Market estimates and forecast, by Component, 2022 - 2035 (USD Billion)
- 5.1 Key trends
- 5.2 Hardware
- 5.3 Software
- 5.4 Services
Chapter 6 Market estimates and forecast, by Type, 2022 - 2035 (USD Million)
- 6.1 Key trends
- 6.2 Visualization
- 6.2.1 Pitchvis
- 6.2.2 Previs
- 6.2.3 Virtual scouting
- 6.2.4 Techvis
- 6.2.5 Stuntvis
- 6.2.6 Postvis
- 6.3 Performance capture
- 6.4 Hybrid Green Screen Live
- 6.5 Full Live LED Wall
Chapter 7 Market estimates and forecast, by End Use, 2022 - 2035 (USD Million)
- 7.1 Key trends
- 7.2 Movies
- 7.3 TV series
- 7.4 Commercial ads
- 7.5 Online videos
- 7.6 Broadcasting studios
- 7.6.1 News broadcasting
- 7.6.2 Sports broadcasting entertainment shows
- 7.6.3 Entertainment shows
- 7.6.4 Weather & traffic studios
- 7.6.5 Political & financial commentary
- 7.6.6 Live event broadcasting
- 7.6.7 Education & public service channels
- 7.7 Others
Chapter 8 Market estimates and forecast, by Region, 2022 - 2035 (USD Million)
- 8.1 Key trends
- 8.2 North America
- 8.2.1 U.S.
- 8.2.2 Canada
- 8.3 Europe
- 8.3.1 Germany
- 8.3.2 UK
- 8.3.3 France
- 8.3.4 Spain
- 8.3.5 Italy
- 8.3.6 Netherlands
- 8.4 Asia Pacific
- 8.4.1 China
- 8.4.2 India
- 8.4.3 Japan
- 8.4.4 Australia
- 8.4.5 South Korea
- 8.5 Latin America
- 8.5.1 Brazil
- 8.5.2 Mexico
- 8.5.3 Argentina
- 8.6 Middle East and Africa
- 8.6.1 Saudi Arabia
- 8.6.2 South Africa
- 8.6.3 UAE
Chapter 9 Company profiles
- 9.1 Global Key Players
- 9.1.1 Adobe Inc.
- 9.1.2 Sony Corporation
- 9.1.3 NVIDIA Corporation
- 9.1.4 Epic Games Inc.
- 9.2 Regional Key Players
- 9.2.1 North America
- 9.2.1.1 Autodesk Inc.
- 9.2.1.2 FuseFX
- 9.2.1.3 Mo-Sys Engineering Ltd.
- 9.2.2 Europe
- 9.2.2.1 ARRI AG
- 9.2.2.2 BORIS FX, INC
- 9.2.3 Asia-Pacific
- 9.2.3.1 HTC Corporation
- 9.2.3.2 Insta360
- 9.2.1 North America
- 9.3 Disruptors / Niche Players
- 9.3.1 Pixotope
 虚拟製作市场分析及预测(至2035年):依类型、产品类型、服务、技术、组件、应用、流程、最终用户、解决方案、阶段划分
 全球虚拟製作市场规模、份额、趋势和成长分析报告(2026-2034)虚拟製作市场规模、占有率、成长及全球产业分析:依类型、应用和地区划分的洞察与预测(2026-2034年)
 虚拟製作市场-全球产业规模、份额、趋势、机会及预测(依技术、组件、最终用户产业、地区及竞争格局划分,2021-2031年)
 全端视觉化服务市场:2026-2032年全球预测(按服务类型、应用程式、部署类型、最终用户和垂直产业划分)
 虚拟製作市场规模、份额和成长分析(按产品、类型、最终用户和地区划分)-2026-2033年产业预测
 虚拟製作市场规模、份额和趋势分析报告:按组件、类型、最终用途、地区和细分市场预测(2026-2033 年)
 全球虚拟製作市场(按产品、类型、最终用户和地区划分)- 预测至 2030 年虚拟製作市场按组件、内容时长、类型、摄影棚萤幕大小、部署类型和最终用户划分——2025-2030 年全球预测
 全球虚拟摄影棚市场:市场规模、份额、趋势分析(按公司规模、最终用途、组件、部署方法、应用和地区)、展望和预测(2025-2032 年)