


 |
市场调查报告书
商品编码
1810325
全球虚拟製作市场(按产品、类型、最终用户和地区划分)- 预测至 2030 年Virtual Production Market by Hardware, Software, Rental Services, Pre-production, Production, Post-production, Movies, Television Series, Commercial Advertisements, Online Videos, Events, Theatres, Music Concerts - Global Forecast to 2030 |
||||||
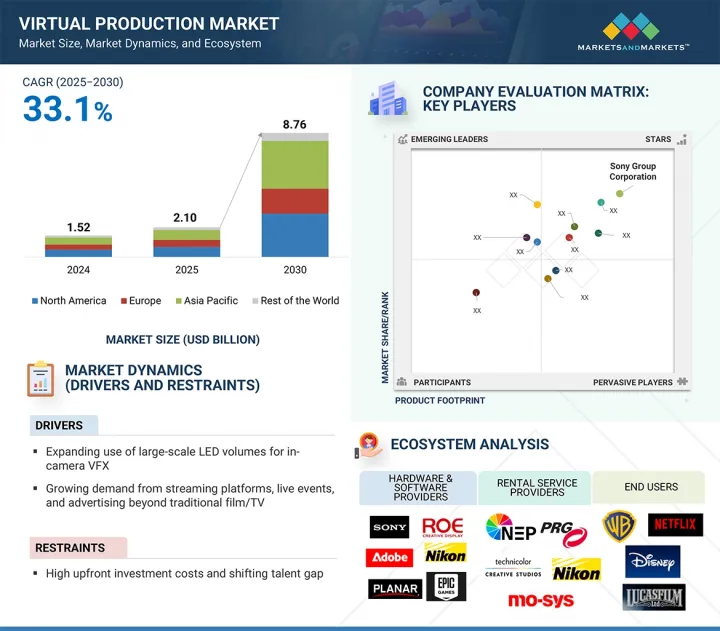
全球虚拟製作市场预计将从 2025 年的 21 亿美元成长到 2030 年的 87.6 亿美元,预测期内复合年增长率为 33.1%。
| 调查范围 | |
|---|---|
| 调查年份 | 2021-2030 |
| 基准年 | 2024 |
| 预测期 | 2025-2030 |
| 对价单位 | 金额(十亿美元) |
| 按细分市场 | 按产品、类型、最终用户和地区 |
| 目标区域 | 北美、欧洲、亚太地区和其他地区 |
虚拟製作市场蓬勃发展,得益于支援机内视觉特效 (ICVFX) 和提升现场效率的大型 LED 显示器的日益普及。串流媒体平台的需求不断增长,以及在现场活动、广告和音乐影片领域的应用不断拓展,虚拟製作的范围正在超越传统影视领域。此外,人工智慧即时渲染技术的进步正在改变创新工作流程,为监督和製片人在拍摄过程中提供更大的灵活性和更快的决策速度。这些因素正在加速虚拟製作在全球的普及。同时,企业故事叙事、教育和虚拟培训等新领域也涌现出巨大的机会,身临其境型且经济实惠的内容创作在这些领域中至关重要。云端基础工作流程的日益普及也支援远端协作,从而实现分散式製作模式,从而降低成本并扩大全球人才的获取管道。
虚拟製作市场中的前期製作环节预计将成为预测期内成长最快的环节。这一增长得益于内容创作中高级视觉化和规划工具的日益普及。虚拟製作使导演、製片人和创新团队能够使用即时3D引擎、虚拟摄影机和数位资产,准确地预先呈现复杂场景。这提升了创新的确定性,促进了地理位置分散的团队之间的协作,并透过在开拍前解决潜在问题来缩短製作週期。由于相关人员寻求在保持创新灵活性的同时降低成本,电影、连续剧和商业广告对高品质视觉叙事的需求正在推动其应用。此外,云端基础的前期製作工作流程以及用于资产创建和场景规划的人工智慧工具的成长,使得大型工作室和小型製作公司都更容易获得这些技术。由于串流平台要求更快的内容週转时间和更高的视觉质量,前期製作阶段已成为应用虚拟製作技术的关键阶段。这些因素使得前期製作领域成为一个高成长机会,使工作室能够在竞争日益激烈的媒体环境中平衡创造力、效率和成本节约。
预计在预测期内,电视剧将占据虚拟製作市场终端用户细分市场的第二大份额。全球串流媒体平台的兴起显着增加了对剧集内容的需求,迫使工作室在保持电影级品质的同时压缩製作进度。虚拟製作技术可协助电视台创造沉浸式环境、动态场景和即时视觉效果,而无需面对传统外景拍摄的后勤和财务挑战。 LED 显示器、预先视觉化和虚拟资产减少了重复勘察地点和搭建实体场景的需要。此外,在 Netflix、Disney+ 和 Amazon Prime 等平台争夺用户的竞争格局中,对视觉物流丰富、製作精良的剧集的投资正在增加。虚拟製作也提供了创新灵活性,使导演能够试验和改进视觉叙事,同时减少剧集之间的停播时间。电视剧因其能够高效地製作高品质的剧集内容而被定位为推动虚拟製作技术应用的关键驱动力。随着全球串流媒体观众的持续成长,电视剧很可能仍将是虚拟製作技术的关键使用案例,并迅速扩张。
预计到2025年,北美将占据虚拟製作市场的最大份额,这得益于该地区强大的娱乐产业、先进的技术基础设施以及顶级工作室的集中。好莱坞和美国主要的製作中心是虚拟製作的早期采用者,《曼达洛人》和《蝙蝠侠》等备受瞩目的计划展示了LED体积、即时渲染和混合工作流程的优势。该地区也受惠于Epic Games、NVIDIA和Planar等大型科技公司的存在,这些公司正在推动即时引擎、图形处理和显示解决方案的创新。此外,串流媒体服务和媒体集团的大量投资正在刺激对高品质沉浸式内容的需求。一些省份提供政府激励措施和税额扣抵,以进一步支持虚拟製作的采用,使製作公司能够将虚拟製作纳入其常规工作流程。加拿大的重要性也日益增强,温哥华和多伦多是影视内容的中心。完善的基础设施、熟练的劳动力和持续的投资使北美成为虚拟製作市场的关键地区,为采用和成长创新树立了标竿。
本报告研究了全球虚拟製作市场,按产品、类型、最终用户和地区进行细分,并分析了参与市场的公司。
目录
第一章 引言
第二章调查方法
第三章执行摘要
第四章重要考察
第五章 市场概况
- 介绍
- 市场动态
- 供应链分析
- 生态系分析
- 定价分析
- 影响客户业务的趋势和中断
- 技术分析
- 波特五力分析
- 主要相关人员和采购标准
- 案例研究分析
- 贸易分析
- 专利分析
- 2025-2026年主要会议和活动
- 关税和监管分析
- 人工智慧/生成式人工智慧对虚拟製作市场的影响
- 2025年美国关税将如何影响虚拟製作市场
6. 虚拟製作市场(依产品分类)
- 介绍
- 硬体
- 软体
- 租赁服务
第七章 虚拟製作市场(按类型)
- 介绍
- 前期製作
- 生产
- 后製
第 8 章:虚拟製作市场(依最终用户)
- 介绍
- 电影
- 电视剧
- 商业广告
- 线上影片
- 其他的
第九章:虚拟製作市场(按地区)
- 介绍
- 北美洲
- 北美宏观经济展望
- 美国
- 加拿大
- 墨西哥
- 欧洲
- 欧洲宏观经济展望
- 英国
- 德国
- 法国
- 其他的
- 亚太地区
- 亚太宏观经济展望
- 中国
- 日本
- 韩国
- 印度
- 其他的
- 其他地区
- 南美洲
- 中东和非洲
第十章 竞争格局
- 介绍
- 市场估值框架
- 2024年市场占有率分析
- 2020-2024年收益分析
- 公司估值矩阵:2024 年关键参与企业
- 竞争场景
第十一章:公司简介
- 主要参与企业
- SONY CORPORATION
- NEP GROUP, INC.
- NIKON CORPORATION
- ADOBE
- PRG
- ROE VISUAL
- AUTODESK INC.
- NVIDIA CORPORATION
- AOTO ELECTRONICS CO., LTD.
- EPIC GAMES
- 其他公司
- ARRI GMBH
- TECHNIOLOR GROUP
- HTC CORPORATION
- VICON MOTION SYSTEMS LTD.
- SIDEFX
- MO-SYS ENGINEERING LTD.
- PERFORCE
- DNEG
- TILTLABS
- PLANAR SYSTEMS, INC.
- VIRSABI
- DIMENSIONS
- FUSE
- RECODE XR STUDIO
- VU TECHNOLOGIES
- 80SIX GROUP LTD.
- BORIS FX
- INSTA360
- 360RIZE
- WETA FX
第十二章 附录
The global virtual production market is estimated to be valued at USD 8.76 billion by 2030, up from USD 2.10 billion in 2025, at a CAGR of 33.1% during the forecast period.
| Scope of the Report | |
|---|---|
| Years Considered for the Study | 2021-2030 |
| Base Year | 2024 |
| Forecast Period | 2025-2030 |
| Units Considered | Value (USD Billion) |
| Segments | By Offering, Type, End User, and Region |
| Regions covered | North America, Europe, APAC, RoW |
The virtual production market is growing rapidly, driven by the increasing use of large-scale LED volumes that support in-camera visual effects (ICVFX) and improve on-set filmmaking efficiency. The rising demand from streaming platforms, along with growing applications in live events, advertising, and music videos, is expanding its reach beyond traditional film and TV. Additionally, advances in AI-powered real-time rendering are changing creative workflows, providing directors and producers with more flexibility and quicker decision-making during shoots. These factors are collectively speeding up the adoption of virtual production worldwide. Simultaneously, there are strong opportunities in new areas like corporate storytelling, education, and virtual training, where immersive and affordable content creation is becoming more important. The increasing use of cloud-based workflows is also supporting remote collaboration, enabling decentralized production models that cut costs and widen access to talent worldwide.
"The pre-production segment is expected to register the fastest growth in the type segment of the market during the forecast period."
The pre-production segment is expected to grow the fastest in the virtual production market during the forecast period. This growth is driven by the increased use of advanced visualization and planning tools in content creation. Virtual production enables directors, producers, and creative teams to pre-visualize complex scenes accurately with real-time 3D engines, virtual cameras, and digital assets. This improves creative certainty, boosts collaboration among geographically dispersed teams, and shortens production cycles by addressing potential issues before filming starts. The demand for high-quality visual storytelling in films, episodic series, and commercials supports adoption, as stakeholders aim to lower costs while maintaining creative flexibility. Additionally, the growth of cloud-based pre-production workflows and AI tools for asset creation and scene planning makes these technologies more accessible for both large studios and smaller production companies. With streaming platforms demanding faster content turnaround and higher visual quality, the pre-production phase becomes a vital stage for applying virtual production technologies. These factors make the pre-production segment a high-growth opportunity, allowing studios to balance creativity, efficiency, and cost savings in an increasingly competitive media landscape environment.
"Television series is expected to account for the second largest segment of the end-user segment of the market during the forecast period."
Television series are expected to make up the second-largest share of the virtual production market's end-user segment during the forecast period. The rise of global streaming platforms has greatly increased demand for episodic content, prompting studios to speed up production timelines while maintaining cinematic quality. Virtual production technologies help television studios create immersive environments, dynamic sets, and real-time visual effects without the logistical and financial challenges of traditional location shoots. This is especially helpful for series with recurring settings or long story arcs, where LED volumes, pre-visualization, and virtual assets decrease the need for repeated location scouting and physical set building. Additionally, in the competitive streaming landscape-where platforms like Netflix, Disney+, and Amazon Prime vie for subscribers-increased investments are being made in visually rich series with high production value. Virtual production also offers creative flexibility, allowing directors to experiment and refine visual storytelling while reducing downtime between episodes. The ability to efficiently produce high-quality episodic content positions television series as a key driver for adoption. As streaming viewership continues to grow worldwide, television series are likely to remain a major and rapidly expanding use case for virtual production technologies.
"North America is expected to account for the largest market share in 2025."
North America is projected to hold the largest share of the virtual production market in 2025, thanks to the region's strong entertainment industry, advanced technological infrastructure, and concentration of top studios. Hollywood and major production centers in the US have been early users of virtual production, with high-profile projects like The Mandalorian and The Batman demonstrating the benefits of LED volumes, real-time rendering, and hybrid workflows. The region also benefits from the presence of leading technology companies, including Epic Games, NVIDIA, and Planar, which foster innovation in real-time engines, graphics processing, and display solutions. Additionally, heavy investment by streaming services and media conglomerates is increasing demand for high-quality, immersive content. Government incentives and tax credits in certain states further encourage adoption, allowing production companies to incorporate virtual production into regular workflows. Canada is also gaining importance, with Vancouver and Toronto acting as hubs for both film and TV content. The combination of established infrastructure, skilled workforce, and ongoing investment makes North America the leading region in the virtual production market, setting standards for other areas in adoption and growth innovation.
The break-up of the profile of primary participants in the virtual production market-
- By Company Type: Tier 1 - 45%, Tier 2 - 35%, Tier 3 - 30%
- By Designation Type: C Level - 32%, Director Level - 40%, Others - 28%
- By Region Type: Europe - 15%, North America - 40%, Asia Pacific - 37%, Rest of the World - 8%
Note: Other designations include sales, marketing, and product managers.
The three tiers of the companies are based on their total revenues as of 2024: Tier 1: >USD 1 billion, Tier 2: USD 500 million-1 billion, and Tier 3: USD 500 million
The major players in the virtual production market with a significant global presence include Sony Group Corporation (Japan), NEP Group, Inc. (US), Nikon Corporation (Japan), Adobe (US), PRG (US), and others.
Research Coverage
The report segments the virtual production market and forecasts its size based on offering, type, end user, and region. It also provides a comprehensive review of drivers, restraints, opportunities, and challenges affecting market growth. The report covers both qualitative and quantitative aspects market.
Reasons to buy the report:
The report will assist market leaders and new entrants by providing approximate revenue figures for the overall virtual production market and its related segments. It will help stakeholders understand the competitive landscape and gain insights to strengthen their market position and develop effective go-to-market strategies. Additionally, the report offers stakeholders a pulse on the market and information on key drivers, restraints, opportunities, and other relevant factors challenges.
The report provides insights into the following pointers:
- Analysis of key drivers (expanding use of large-scale LED volumes for in-camera VFX, growing demand from streaming platforms, live events, and advertising beyond traditional film and television, rising adoption of AI-driven real-time rendering.), restraints (high upfront investment costs, and shortage of skilled professionals), opportunities (expansion into corporate storytelling, education, and virtual training, rising adoption of cloud-based virtual production workflows enabling remote collaboration), and challenges (LED wall limitations in color accuracy and brightness, particularly for outdoor scene simulation, continue to impact production quality, interoperability issues between hardware, software, and rendering engines)
- Product Development/Innovation: Detailed insights on upcoming technologies, research & development activities, and new product launches in the virtual production market.
- Market Development: Comprehensive information about lucrative markets - the report analyses the virtual production market across varied regions.
- Market Diversification: Exhaustive information about new products, untapped geographies, recent developments, and investments in the virtual production market.
- Competitive Assessment: In-depth assessment of market shares, growth strategies, and product and service offerings of leading players, including Sony Group Corporation (Japan), NEP Group, Inc. (US), Nikon Corporation (Japan), Adobe (US), and PRG (US).
TABLE OF CONTENTS
1 INTRODUCTION
- 1.1 STUDY OBJECTIVES
- 1.2 MARKET DEFINITION
- 1.3 STUDY SCOPE
- 1.3.1 MARKET SEGMENTATION & REGIONAL SCOPE
- 1.3.2 INCLUSIONS & EXCLUSIONS
- 1.3.3 YEARS CONSIDERED
- 1.3.4 CURRENCY CONSIDERED
- 1.3.5 UNIT CONSIDERED
- 1.4 STAKEHOLDERS
- 1.5 SUMMARY OF CHANGES
2 RESEARCH METHODOLOGY
- 2.1 RESEARCH DATA
- 2.1.1 SECONDARY AND PRIMARY RESEARCH
- 2.1.2 SECONDARY DATA
- 2.1.2.1 List of key secondary sources
- 2.1.2.2 Key data from secondary sources
- 2.1.3 PRIMARY DATA
- 2.1.3.1 Breakdown of primaries
- 2.1.3.2 List of key primary interview participants
- 2.1.3.3 Key data from primary sources
- 2.1.3.4 Key industry insights
- 2.2 FACTOR ANALYSIS
- 2.2.1 SUPPLY-SIDE ANALYSIS
- 2.2.2 DEMAND-SIDE ANALYSIS
- 2.3 MARKET SIZE ESTIMATION
- 2.3.1 BOTTOM-UP APPROACH
- 2.3.2 TOP-DOWN APPROACH
- 2.3.3 GROWTH PROJECTIONS AND FORECAST ASSUMPTIONS
- 2.4 DATA TRIANGULATION
- 2.5 STUDY ASSUMPTIONS
- 2.6 RESEARCH LIMITATIONS
- 2.7 RISK ANALYSIS
3 EXECUTIVE SUMMARY
4 PREMIUM INSIGHTS
- 4.1 ATTRACTIVE GROWTH OPPORTUNITIES FOR MARKET PLAYERS
- 4.2 VIRTUAL PRODUCTION MARKET, BY OFFERING
- 4.3 VIRTUAL PRODUCTION MARKET, BY TYPE
- 4.4 VIRTUAL PRODUCTION MARKET, BY COUNTRY
- 4.5 VIRTUAL PRODUCTION MARKET, BY REGION
5 MARKET OVERVIEW
- 5.1 INTRODUCTION
- 5.2 MARKET DYNAMICS
- 5.2.1 DRIVERS
- 5.2.1.1 Expanding use of large-scale LED volumes for in-camera VFX
- 5.2.1.2 Growing demand from streaming platforms, live events, and advertising beyond traditional film/TV
- 5.2.1.3 Rising adoption of AI-driven real-time rendering
- 5.2.2 RESTRAINTS
- 5.2.2.1 High upfront investment costs and shifting talent gap
- 5.2.2.2 Limited pool of professionals skilled in advanced technologies
- 5.2.3 OPPORTUNITIES
- 5.2.3.1 Expansion into corporate storytelling, education, and virtual training
- 5.2.3.2 Adoption of cloud-based virtual production workflows for remote collaborations
- 5.2.4 CHALLENGES
- 5.2.4.1 Limitations in LED wall for outdoor scene simulation
- 5.2.4.2 Interoperability issues and lack of standardized protocols
- 5.2.1 DRIVERS
- 5.3 SUPPLY CHAIN ANALYSIS
- 5.4 ECOSYSTEM ANALYSIS
- 5.4.1 ROLE IN ECOSYSTEM
- 5.5 PRICING ANALYSIS
- 5.5.1 AVERAGE SELLING PRICE TREND OF HARDWARE, BY KEY PLAYER, 2021-2024
- 5.5.2 AVERAGE SELLING PRICE TREND OF HARDWARE, BY REGION, 2021-2024
- 5.6 TRENDS & DISRUPTIONS IMPACTING CUSTOMERS' BUSINESSES
- 5.6.1 REVENUE SHIFT AND NEW REVENUE POCKETS FOR MARKET PLAYERS
- 5.7 TECHNOLOGY ANALYSIS
- 5.7.1 KEY TECHNOLOGIES
- 5.7.1.1 Real-time rendering
- 5.7.1.2 LED displays
- 5.7.2 COMPLEMENTARY TECHNOLOGIES
- 5.7.2.1 Camera tracking
- 5.7.2.2 Motion capture
- 5.7.3 ADJACENT TECHNOLOGIES
- 5.7.3.1 Cloud rendering & remote collaboration
- 5.7.3.2 Artificial intelligence & machine learning
- 5.7.1 KEY TECHNOLOGIES
- 5.8 PORTER'S FIVE FORCES ANALYSIS
- 5.8.1 THREAT OF NEW ENTRANTS
- 5.8.2 THREAT OF SUBSTITUTES
- 5.8.3 BARGAINING POWER OF SUPPLIERS
- 5.8.4 BARGAINING POWER OF BUYERS
- 5.8.5 INTENSITY OF COMPETITIVE RIVALRY
- 5.9 KEY STAKEHOLDERS & BUYING CRITERIA
- 5.9.1 KEY STAKEHOLDERS IN BUYING PROCESS
- 5.9.2 KEY BUYING CRITERIA
- 5.10 CASE STUDY ANALYSIS
- 5.10.1 SUCCESSFUL IMPLEMENTATION OF MASSIVE LED VIRTUAL PRODUCTION BY ABSEN & VERSATILE
- 5.10.2 EFFECTIVE USE OF VIRTUAL PRODUCTION FOR STREAMING BMW BERLIN MARATHON
- 5.10.3 TRANSFORMATION OF LOCATION-BASED SHOOT TO VIRTUAL PRODUCTION STUDIO SHOOT
- 5.11 TRADE ANALYSIS
- 5.11.1 IMPORT DATA FOR HS CODE 900710, 2020-2024
- 5.11.2 EXPORT DATA FOR HS CODE 900710, 2020-2024
- 5.12 PATENT ANALYSIS
- 5.12.1 LIST OF MAJOR PATENTS
- 5.13 KEY CONFERENCES & EVENTS, 2025-2026
- 5.14 TARIFF & REGULATORY ANALYSIS
- 5.14.1 REGULATORY BODIES, GOVERNMENT AGENCIES, AND OTHER ORGANIZATIONS
- 5.14.2 TARIFFS, REGULATIONS, AND STANDARDS
- 5.14.2.1 Tariffs
- 5.14.2.2 Regulations
- 5.14.2.3 Standards
- 5.15 IMPACT OF AI/GEN AI ON VIRTUAL PRODUCTION MARKET
- 5.16 IMPACT OF 2025 US TARIFF ON VIRTUAL PRODUCTION MARKET
- 5.16.1 INTRODUCTION
- 5.16.2 KEY TARIFF RATES
- 5.16.3 PRICE IMPACT ANALYSIS
- 5.16.4 IMPACT ON COUNTRY/REGION
- 5.16.4.1 North America
- 5.16.4.1.1 US
- 5.16.4.2 Europe
- 5.16.4.3 Asia Pacific
- 5.16.4.1 North America
- 5.16.5 IMPACT ON END-USE INDUSTRIES
6 VIRTUAL PRODUCTION MARKET, BY OFFERING
- 6.1 INTRODUCTION
- 6.2 HARDWARE
- 6.2.1 ACCELERATING CONTENT INNOVATION THROUGH ADVANCED LED AND CAMERA ECOSYSTEMS TO AUGMENT MARKET GROWTH
- 6.3 SOFTWARE
- 6.3.1 POPULARITY OF SEAMLESS CGI INTEGRATION THROUGH INTELLIGENT SOFTWARE SOLUTIONS TO PROPEL MARKET GROWTH
- 6.4 RENTAL SERVICES
- 6.4.1 RENTAL SERVICES TO MAXIMIZE CAPITAL EFFICIENCY WITH ON-DEMAND VIRTUAL PRODUCTION ECOSYSTEMS
7 VIRTUAL PRODUCTION MARKET, BY TYPE
- 7.1 INTRODUCTION
- 7.2 PRE-PRODUCTION
- 7.2.1 BETTER TRANSFORMATION WITH PREDICTIVE VISUALIZATION TO DRIVE MARKET
- 7.3 PRODUCTION
- 7.3.1 INCREASED ACCESSIBILITY DURING PRODUCTION TO DRIVE WORKFLOW INTEGRATION AND CREATIVE PRECISION
- 7.4 POST-PRODUCTION
- 7.4.1 ACCELERATING CONTENT THROUGH REAL-TIME VIRTUAL POST-PRODUCTION WORKFLOWS TO AID GROWTH
8 VIRTUAL PRODUCTION MARKET, BY END USER
- 8.1 INTRODUCTION
- 8.2 MOVIES
- 8.2.1 INCREASED ADOPTION OF REAL-TIME VFX INTEGRATION FOR FILM PRODUCTION TO BOOST MARKET GROWTH
- 8.3 TELEVISION SERIES
- 8.3.1 TELEVISION SERIES TO ENABLE EFFICIENT AND HIGH-QUALITY PRODUCTION THROUGH VIRTUAL SETS
- 8.4 COMMERCIAL ADVERTISEMENTS
- 8.4.1 COMMERCIAL ADVERTISEMENTS TO USE VIRTUAL PRODUCTION TECHNOLOGIES FOR CREATIVE RESULTS AT LOWER BUDGETS
- 8.5 ONLINE VIDEOS
- 8.5.1 POPULARITY OF ON-DEMAND AND VISUALLY APPEALING CONTENT ACROSS OTT AND SOCIAL MEDIA PLATFORMS TO DRIVE MARKET
- 8.6 OTHER END USERS
9 VIRTUAL PRODUCTION MARKET, BY REGION
- 9.1 INTRODUCTION
- 9.2 NORTH AMERICA
- 9.2.1 MACROECONOMIC OUTLOOK FOR NORTH AMERICA
- 9.2.2 US
- 9.2.2.1 US to dominate North American virtual production market during forecast period
- 9.2.3 CANADA
- 9.2.3.1 Consistent demand for larger virtual production studios to spur market growth
- 9.2.4 MEXICO
- 9.2.4.1 Growing popularity of Mexican film and the television industry to boost market
- 9.3 EUROPE
- 9.3.1 MACROECONOMIC OUTLOOK FOR EUROPE
- 9.3.2 UK
- 9.3.2.1 Increased spending on film and high-end television production to propel market growth
- 9.3.3 GERMANY
- 9.3.3.1 Steady growth in German film industry with investments in advanced studio equipment to augment market growth
- 9.3.4 FRANCE
- 9.3.4.1 High investments in French cinema and increased film production to aid market growth
- 9.3.5 REST OF EUROPE
- 9.4 ASIA PACIFIC
- 9.4.1 MACROECONOMIC OUTLOOK FOR ASIA PACIFIC
- 9.4.2 CHINA
- 9.4.2.1 Extensive investments in advanced studio infrastructure and immersive production workflows to drive market
- 9.4.3 JAPAN
- 9.4.3.1 Presence of several top-tier virtual production stages to boost market growth
- 9.4.4 SOUTH KOREA
- 9.4.4.1 South Korea to accelerate focus on virtual production through advanced studios and strategic partnerships
- 9.4.5 INDIA
- 9.4.5.1 Increasing collaborations for new virtual production studios to boost market growth
- 9.4.6 REST OF ASIA PACIFIC
- 9.5 REST OF THE WORLD
- 9.5.1 SOUTH AMERICA
- 9.5.1.1 Expanding film industry and increasing demand for smart stages to boost adoption of virtual production
- 9.5.2 MIDDLE EAST & AFRICA
- 9.5.2.1 Technological innovation, strategic investments, and high demand for immersive content to drive market
- 9.5.1 SOUTH AMERICA
10 COMPETITIVE LANDSCAPE
- 10.1 INTRODUCTION
- 10.2 MARKET EVALUATION FRAMEWORK
- 10.2.1 PRODUCT PORTFOLIO
- 10.2.2 REGIONAL FOCUS
- 10.2.3 MANUFACTURING FOOTPRINT
- 10.2.4 ORGANIC/INORGANIC STRATEGIES
- 10.3 MARKET SHARE ANALYSIS, 2024
- 10.4 REVENUE ANALYSIS, 2020-2024
- 10.5 COMPANY EVALUATION MATRIX: KEY PLAYERS, 2024
- 10.5.1 STARS
- 10.5.2 EMERGING LEADERS
- 10.5.3 PERVASIVE PLAYERS
- 10.5.4 PARTICIPANTS
- 10.5.5 COMPANY FOOTPRINT: KEY PLAYERS, 2024
- 10.5.5.1 Company footprint
- 10.5.5.2 Region footprint
- 10.5.5.3 Offering footprint
- 10.5.5.4 End-user footprint
- 10.6 COMPETITIVE SCENARIO
- 10.6.1 PRODUCT LAUNCHES
- 10.6.2 DEALS
11 COMPANY PROFILES
- 11.1 KEY PLAYERS
- 11.1.1 SONY CORPORATION
- 11.1.1.1 Business overview
- 11.1.1.2 Products/Solutions/Services offered
- 11.1.1.3 Recent developments
- 11.1.1.3.1 Product launches
- 11.1.1.3.2 Deals
- 11.1.1.4 MnM view
- 11.1.1.4.1 Right to win
- 11.1.1.4.2 Strategic choices
- 11.1.1.4.3 Weaknesses & competitive threats
- 11.1.2 NEP GROUP, INC.
- 11.1.2.1 Business overview
- 11.1.2.2 Products/Solutions/Services offered
- 11.1.2.3 Recent developments
- 11.1.2.3.1 Product launches
- 11.1.2.3.2 Deals
- 11.1.2.4 MnM view
- 11.1.2.4.1 Right to win
- 11.1.2.4.2 Strategic choices
- 11.1.2.4.3 Weaknesses & competitive threats
- 11.1.3 NIKON CORPORATION
- 11.1.3.1 Business overview
- 11.1.3.2 Products/Solutions/Services offered
- 11.1.3.3 Recent developments
- 11.1.3.3.1 Product launches
- 11.1.3.3.2 Deals
- 11.1.3.4 MnM view
- 11.1.3.4.1 Right to win
- 11.1.3.4.2 Strategic choices
- 11.1.3.4.3 Weaknesses & competitive threats
- 11.1.4 ADOBE
- 11.1.4.1 Business overview
- 11.1.4.2 Products/Solutions/Services offered
- 11.1.4.3 Recent developments
- 11.1.4.3.1 Product launches
- 11.1.4.3.2 Deals
- 11.1.4.4 MnM view
- 11.1.4.4.1 Right to win
- 11.1.4.4.2 Strategic choices
- 11.1.4.4.3 Weaknesses & competitive threats
- 11.1.5 PRG
- 11.1.5.1 Business overview
- 11.1.5.2 Products/Solutions/Services offered
- 11.1.5.3 Recent developments
- 11.1.5.3.1 Product launches
- 11.1.5.3.2 Deals
- 11.1.5.4 MnM view
- 11.1.5.4.1 Right to win
- 11.1.5.4.2 Strategic choices
- 11.1.5.4.3 Weaknesses & competitive threats
- 11.1.6 ROE VISUAL
- 11.1.6.1 Business overview
- 11.1.6.2 Products/Solutions/Services offered
- 11.1.6.3 Recent developments
- 11.1.6.3.1 Product launches
- 11.1.6.3.2 Deals
- 11.1.7 AUTODESK INC.
- 11.1.7.1 Business overview
- 11.1.7.2 Products/Solutions/Services offered
- 11.1.7.3 Recent developments
- 11.1.7.3.1 Product launches
- 11.1.7.3.2 Deals
- 11.1.8 NVIDIA CORPORATION
- 11.1.8.1 Business overview
- 11.1.8.2 Products/Solutions/Services offered
- 11.1.8.3 Recent developments
- 11.1.8.3.1 Product launches and updates
- 11.1.8.3.2 Deals
- 11.1.9 AOTO ELECTRONICS CO., LTD.
- 11.1.9.1 Business overview
- 11.1.9.2 Products/Solutions/Services offered
- 11.1.9.3 Recent developments
- 11.1.9.3.1 Product launches
- 11.1.9.3.2 Deals
- 11.1.10 EPIC GAMES
- 11.1.10.1 Business overview
- 11.1.10.2 Products/Solutions/Services offered
- 11.1.10.3 Recent developments
- 11.1.10.3.1 Product launches and updates
- 11.1.10.3.2 Deals
- 11.1.1 SONY CORPORATION
- 11.2 OTHER PLAYERS
- 11.2.1 ARRI GMBH
- 11.2.2 TECHNIOLOR GROUP
- 11.2.3 HTC CORPORATION
- 11.2.4 VICON MOTION SYSTEMS LTD.
- 11.2.5 SIDEFX
- 11.2.6 MO-SYS ENGINEERING LTD.
- 11.2.7 PERFORCE
- 11.2.8 DNEG
- 11.2.9 TILTLABS
- 11.2.10 PLANAR SYSTEMS, INC.
- 11.2.11 VIRSABI
- 11.2.12 DIMENSIONS
- 11.2.13 FUSE
- 11.2.14 RECODE XR STUDIO
- 11.2.15 VU TECHNOLOGIES
- 11.2.16 80SIX GROUP LTD.
- 11.2.17 BORIS FX
- 11.2.18 INSTA360
- 11.2.19 360RIZE
- 11.2.20 WETA FX
12 APPENDIX
- 12.1 DISCUSSION GUIDE
- 12.2 KNOWLEDGESTORE: MARKETSANDMARKETS' SUBSCRIPTION PORTAL
- 12.3 CUSTOMIZATION OPTIONS
- 12.4 RELATED REPORTS
- 12.5 AUTHOR DETAILS
List of Tables
- TABLE 1 VIRTUAL PRODUCTION MARKET: INCLUSIONS & EXCLUSIONS
- TABLE 2 VIRTUAL PRODUCTION MARKET: LIST OF KEY SECONDARY SOURCES
- TABLE 3 VIRTUAL PRODUCTION MARKET: BREAKDOWN OF PRIMARIES
- TABLE 4 VIRTUAL PRODUCTION MARKET: LIST OF KEY PRIMARY INTERVIEW PARTICIPANTS
- TABLE 5 VIRTUAL PRODUCTION MARKET GROWTH ASSUMPTIONS
- TABLE 6 VIRTUAL PRODUCTION MARKET: STUDY ASSUMPTIONS
- TABLE 7 VIRTUAL PRODUCTION MARKET: RISK ANALYSIS
- TABLE 8 VIRTUAL PRODUCTION MARKET: ROLE IN ECOSYSTEM
- TABLE 9 AVERAGE SELLING PRICE TREND OF HARDWARE, BY KEY PLAYER, 2021-2024 (USD)
- TABLE 10 VIRTUAL PRODUCTION MARKET: PORTER'S FIVE FORCES
- TABLE 11 INFLUENCE OF KEY STAKEHOLDERS ON BUYING PROCESS FOR TOP THREE END USERS (%)
- TABLE 12 KEY BUYING CRITERIA FOR TOP THREE END USERS
- TABLE 13 IMPORT DATA FOR HS CODE 900710, BY COUNTRY, 2020-2024 (USD MILLION)
- TABLE 14 EXPORT DATA FOR HS CODE 900490, BY COUNTRY, 2020-2024 (USD MILLION)
- TABLE 15 LIST OF MAJOR PATENTS PERTAINING TO VIRTUAL PRODUCTION, 2023-2025
- TABLE 16 LIST OF KEY CONFERENCES & EVENTS IN VIRTUAL PRODUCTION MARKET, JANUARY 2025-DECEMBER 2026
- TABLE 17 NORTH AMERICA: REGULATORY BODIES, GOVERNMENT AGENCIES, AND OTHER ORGANIZATIONS
- TABLE 18 EUROPE: REGULATORY BODIES, GOVERNMENT AGENCIES, AND OTHER ORGANIZATIONS
- TABLE 19 ASIA PACIFIC: REGULATORY BODIES, GOVERNMENT AGENCIES, AND OTHER ORGANIZATIONS
- TABLE 20 REST OF THE WORLD: REGULATORY BODIES, GOVERNMENT AGENCIES, AND OTHER ORGANIZATIONS
- TABLE 21 US ADJUSTED RECIPROCAL TARIFF RATES, 2024
- TABLE 22 VIRTUAL PRODUCTION MARKET, BY OFFERING, 2021-2024 (USD MILLION)
- TABLE 23 VIRTUAL PRODUCTION MARKET, BY OFFERING, 2025-2030 (USD MILLION)
- TABLE 24 HARDWARE: VIRTUAL PRODUCTION MARKET, BY OFFERING, 2021-2024 (THOUSAND UNITS)
- TABLE 25 HARDWARE: VIRTUAL PRODUCTION MARKET, BY OFFERING, 2025-2030 (THOUSAND UNITS)
- TABLE 26 VIRTUAL PRODUCTION HARDWARE OFFERINGS, BY COMPANY
- TABLE 27 HARDWARE: VIRTUAL PRODUCTION MARKET, BY REGION, 2021-2024 (USD MILLION)
- TABLE 28 HARDWARE: VIRTUAL PRODUCTION MARKET, BY REGION, 2025-2030 (USD MILLION)
- TABLE 29 HARDWARE: VIRTUAL PRODUCTION MARKET IN NORTH AMERICA, BY COUNTRY, 2021-2024 (USD MILLION)
- TABLE 30 HARDWARE: VIRTUAL PRODUCTION MARKET IN NORTH AMERICA, BY COUNTRY, 2025-2030 (USD MILLION)
- TABLE 31 HARDWARE: VIRTUAL PRODUCTION MARKET IN EUROPE, BY COUNTRY, 2021-2024 (USD MILLION)
- TABLE 32 HARDWARE: VIRTUAL PRODUCTION MARKET IN EUROPE, BY COUNTRY, 2025-2030 (USD MILLION)
- TABLE 33 HARDWARE: VIRTUAL PRODUCTION MARKET IN ASIA PACIFIC, BY COUNTRY, 2021-2024 (USD MILLION)
- TABLE 34 HARDWARE: VIRTUAL PRODUCTION MARKET IN ASIA PACIFIC, BY COUNTRY, 2025-2030 (USD MILLION)
- TABLE 35 HARDWARE: VIRTUAL PRODUCTION MARKET IN REST OF THE WORLD, BY REGION, 2021-2024 (USD MILLION)
- TABLE 36 HARDWARE: VIRTUAL PRODUCTION MARKET IN REST OF THE WORLD, BY REGION, 2025-2030 (USD MILLION)
- TABLE 37 VIRTUAL PRODUCTION SOFTWARE OFFERINGS, BY COMPANY
- TABLE 38 SOFTWARE: VIRTUAL PRODUCTION MARKET, BY REGION, 2021-2024 (USD MILLION)
- TABLE 39 SOFTWARE: VIRTUAL PRODUCTION MARKET, BY REGION, 2025-2030 (USD MILLION)
- TABLE 40 SOFTWARE: VIRTUAL PRODUCTION MARKET IN NORTH AMERICA, BY COUNTRY, 2021-2024 (USD MILLION)
- TABLE 41 SOFTWARE: VIRTUAL PRODUCTION MARKET IN NORTH AMERICA, BY COUNTRY, 2025-2030 (USD MILLION)
- TABLE 42 SOFTWARE: VIRTUAL PRODUCTION MARKET IN EUROPE, BY COUNTRY, 2021-2024 (USD MILLION)
- TABLE 43 SOFTWARE: VIRTUAL PRODUCTION MARKET IN EUROPE, BY COUNTRY, 2025-2030 (USD MILLION)
- TABLE 44 SOFTWARE: VIRTUAL PRODUCTION MARKET IN ASIA PACIFIC, BY COUNTRY, 2021-2024 (USD MILLION)
- TABLE 45 SOFTWARE: VIRTUAL PRODUCTION MARKET IN ASIA PACIFIC, BY COUNTRY, 2025-2030 (USD MILLION)
- TABLE 46 SOFTWARE: VIRTUAL PRODUCTION MARKET IN REST OF THE WORLD, BY REGION, 2021-2024 (USD MILLION)
- TABLE 47 SOFTWARE: VIRTUAL PRODUCTION MARKET FOR REST OF THE WORLD, BY REGION, 2025-2030 (USD MILLION)
- TABLE 48 VIRTUAL PRODUCTION RENTAL SERVICE OFFERINGS, BY COMPANY
- TABLE 49 RENTAL SERVICES: VIRTUAL PRODUCTION MARKET, BY REGION, 2021-2024 (USD MILLION)
- TABLE 50 RENTAL SERVICES: VIRTUAL PRODUCTION MARKET, BY REGION, 2025-2030 (USD MILLION)
- TABLE 51 RENTAL SERVICES: VIRTUAL PRODUCTION MARKET IN NORTH AMERICA, BY COUNTRY, 2021-2024 (USD MILLION)
- TABLE 52 RENTAL SERVICES: VIRTUAL PRODUCTION MARKET IN NORTH AMERICA, BY COUNTRY, 2025-2030 (USD MILLION)
- TABLE 53 RENTAL SERVICES: VIRTUAL PRODUCTION MARKET IN EUROPE, BY COUNTRY, 2021-2024 (USD MILLION)
- TABLE 54 RENTAL SERVICES: VIRTUAL PRODUCTION MARKET IN EUROPE, BY COUNTRY, 2025-2030 (USD MILLION)
- TABLE 55 RENTAL SERVICES: VIRTUAL PRODUCTION MARKET IN ASIA PACIFIC, BY COUNTRY, 2021-2024 (USD MILLION)
- TABLE 56 RENTAL SERVICES: VIRTUAL PRODUCTION MARKET IN ASIA PACIFIC, BY COUNTRY, 2025-2030 (USD MILLION)
- TABLE 57 RENTAL SERVICES: VIRTUAL PRODUCTION MARKET IN REST OF THE WORLD, BY REGION, 2021-2024 (USD MILLION)
- TABLE 58 RENTAL SERVICES: VIRTUAL PRODUCTION MARKET IN REST OF THE WORLD, BY REGION, 2025-2030 (USD MILLION)
- TABLE 59 VIRTUAL PRODUCTION MARKET, BY TYPE, 2021-2024 (USD MILLION)
- TABLE 60 VIRTUAL PRODUCTION MARKET, BY TYPE, 2025-2030 (USD MILLION)
- TABLE 61 VIRTUAL PRODUCTION MARKET, BY END USER, 2021-2024 (USD MILLION)
- TABLE 62 VIRTUAL PRODUCTION MARKET, BY END USER, 2025-2030 (USD MILLION)
- TABLE 63 MOVIES: VIRTUAL PRODUCTION MARKET, BY REGION, 2021-2024 (USD MILLION)
- TABLE 64 MOVIES: VIRTUAL PRODUCTION MARKET, BY REGION, 2025-2030 (USD MILLION)
- TABLE 65 TELEVISION SERIES: VIRTUAL PRODUCTION MARKET, BY REGION, 2021-2024 (USD MILLION)
- TABLE 66 TELEVISION SERIES: VIRTUAL PRODUCTION MARKET, BY REGION, 2025-2030 (USD MILLION)
- TABLE 67 COMMERCIAL ADVERTISEMENTS: VIRTUAL PRODUCTION MARKET, BY REGION, 2021-2024 (USD MILLION)
- TABLE 68 COMMERCIAL ADVERTISEMENTS: VIRTUAL PRODUCTION MARKET, BY REGION, 2025-2030 (USD MILLION)
- TABLE 69 ONLINE VIDEOS: VIRTUAL PRODUCTION MARKET, BY REGION, 2021-2024 (USD MILLION)
- TABLE 70 ONLINE VIDEOS: VIRTUAL PRODUCTION MARKET, BY REGION, 2025-2030 (USD MILLION)
- TABLE 71 OTHER END USERS: VIRTUAL PRODUCTION MARKET, BY REGION, 2021-2024 (USD MILLION)
- TABLE 72 OTHER END USERS: VIRTUAL PRODUCTION MARKET, BY REGION, 2025-2030 (USD MILLION)
- TABLE 73 VIRTUAL PRODUCTION MARKET, BY REGION, 2021-2024 (USD MILLION)
- TABLE 74 VIRTUAL PRODUCTION MARKET, BY REGION, 2025-2030 (USD MILLION)
- TABLE 75 NORTH AMERICA: VIRTUAL PRODUCTION MARKET, BY COUNTRY, 2021-2024 (USD MILLION)
- TABLE 76 NORTH AMERICA: VIRTUAL PRODUCTION MARKET, BY COUNTRY, 2025-2030 (USD MILLION)
- TABLE 77 NORTH AMERICA: VIRTUAL PRODUCTION MARKET, BY OFFERING, 2021-2024 (USD MILLION)
- TABLE 78 NORTH AMERICA: VIRTUAL PRODUCTION MARKET, BY OFFERING, 2025-2030 (USD MILLION)
- TABLE 79 NORTH AMERICA: VIRTUAL PRODUCTION MARKET, BY END USER, 2021-2024 (USD MILLION)
- TABLE 80 NORTH AMERICA: VIRTUAL PRODUCTION MARKET, BY END USER, 2025-2030 (USD MILLION)
- TABLE 81 US: VIRTUAL PRODUCTION MARKET, BY OFFERING, 2021-2024 (USD MILLION)
- TABLE 82 US: VIRTUAL PRODUCTION MARKET, BY OFFERING, 2025-2030 (USD MILLION)
- TABLE 83 US: VIRTUAL PRODUCTION MARKET, BY END USER, 2021-2024 (USD MILLION)
- TABLE 84 US: VIRTUAL PRODUCTION MARKET, BY END USER, 2025-2030 (USD MILLION)
- TABLE 85 CANADA: VIRTUAL PRODUCTION MARKET, BY OFFERING, 2021-2024 (USD MILLION)
- TABLE 86 CANADA: VIRTUAL PRODUCTION MARKET, BY OFFERING, 2025-2030 (USD MILLION)
- TABLE 87 CANADA: VIRTUAL PRODUCTION MARKET, BY END USER, 2021-2024 (USD MILLION)
- TABLE 88 CANADA: VIRTUAL PRODUCTION MARKET, BY END USER, 2025-2030 (USD MILLION)
- TABLE 89 MEXICO: VIRTUAL PRODUCTION MARKET, BY OFFERING, 2021-2024 (USD MILLION)
- TABLE 90 MEXICO: VIRTUAL PRODUCTION MARKET, BY OFFERING, 2025-2030 (USD MILLION)
- TABLE 91 MEXICO: VIRTUAL PRODUCTION MARKET, BY END USER, 2021-2024 (USD MILLION)
- TABLE 92 MEXICO: VIRTUAL PRODUCTION MARKET, BY END USER, 2025-2030 (USD MILLION)
- TABLE 93 EUROPE: VIRTUAL PRODUCTION MARKET, BY COUNTRY, 2021-2024 (USD MILLION)
- TABLE 94 EUROPE: VIRTUAL PRODUCTION MARKET, BY COUNTRY, 2025-2030 (USD MILLION)
- TABLE 95 EUROPE: VIRTUAL PRODUCTION MARKET, BY OFFERING, 2021-2024 (USD MILLION)
- TABLE 96 EUROPE: VIRTUAL PRODUCTION MARKET, BY OFFERING, 2025-2030 (USD MILLION)
- TABLE 97 EUROPE: VIRTUAL PRODUCTION MARKET, BY END USER, 2021-2024 (USD MILLION)
- TABLE 98 EUROPE: VIRTUAL PRODUCTION MARKET, BY END USER, 2025-2030 (USD MILLION)
- TABLE 99 UK: VIRTUAL PRODUCTION MARKET, BY OFFERING, 2021-2024 (USD MILLION)
- TABLE 100 UK: VIRTUAL PRODUCTION MARKET, BY OFFERING, 2025-2030 (USD MILLION)
- TABLE 101 UK: VIRTUAL PRODUCTION MARKET, BY END USER, 2021-2024 (USD MILLION)
- TABLE 102 UK: VIRTUAL PRODUCTION MARKET, BY END USER, 2025-2030 (USD MILLION)
- TABLE 103 GERMANY: VIRTUAL PRODUCTION MARKET, BY OFFERING, 2021-2024 (USD MILLION)
- TABLE 104 GERMANY: VIRTUAL PRODUCTION MARKET, BY OFFERING, 2025-2030 (USD MILLION)
- TABLE 105 GERMANY: VIRTUAL PRODUCTION MARKET, BY END USER, 2021-2024 (USD MILLION)
- TABLE 106 GERMANY: VIRTUAL PRODUCTION MARKET, BY END USER, 2025-2030 (USD MILLION)
- TABLE 107 FRANCE: VIRTUAL PRODUCTION MARKET, BY OFFERING, 2021-2024 (USD MILLION)
- TABLE 108 FRANCE: VIRTUAL PRODUCTION MARKET, BY OFFERING, 2025-2030 (USD MILLION)
- TABLE 109 FRANCE: VIRTUAL PRODUCTION MARKET, BY END USER, 2021-2024 (USD MILLION)
- TABLE 110 FRANCE: VIRTUAL PRODUCTION MARKET, BY END USER, 2025-2030 (USD MILLION)
- TABLE 111 REST OF EUROPE: VIRTUAL PRODUCTION MARKET, BY OFFERING, 2021-2024 (USD MILLION)
- TABLE 112 REST OF EUROPE: VIRTUAL PRODUCTION MARKET, BY OFFERING, 2025-2030 (USD MILLION)
- TABLE 113 REST OF EUROPE: VIRTUAL PRODUCTION MARKET, BY END USER, 2021-2024 (USD MILLION)
- TABLE 114 REST OF EUROPE: VIRTUAL PRODUCTION MARKET, BY END USER, 2025-2030 (USD MILLION)
- TABLE 115 ASIA PACIFIC: VIRTUAL PRODUCTION MARKET, BY COUNTRY, 2021-2024 (USD MILLION)
- TABLE 116 ASIA PACIFIC: VIRTUAL PRODUCTION MARKET, BY COUNTRY, 2025-2030 (USD MILLION)
- TABLE 117 ASIA PACIFIC: VIRTUAL PRODUCTION MARKET, BY OFFERING, 2021-2024 (USD MILLION)
- TABLE 118 ASIA PACIFIC: VIRTUAL PRODUCTION MARKET, BY OFFERING, 2025-2030 (USD MILLION)
- TABLE 119 ASIA PACIFIC: VIRTUAL PRODUCTION MARKET, BY END USER, 2021-2024 (USD MILLION)
- TABLE 120 ASIA PACIFIC: VIRTUAL PRODUCTION MARKET, BY END USER, 2025-2030 (USD MILLION)
- TABLE 121 CHINA: VIRTUAL PRODUCTION MARKET, BY OFFERING, 2021-2024 (USD MILLION)
- TABLE 122 CHINA: VIRTUAL PRODUCTION MARKET, BY OFFERING, 2025-2030 (USD MILLION)
- TABLE 123 CHINA: VIRTUAL PRODUCTION MARKET, BY END USER, 2021-2024 (USD MILLION)
- TABLE 124 CHINA: VIRTUAL PRODUCTION MARKET, BY END USER, 2025-2030 (USD MILLION)
- TABLE 125 JAPAN: VIRTUAL PRODUCTION MARKET, BY OFFERING, 2021-2024 (USD MILLION)
- TABLE 126 JAPAN: VIRTUAL PRODUCTION MARKET, BY OFFERING, 2025-2030 (USD MILLION)
- TABLE 127 JAPAN: VIRTUAL PRODUCTION MARKET, BY END USER, 2021-2024 (USD MILLION)
- TABLE 128 JAPAN: VIRTUAL PRODUCTION MARKET, BY END USER, 2025-2030 (USD MILLION)
- TABLE 129 SOUTH KOREA: VIRTUAL PRODUCTION MARKET, BY OFFERING, 2021-2024 (USD MILLION)
- TABLE 130 SOUTH KOREA: VIRTUAL PRODUCTION MARKET, BY OFFERING, 2025-2030 (USD MILLION)
- TABLE 131 SOUTH KOREA: VIRTUAL PRODUCTION MARKET, BY END USER, 2021-2024 (USD MILLION)
- TABLE 132 SOUTH KOREA: VIRTUAL PRODUCTION MARKET, BY END USER, 2025-2030 (USD MILLION)
- TABLE 133 INDIA: VIRTUAL PRODUCTION MARKET, BY OFFERING, 2021-2024 (USD MILLION)
- TABLE 134 INDIA: VIRTUAL PRODUCTION MARKET, BY OFFERING, 2025-2030 (USD MILLION)
- TABLE 135 INDIA: VIRTUAL PRODUCTION MARKET, BY END USER, 2021-2024 (USD MILLION)
- TABLE 136 INDIA: VIRTUAL PRODUCTION MARKET, BY END USER, 2025-2030 (USD MILLION)
- TABLE 137 REST OF ASIA PACIFIC: VIRTUAL PRODUCTION MARKET, BY OFFERING, 2021-2024 (USD MILLION)
- TABLE 138 REST OF ASIA PACIFIC: VIRTUAL PRODUCTION MARKET, BY OFFERING, 2025-2030 (USD MILLION)
- TABLE 139 REST OF ASIA PACIFIC: VIRTUAL PRODUCTION MARKET, BY END USER, 2021-2024 (USD MILLION)
- TABLE 140 REST OF ASIA PACIFIC: VIRTUAL PRODUCTION MARKET, BY END USER, 2025-2030 (USD MILLION)
- TABLE 141 REST OF THE WORLD: VIRTUAL PRODUCTION MARKET, BY REGION, 2021-2024 (USD MILLION)
- TABLE 142 REST OF THE WORLD: VIRTUAL PRODUCTION MARKET, BY REGION, 2025-2030 (USD MILLION)
- TABLE 143 REST OF THE WORLD: VIRTUAL PRODUCTION MARKET, BY OFFERING, 2021-2024 (USD MILLION)
- TABLE 144 REST OF THE WORLD: VIRTUAL PRODUCTION MARKET, BY OFFERING, 2025-2030 (USD MILLION)
- TABLE 145 REST OF THE WORLD: VIRTUAL PRODUCTION MARKET, BY END USER, 2021-2024 (USD MILLION)
- TABLE 146 REST OF THE WORLD: VIRTUAL PRODUCTION MARKET, BY END USER, 2025-2030 (USD MILLION)
- TABLE 147 SOUTH AMERICA: VIRTUAL PRODUCTION MARKET, BY OFFERING, 2021-2024 (USD MILLION)
- TABLE 148 SOUTH AMERICA: VIRTUAL PRODUCTION MARKET, BY OFFERING, 2025-2030 (USD MILLION)
- TABLE 149 SOUTH AMERICA: VIRTUAL PRODUCTION MARKET, BY END USER, 2021-2024 (USD MILLION)
- TABLE 150 SOUTH AMERICA: VIRTUAL PRODUCTION MARKET, BY END USER, 2025-2030 (USD MILLION)
- TABLE 151 MIDDLE EAST & AFRICA: VIRTUAL PRODUCTION MARKET, BY OFFERING, 2021-2024 (USD MILLION)
- TABLE 152 MIDDLE EAST & AFRICA: VIRTUAL PRODUCTION MARKET, BY OFFERING, 2025-2030 (USD MILLION)
- TABLE 153 MIDDLE EAST & AFRICA: VIRTUAL PRODUCTION MARKET, BY END USER, 2021-2024 (USD MILLION)
- TABLE 154 MIDDLE EAST & AFRICA: VIRTUAL PRODUCTION MARKET, BY END USER, 2025-2030 (USD MILLION)
- TABLE 155 OVERVIEW OF STRATEGIES DEPLOYED BY KEY VIRTUAL PRODUCTION COMPANIES
- TABLE 156 VIRTUAL PRODUCTION MARKET SHARE ANALYSIS: DEGREE OF COMPETITION, 2024
- TABLE 157 VIRTUAL PRODUCTION MARKET: REGION FOOTPRINT
- TABLE 158 VIRTUAL PRODUCTION MARKET: OFFERING FOOTPRINT
- TABLE 159 VIRTUAL PRODUCTION MARKET: END-USER FOOTPRINT
- TABLE 160 VIRTUAL PRODUCTION MARKET: PRODUCT LAUNCHES, JANUARY 2022-JULY 2025
- TABLE 161 VIRTUAL PRODUCTION MARKET: DEALS, JANUARY 2022-JULY 2025
- TABLE 162 SONY CORPORATION: COMPANY OVERVIEW
- TABLE 163 SONY CORPORATION: PRODUCTS/SOLUTIONS/SERVICES OFFERED
- TABLE 164 SONY CORPORATION: PRODUCT LAUNCHES
- TABLE 165 SONY CORPORATION: DEALS
- TABLE 166 NEP GROUP, INC.: COMPANY OVERVIEW
- TABLE 167 NEP GROUP, INC.: PRODUCTS/SOLUTIONS/SERVICES OFFERED
- TABLE 168 NEP GROUP, INC.: PRODUCT LAUNCHES
- TABLE 169 NEP GOUP, INC.: DEALS
- TABLE 170 NIKON CORPORATION: COMPANY OVERVIEW
- TABLE 171 NIKON CORPORATION: PRODUCTS/SOLUTIONS/SERVICES OFFERED
- TABLE 172 NIKON CORPORATION: PRODUCT LAUNCHES
- TABLE 173 NIKON CORPORATION: DEALS
- TABLE 174 ADOBE: COMPANY OVERVIEW
- TABLE 175 ADOBE: PRODUCTS/SOLUTIONS/SERVICES OFFERED
- TABLE 176 ADOBE: PRODUCT LAUNCHES
- TABLE 177 ADOBE: DEALS
- TABLE 178 PRG: COMPANY OVERVIEW
- TABLE 179 PRG: PRODUCTS/SOLUTIONS/SERVICES OFFERED
- TABLE 180 PRG: PRODUCT LAUNCHES
- TABLE 181 PRG: DEALS
- TABLE 182 ROE VISUAL: COMPANY OVERVIEW
- TABLE 183 ROE VISUAL: PRODUCTS/SOLUTIONS/SERVICES OFFERED
- TABLE 184 ROE VISUAL: PRODUCT LAUNCHES
- TABLE 185 ROE VISUAL: DEALS
- TABLE 186 AUTODESK INC.: COMPANY OVERVIEW
- TABLE 187 AUTODESK INC.: PRODUCTS/SOLUTIONS/SERVICES OFFERED
- TABLE 188 AUTODESK INC.: PRODUCT LAUNCHES
- TABLE 189 AUTODESK INC.: DEALS
- TABLE 190 NVIDIA CORPORATION: COMPANY OVERVIEW
- TABLE 191 NVIDIA CORPORATION: PRODUCTS/SOLUTIONS/SERVICES OFFERED
- TABLE 192 NVIDIA CORPORATION: PRODUCT LAUNCHES AND UPDATES
- TABLE 193 NVIDIA CORPORATION: DEALS
- TABLE 194 AOTO ELECTRONICS CO., LTD.: COMPANY OVERVIEW
- TABLE 195 AOTO ELECTRONICS CO., LTD.: PRODUCTS/SOLUTIONS/SERVICES OFFERED
- TABLE 196 AOTO ELECTRONICS CO., LTD.: PRODUCT LAUNCHES
- TABLE 197 AOTO ELECTRONICS CO., LTD.: DEALS
- TABLE 198 EPIC GAMES: COMPANY OVERVIEW
- TABLE 199 EPIC GAMES: PRODUCTS/SOLUTIONS/SERVICES OFFERED
- TABLE 200 EPIC GAMES: PRODUCT LAUNCHES AND UPDATES
- TABLE 201 EPIC GAMES: DEALS
- TABLE 202 ARRI GMBH: COMPANY OVERVIEW
- TABLE 203 TECHNICOLOR GROUP: COMPANY OVERVIEW
- TABLE 204 HTC CORPORATION: COMPANY OVERVIEW
- TABLE 205 VICON MOTION SYSTEMS LTD.: COMPANY OVERVIEW
- TABLE 206 SIDEFX: COMPANY OVERVIEW
- TABLE 207 MO-SYS ENGINEERING LTD.: COMPANY OVERVIEW
- TABLE 208 PERFORCE: COMPANY OVERVIEW
- TABLE 209 DNEG: COMPANY OVERVIEW
- TABLE 210 TILTLABS: COMPANY OVERVIEW
- TABLE 211 PLANAR SYSTEMS, INC.: COMPANY OVERVIEW
- TABLE 212 VIRSABI: COMPANY OVERVIEW
- TABLE 213 DIMENSIONS: COMPANY OVERVIEW
- TABLE 214 FUSE: COMPANY OVERVIEW
- TABLE 215 RECODE XR STUDIO: COMPANY OVERVIEW
- TABLE 216 VU TECHNOLOGIES: COMPANY OVERVIEW
- TABLE 217 80SIX GROUP LTD.: COMPANY OVERVIEW
- TABLE 218 BORIS FX: COMPANY OVERVIEW
- TABLE 219 INSTA360: COMPANY OVERVIEW
- TABLE 220 360RIZE: COMPANY OVERVIEW
- TABLE 221 WETA FX: COMPANY OVERVIEW
List of Figures
- FIGURE 1 VIRTUAL PRODUCTION MARKET SEGMENTATION & REGIONAL SCOPE
- FIGURE 2 VIRTUAL PRODUCTION MARKET: YEARS CONSIDERED
- FIGURE 3 VIRTUAL PRODUCTION MARKET: RESEARCH DESIGN
- FIGURE 4 VIRTUAL PRODUCTION MARKET: PRIMARY AND SECONDARY RESEARCH APPROACH
- FIGURE 5 VIRTUAL PRODUCTION MARKET: KEY DATA FROM SECONDARY SOURCES
- FIGURE 6 VIRTUAL PRODUCTION MARKET: BREAKDOWN OF PRIMARIES, BY COMPANY TYPE, DESIGNATION, AND REGION
- FIGURE 7 VIRTUAL PRODUCTION MARKET: KEY DATA FROM PRIMARY SOURCES
- FIGURE 8 VIRTUAL PRODUCTION MARKET: KEY INSIGHTS FROM INDUSTRY EXPERTS
- FIGURE 9 VIRTUAL PRODUCTION MARKET SIZE ESTIMATION: SUPPLY-SIDE ANALYSIS
- FIGURE 10 VIRTUAL PRODUCTION MARKET SIZE ESTIMATION METHODOLOGY: DEMAND-SIDE ANALYSIS
- FIGURE 11 VIRTUAL PRODUCTION MARKET SIZE ESTIMATION METHODOLOGY: BOTTOM-UP APPROACH
- FIGURE 12 VIRTUAL PRODUCTION MARKET SIZE ESTIMATION METHODOLOGY: TOP-DOWN APPROACH
- FIGURE 13 VIRTUAL PRODUCTION MARKET: DATA TRIANGULATION
- FIGURE 14 VIRTUAL PRODUCTION MARKET SIZE, 2021-2030 (USD MILLION)
- FIGURE 15 HARDWARE TO ACCOUNT FOR LARGEST VIRTUAL PRODUCTION MARKET SHARE, BY OFFERING, IN 2025
- FIGURE 16 PRODUCTION TO ACCOUNT FOR LARGEST MARKET SHARE, BY TYPE, IN 2030
- FIGURE 17 TELEVISION SERIES TO GROW AT HIGHEST CAGR IN VIRTUAL PRODUCTION END USER MARKET FROM 2025 TO 2030
- FIGURE 18 ASIA PACIFIC TO BE FASTEST-GROWING IN GLOBAL VIRTUAL PRODUCTION MARKET DURING FORECAST PERIOD
- FIGURE 19 RISING DEMAND FOR VISUAL EFFECTS IN MOVIES TO FUEL MARKET GROWTH
- FIGURE 20 RENTAL SERVICES TO GROW AT HIGHEST CAGR DURING FORECAST PERIOD
- FIGURE 21 PRODUCTION TO ACCOUNT FOR LARGEST VIRTUAL PRODUCTION MARKET SHARE, BY TYPE, IN 2025
- FIGURE 22 CHINA TO REGISTER HIGHEST CAGR DURING STUDY PERIOD
- FIGURE 23 NORTH AMERICA TO ACCOUNT FOR LARGEST SHARE OF GLOBAL VIRTUAL PRODUCTION MARKET IN 2030
- FIGURE 24 VIRTUAL PRODUCTION MARKET: DRIVERS, RESTRAINTS, OPPORTUNITIES, AND CHALLENGES
- FIGURE 25 DRIVERS AND THEIR IMPACTS ON VIRTUAL PRODUCTION MARKET
- FIGURE 26 RESTRAINTS AND THEIR IMPACTS ON VIRTUAL PRODUCTION MARKET
- FIGURE 27 OPPORTUNITIES AND THEIR IMPACTS ON VIRTUAL PRODUCTION MARKET
- FIGURE 28 CHALLENGES AND THEIR IMPACTS ON VIRTUAL PRODUCTION MARKET
- FIGURE 29 VIRTUAL PRODUCTION MARKET: SUPPLY CHAIN ANALYSIS
- FIGURE 30 VIRTUAL PRODUCTION MARKET: ECOSYSTEM ANALYSIS
- FIGURE 31 AVERAGE SELLING PRICE TREND OF HARDWARE, BY KEY PLAYER, 2021-2024 (USD)
- FIGURE 32 AVERAGE SELLING PRICE TREND OF HARDWARE, BY REGION, 2021-2024 (USD)
- FIGURE 33 VIRTUAL PRODUCTION MARKET: TRENDS & DISRUPTIONS IMPACTING CUSTOMERS' BUSINESSES
- FIGURE 34 VIRTUAL PRODUCTION MARKET: PORTER'S FIVE FORCES ANALYSIS
- FIGURE 35 INFLUENCE OF KEY STAKEHOLDERS ON BUYING PROCESS FOR TOP THREE END USERS
- FIGURE 36 KEY BUYING CRITERIA FOR TOP THREE END USERS
- FIGURE 37 IMPORT DATA FOR HS CODE 900710, BY COUNTRY, 2020-2024 (USD MILLION)
- FIGURE 38 EXPORT DATA FOR HS CODE 900710, BY COUNTRY, 2020-2024 (USD MILLION)
- FIGURE 39 NUMBER OF PATENTS APPLIED/GRANTED FOR VIRTUAL PRODUCTION PRODUCTS, 2015-2024
- FIGURE 40 IMPACT OF AI/GEN AI ON VIRTUAL PRODUCTION MARKET ECOSYSTEM
- FIGURE 41 VIRTUAL PRODUCTION MARKET, BY OFFERING
- FIGURE 42 HARDWARE TO COMMAND LARGEST VIRTUAL PRODUCTION MARKET SHARE, BY OFFERING, IN 2025
- FIGURE 43 VIRTUAL PRODUCTION MARKET, BY TYPE
- FIGURE 44 STEPS IN UTILIZATION OF VIRTUAL PRODUCTION, BY TYPE
- FIGURE 45 PRODUCTION TO ACCOUNT FOR LARGEST VIRTUAL PRODUCTION MARKET SHARE, BY TYPE, IN 2030
- FIGURE 46 VIRTUAL PRODUCTION MARKET, BY END USER
- FIGURE 47 MOVIES TO LEAD VIRTUAL PRODUCTION MARKET IN 2030
- FIGURE 48 VIRTUAL PRODUCTION MARKET, BY REGION
- FIGURE 49 NORTH AMERICA TO ACCOUNT FOR LARGEST SHARE OF GLOBAL VIRTUAL PRODUCTION MARKET IN 2025
- FIGURE 50 SNAPSHOT OF VIRTUAL PRODUCTION MARKET IN NORTH AMERICA
- FIGURE 51 SNAPSHOT OF VIRTUAL PRODUCTION MARKET IN EUROPE
- FIGURE 52 SNAPSHOT OF VIRTUAL PRODUCTION MARKET IN ASIA PACIFIC
- FIGURE 53 MARKET SHARE ANALYSIS OF KEY PLAYERS IN VIRTUAL PRODUCTION MARKET (2024)
- FIGURE 54 REVENUE ANALYSIS OF KEY PLAYERS IN VIRTUAL PRODUCTION MARKET, 2020-2024 (USD BILLION)
- FIGURE 55 VIRTUAL PRODUCTION MARKET: COMPANY EVALUATION MATRIX FOR HARDWARE AND SOFTWARE PROVIDERS (KEY PLAYERS), 2024
- FIGURE 56 VIRTUAL PRODUCTION MARKET: COMPANY EVALUATION MATRIX FOR R ENTAL SERVICE PROVIDERS (KEY PLAYERS), 2024
- FIGURE 57 VIRTUAL PRODUCTION MARKET: COMPANY FOOTPRINT
- FIGURE 58 SONY CORPORATION: COMPANY SNAPSHOT
- FIGURE 59 NIKON CORPORATION: COMPANY SNAPSHOT
- FIGURE 60 ADOBE: COMPANY SNAPSHOT
- FIGURE 61 AUTODESK INC.: COMPANY SNAPSHOT
- FIGURE 62 NVIDIA CORPORATION: COMPANY SNAPSHOT
- FIGURE 63 AOTO ELECTRONICS CO., LTD.: COMPANY SNAPSHOT
 虚拟製作市场分析及预测(至2035年):依类型、产品类型、服务、技术、组件、应用、流程、最终用户、解决方案、阶段划分
 全球虚拟製作市场规模、份额、趋势和成长分析报告(2026-2034)虚拟製作市场规模、占有率、成长及全球产业分析:依类型、应用和地区划分的洞察与预测(2026-2034年)
 虚拟製作市场-全球产业规模、份额、趋势、机会及预测(依技术、组件、最终用户产业、地区及竞争格局划分,2021-2031年)
 全端视觉化服务市场:2026-2032年全球预测(按服务类型、应用程式、部署类型、最终用户和垂直产业划分)
 虚拟製作市场规模、份额和成长分析(按产品、类型、最终用户和地区划分)-2026-2033年产业预测
 虚拟製作市场规模、份额和趋势分析报告:按组件、类型、最终用途、地区和细分市场预测(2026-2033 年)
 虚拟製作市场机会、成长要素、产业趋势分析及2026年至2035年预测虚拟製作市场按组件、内容时长、类型、摄影棚萤幕大小、部署类型和最终用户划分——2025-2030 年全球预测
 全球虚拟摄影棚市场:市场规模、份额、趋势分析(按公司规模、最终用途、组件、部署方法、应用和地区)、展望和预测(2025-2032 年)