


 |
市场调查报告书
商品编码
1913397
聚四亚甲基醚二醇市场:市场机会、成长驱动因素、产业趋势分析及预测(2026-2035)Polytetramethylene Ether Glycol Market Opportunity, Growth Drivers, Industry Trend Analysis, and Forecast 2026 - 2035 |
||||||
2025 年全球聚四氢呋喃醚二醇市值为 29 亿美元,预计到 2035 年将达到 56 亿美元,年复合成长率为 6.6%。
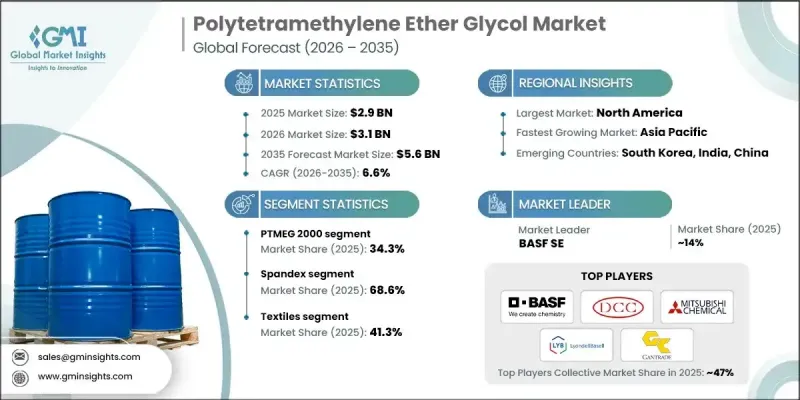
市场扩张的驱动力在于纺织品、汽车零件和先进材料应用领域对高性能聚合物日益增长的需求。聚四氢呋喃(也称为聚四氢呋喃)因其作为弹性纤维、热可塑性橡胶和特殊聚合物的核心结构单元而闻名。其广泛的分子量范围使其能够应用于需要柔软性、回弹性和机械稳定性的应用领域。纺织製造业的成长、汽车生产中轻质材料的日益普及以及高性能聚合物的持续创新正在塑造市场动态。生产商正投资于最新的製造技术,以提高产品的一致性、纯度和工艺效率,从而支持其在要求苛刻的终端用户行业中的广泛应用。同时,永续性因素也影响生产策略,企业更加重视减少环境影响、提高资源利用效率并遵循循环经济原则。这些趋势确保了成熟市场和新兴市场对聚四氢呋喃的持续全球需求。
| 市场覆盖范围 | |
|---|---|
| 开始年份 | 2025 |
| 预测期 | 2026-2035 |
| 初始市场规模 | 29亿美元 |
| 市场规模预测 | 56亿美元 |
| 复合年增长率 | 6.6% |
PTMEG 2000牌号在2025年占据了34.3%的市场份额,预计从2026年到2035年将以6.6%的复合年增长率成长。此牌号维持主导地位的原因在于其均衡的分子结构,使其具有优异的模量、拉伸强度和加工柔软性。其卓越的性能使其成为需要持久稳定机械性能的应用的理想选择。
预计到 2025 年,氨纶市占率将达到 68.6%,到 2035 年将以 7% 的复合年增长率成长。对弹性舒适服饰的强劲需求推动了 PTMEG 基纤维的高消费,这主要得益于其优异的回弹性、耐用性和美观性。
预计到 2025 年,美国聚四氢呋喃醚二醇市场规模将达到 3.979 亿美元。由于弹性纤维生产体係成熟、热塑性聚氨酯应用广泛,以及技术纤维和高性能材料领域的不断创新,市场需求仍然强劲,巩固了美国在该地区的主导地位。
目录
第一章:分析方法和范围
第二章执行摘要
第三章业界考察
- 产业生态系分析
- 供应商情况
- 利润率
- 每个阶段的附加价值
- 影响价值链的因素
- 中断
- 产业影响因素
- 司机
- 产业潜在风险与挑战
- 市场机会
- 成长潜力分析
- 监管环境
- 北美洲
- 欧洲
- 亚太地区
- 拉丁美洲
- 中东和非洲
- 波特五力分析
- PESTEL 分析
- 科技与创新趋势
- 当前技术趋势
- 新兴技术
- 价格趋势
- 按地区
- 按产品等级
- 未来市场趋势
- 科技与创新趋势
- 当前技术趋势
- 新兴技术
- 专利趋势
- 贸易统计(HS编码)(註:仅提供主要国家的贸易统计)
- 主要进口国
- 主要出口国
- 永续性和环境方面
- 永续努力
- 减少废弃物策略
- 生产中的能源效率
- 环保倡议
- 考虑到碳足迹
第四章 竞争情势
- 介绍
- 公司市占率分析
- 按地区
- 北美洲
- 欧洲
- 亚太地区
- 拉丁美洲
- 中东和非洲
- 按地区
- 企业矩阵分析
- 主要企业的竞争分析
- 竞争定位矩阵
- 主要趋势
- 企业合併(M&A)
- 商业伙伴关係与合作
- 新产品发布
- 扩张计划
第五章 依产品等级分類的市场估算与预测(2022-2035 年)
- PTMEG 250
- PTMEG 650
- PTMEG 1000
- PTMEG 1400
- PTMEG 1800
- PTMEG 2000
- 其他的
第六章 按应用领域分類的市场估算与预测(2022-2035 年)
- 氨纶
- 热塑性胺甲酸乙酯弹性体
- 共聚酯醚弹性体
- 其他的
7. 依最终用途产业分類的市场估计与预测(2022-2035 年)
- 画
- 建造
- 黏合剂和密封剂
- 纺织业
- 人造皮革
- 车
- 工业的
- 休閒与体育
- 其他的
第八章 各地区市场估算与预测(2022-2035 年)
- 北美洲
- 美国
- 加拿大
- 欧洲
- 德国
- 英国
- 法国
- 西班牙
- 义大利
- 其他欧洲
- 亚太地区
- 中国
- 印度
- 日本
- 澳洲
- 韩国
- 亚太其他地区
- 拉丁美洲
- 巴西
- 墨西哥
- 阿根廷
- 其他拉丁美洲
- 中东和非洲
- 沙乌地阿拉伯
- 南非
- 阿拉伯聯合大公国
- 其他中东和非洲地区
第九章:公司简介
- BASF SE
- Dairen Chemical Corporation
- Mitsubishi Chemical Corporation
- LyondellBasell Industries NV
- Gantrade Corporation
- Ashland Global Holdings Inc.
- Lanxess AG
- Kuraray Co., Ltd.
- Chang Chun Petrochemical
- Shanxi Sanwei Group
- Korea PTG Co., Ltd.
- China Petrochemical Corporation
- Brenntag
- SINOPEC Great Wall Energy
- IMCD Group
The Global Polytetramethylene Ether Glycol Market was valued at USD 2.9 billion in 2025 and is estimated to grow at a CAGR of 6.6% to reach USD 5.6 billion by 2035.
Market expansion is driven by rising demand for high-performance polymers across textiles, automotive components, and advanced material applications. Polytetramethylene ether glycol, also referred to as polytetrahydrofuran, is recognized for its role as a core building block in elastic fibers, thermoplastic elastomers, and specialty polymers. Availability across a broad range of molecular weights enables its use in applications requiring flexibility, resilience, and mechanical stability. Growth in textile manufacturing, increasing adoption of lightweight materials in automotive production, and ongoing innovation in performance polymers are collectively shaping market dynamics. Producers are investing in modern manufacturing techniques to enhance consistency, purity, and process efficiency, which is supporting wider adoption across demanding end-use industries. At the same time, sustainability considerations are influencing production strategies, with a greater focus on reducing environmental impact, improving resource efficiency, and aligning with circular economy principles. These trends are ensuring continued global demand across both mature and emerging markets.
| Market Scope | |
|---|---|
| Start Year | 2025 |
| Forecast Year | 2026-2035 |
| Start Value | $2.9 billion |
| Forecast Value | $5.6 billion |
| CAGR | 6.6% |
The PTMEG 2000 accounted for 34.3% share in 2025 and is expected to grow at a CAGR of 6.6% from 2026 to 2035. This grade maintains a leading position due to its balanced molecular structure, which supports strong elasticity, tensile strength, and processing flexibility. Its performance profile makes it a preferred option for applications requiring durability and consistent mechanical properties.
The spandex segment held 68.6% share in 2025 and is projected to grow at a CAGR of 7% through 2035. Strong growth in demand for stretchable and comfortable apparel is sustaining high consumption of PTMEG-based fibers, supported by its ability to deliver excellent recovery, durability, and aesthetic performance.
United States Polytetramethylene Ether Glycol Market generated USD 397.9 million in 2025. Demand remains strong due to established elastic fiber production, widespread use of thermoplastic polyurethanes, and continuous innovation in technical textiles and performance materials, reinforcing the country's leading regional position.
Key companies operating in the Global Polytetramethylene Ether Glycol Market include BASF SE, Mitsubishi Chemical Corporation, LyondellBasell Industries N.V., Kuraray Co., Ltd., Lanxess AG, Ashland Global Holdings Inc., Dairen Chemical Corporation, Chang Chun Petrochemical, Shanxi Sanwei Group, Korea PTG Co., Ltd., China Petrochemical Corporation, SINOPEC Great Wall Energy, Gantrade Corporation, Brenntag, and IMCD Group. Companies active in the Global Polytetramethylene Ether Glycol Market are strengthening their competitive position through capacity expansion, product differentiation, and technology advancement. Manufacturers are prioritizing process optimization to achieve higher purity levels, consistent molecular weight distribution, and improved production efficiency. Strategic investments in sustainable manufacturing practices and alternative feedstocks are helping align operations with evolving environmental expectations. Firms are also expanding global distribution networks and forming long-term supply agreements with downstream users to secure stable demand.
Table of Contents
Chapter 1 Methodology & Scope
- 1.1 Market scope and definition
- 1.2 Research design
- 1.2.1 Research approach
- 1.2.2 Data collection methods
- 1.3 Data mining sources
- 1.3.1 Global
- 1.3.2 Regional/Country
- 1.4 Base estimates and calculations
- 1.4.1 Base year calculation
- 1.4.2 Key trends for market estimation
- 1.5 Primary research and validation
- 1.5.1 Primary sources
- 1.6 Forecast model
- 1.7 Research assumptions and limitations
Chapter 2 Executive Summary
- 2.1 Industry 3600 synopsis
- 2.2 Key market trends
- 2.2.1 Product grade
- 2.2.2 Application
- 2.2.3 End use industry
- 2.2.4 Regional
- 2.3 TAM Analysis, 2025-2035
- 2.4 CXO perspectives: Strategic imperatives
- 2.4.1 Executive decision points
- 2.4.2 Critical success factors
- 2.5 Future outlook and strategic recommendations
Chapter 3 Industry Insights
- 3.1 Industry ecosystem analysis
- 3.1.1 Supplier landscape
- 3.1.2 Profit margin
- 3.1.3 Value addition at each stage
- 3.1.4 Factor affecting the value chain
- 3.1.5 Disruptions
- 3.2 Industry impact forces
- 3.2.1 Growth drivers
- 3.2.2 Industry pitfalls and challenges
- 3.2.3 Market opportunities
- 3.3 Growth potential analysis
- 3.4 Regulatory landscape
- 3.4.1 North America
- 3.4.2 Europe
- 3.4.3 Asia Pacific
- 3.4.4 Latin America
- 3.4.5 Middle East & Africa
- 3.5 Porter's analysis
- 3.6 PESTEL analysis
- 3.7 Technology and innovation landscape
- 3.7.1 Current technological trends
- 3.7.2 Emerging technologies
- 3.8 Price trends
- 3.8.1 By region
- 3.8.2 By product grade
- 3.9 Future market trends
- 3.10 Technology and innovation landscape
- 3.10.1 Current technological trends
- 3.10.2 Emerging technologies
- 3.11 Patent landscape
- 3.12 Trade statistics (HS code) ( Note: the trade statistics will be provided for key countries only)
- 3.12.1 Major importing countries
- 3.12.2 Major exporting countries
- 3.13 Sustainability and environmental aspects
- 3.13.1 Sustainable practices
- 3.13.2 Waste reduction strategies
- 3.13.3 Energy efficiency in production
- 3.13.4 Eco-friendly initiatives
- 3.14 Carbon footprint consideration
Chapter 4 Competitive Landscape, 2025
- 4.1 Introduction
- 4.2 Company market share analysis
- 4.2.1 By region
- 4.2.1.1 North America
- 4.2.1.2 Europe
- 4.2.1.3 Asia Pacific
- 4.2.1.4 LATAM
- 4.2.1.5 MEA
- 4.2.1 By region
- 4.3 Company matrix analysis
- 4.4 Competitive analysis of major market players
- 4.5 Competitive positioning matrix
- 4.6 Key developments
- 4.6.1 Mergers & acquisitions
- 4.6.2 Partnerships & collaborations
- 4.6.3 New product launches
- 4.6.4 Expansion plans
Chapter 5 Market Estimates and Forecast, By Product Grade, 2022-2035 (USD Billion) (Kilo Tons)
- 5.1 Key trends
- 5.2 PTMEG 250
- 5.3 PTMEG 650
- 5.4 PTMEG 1000
- 5.5 PTMEG 1400
- 5.6 PTMEG 1800
- 5.7 PTMEG 2000
- 5.8 Others
Chapter 6 Market Estimates and Forecast, By Application, 2022-2035 (USD Billion) (Kilo Tons)
- 6.1 Key trends
- 6.2 Spandex
- 6.3 Thermoplastic urethane elastomer
- 6.4 Co-polyester ether elastomers
- 6.5 Others
Chapter 7 Market Estimates and Forecast, By End Use Industry, 2022-2035 (USD Billion) (Kilo Tons)
- 7.1 Key trends
- 7.2 Coatings
- 7.3 Construction
- 7.4 Adhesives & sealants
- 7.5 Textiles
- 7.6 Artificial leather
- 7.7 Automotive
- 7.8 Industrial
- 7.9 Leisure & sports
- 7.10 Others
Chapter 8 Market Estimates and Forecast, By Region, 2022-2035 (USD Billion) (Kilo Tons)
- 8.1 Key trends
- 8.2 North America
- 8.2.1 U.S.
- 8.2.2 Canada
- 8.3 Europe
- 8.3.1 Germany
- 8.3.2 UK
- 8.3.3 France
- 8.3.4 Spain
- 8.3.5 Italy
- 8.3.6 Rest of Europe
- 8.4 Asia Pacific
- 8.4.1 China
- 8.4.2 India
- 8.4.3 Japan
- 8.4.4 Australia
- 8.4.5 South Korea
- 8.4.6 Rest of Asia Pacific
- 8.5 Latin America
- 8.5.1 Brazil
- 8.5.2 Mexico
- 8.5.3 Argentina
- 8.5.4 Rest of Latin America
- 8.6 Middle East and Africa
- 8.6.1 Saudi Arabia
- 8.6.2 South Africa
- 8.6.3 UAE
- 8.6.4 Rest of Middle East and Africa
Chapter 9 Company Profiles
- 9.1 BASF SE
- 9.2 Dairen Chemical Corporation
- 9.3 Mitsubishi Chemical Corporation
- 9.4 LyondellBasell Industries N.V.
- 9.5 Gantrade Corporation
- 9.6 Ashland Global Holdings Inc.
- 9.7 Lanxess AG
- 9.8 Kuraray Co., Ltd.
- 9.9 Chang Chun Petrochemical
- 9.10 Shanxi Sanwei Group
- 9.11 Korea PTG Co., Ltd.
- 9.12 China Petrochemical Corporation
- 9.13 Brenntag
- 9.14 SINOPEC Great Wall Energy
- 9.15 IMCD Group
 生物基聚丙烯医疗设备市场-全球产业规模、份额、趋势、机会和预测:按应用、地区和竞争格局划分,2021-2031年
 生物基聚丙烯市场规模、份额和趋势分析报告:按应用、地区和细分市场预测(2026-2033 年)
 生物基聚丙烯市场规模、份额和成长分析(按原料、製造流程、挤出类型、应用和地区划分)-2026-2033年产业预测
 全球医疗设备生物基聚丙烯市场全球合成与生物基聚丙烯市场
 生物基聚丙烯:市场占有率分析、产业趋势与成长预测(2025-2030)
 聚四亚甲基醚二醇市场评估:各用途,各终端用户产业,各地区,机会及预测,2018~2032年
 生物基聚丙烯市场按来源、应用、最终用途产业和地区划分 - 预测至 2029 年聚四亚甲基醚二醇 (PTMEG):市场占有率分析、产业趋势与统计、2025-2030 年成长预测
 医疗设备生物为基础聚丙烯的全球市场:市场规模·占有率·趋势,产业分析 (各用途·各终端用户·材料类别·各生产方法·各变性方法·各地区),未来预测 (2025年~2034年)