


 |
市场调查报告书
商品编码
1913400
自助结帐系统市场:市场机会、成长驱动因素、产业趋势分析及预测(2026-2035 年)Self-Checkout System Market Opportunity, Growth Drivers, Industry Trend Analysis, and Forecast 2026 - 2035 |
||||||
全球自助结帐系统市场预计到 2025 年将达到 53 亿美元,到 2035 年将达到 188 亿美元,年复合成长率为 13.7%。
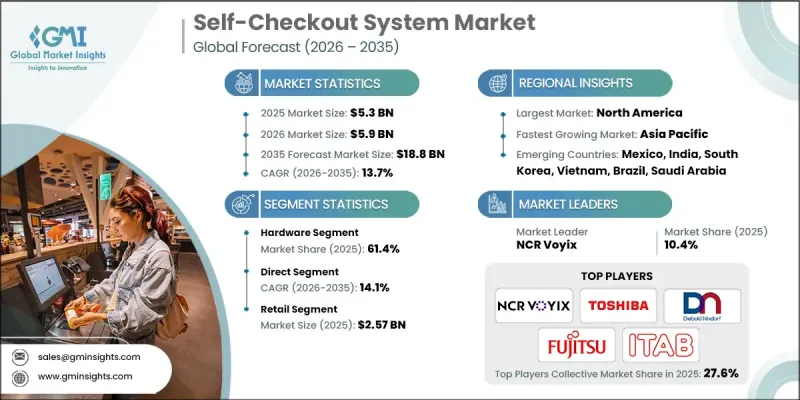
公共和商业场所客流量的不断增长推动了产业发展,也给传统收银台带来了越来越大的压力。如何应对排长队和拥挤的人群已成为一项重大的营运挑战,迫使企业采用自助结帐解决方案。自助结帐系统能够加快交易速度,最大限度地减少对第一线员工的依赖,并显着提升顾客的便利性。此外,它们还能让员工能腾出精力从事更有价值的工作,进而提升员工的工作效率。随着数位支付在全球的普及,市场正迅速转型为自动化、无现金支付环境。非接触式支付选项和流畅的交易体验已成为人们的核心期望,推动了这些系统的广泛应用。在营运效率和顾客体验成为首要考虑因素的背景下,自助结帐系统解决方案作为一项策略性投资,在服务业持续获得认可。
| 市场覆盖范围 | |
|---|---|
| 开始年份 | 2025 |
| 预测期 | 2026-2035 |
| 初始市场规模 | 53亿美元 |
| 市场规模预测 | 188亿美元 |
| 复合年增长率 | 13.7% |
预计到2025年,硬体部分将占据61.4%的市场。对可靠耐用的收银机组件的强劲需求将继续支撑这一主导地位。整合扫描、显示和支付功能的硬体系统简化了安装和维护,使其在高客流量环境中极具吸引力。
预计到2025年,零售业规模将达到25.7亿美元,占市占率的48.5%。零售商正在广泛采用自助结帐系统,以提高交易速度、减少对劳动力的依赖,并有效应对高客流量。
预计到2025年,美国自助结帐系统市场规模将达17.5亿美元。市场成长主要得益于大型零售商的强大影响力以及对结帐自动化领域的持续投资。凭藉先进的零售基础设施和较高的普及率,技术供应商正日益将美国视为重要的产生收入来源。
目录
第一章:分析方法和范围
第二章执行摘要
第三章业界考察
- 产业生态系分析
- 供应商情况
- 利润率
- 成本结构
- 每个阶段的附加价值
- 影响价值链的因素
- 中断
- 产业影响因素
- 司机
- 非接触式支付和更快捷结帐体验的需求日益增长
- 零售商店自动化程度不断提高
- 降低零售商的营运成本
- 超级市场、大卖场和便利商店的扩张
- 产业潜在风险与挑战
- 较高的初始安装和维护成本
- 小规模、预算有限的零售商采用率有限
- 市场机会
- 新兴市场和开发中国家的需求不断增长
- 非零售领域的采用率不断提高
- 利用人工智慧拓展自主收银解决方案
- 与行动应用、忠诚度计画和分析工具集成
- 司机
- 成长潜力分析
- 监管环境
- 北美洲
- 支付卡产业资料安全标准(PCI DSS)
- 美国州级立法
- 加拿大的《个人资讯保护与电子文件法》(PIPEDA)
- 欧洲
- 一般资料保护规则(GDPR)
- 欧盟人工智慧法
- 英国数位身分和属性信任框架
- 支付服务指令2(PSD2)
- 亚太地区
- 中国网路安全法(CSL)
- 本地数位支付整合标准
- 拉丁美洲
- 巴西PIX即时支付系统的安全要求
- 强制双因素认证(2FA)
- 中东和非洲
- 海湾合作委员会国家支付安全框架
- 南非个人资讯保护法(POPIA)
- 北美洲
- 波特五力分析
- PESTEL 分析
- 科技与创新趋势
- 当前技术趋势
- 新兴技术
- 价格趋势
- 按地区
- 副产品
- 成本細項分析
- 永续性和环境影响
- 环境影响评估
- 社会影响力和社区服务
- 公司管治与企业社会责任
- 永续金融与投资趋势
- 案例研究
- 未来前景与机会
第四章 竞争情势
- 介绍
- 公司市占率分析
- 按地区
- 北美洲
- 欧洲
- 亚太地区
- 拉丁美洲
- 中东和非洲
- 按地区
- 主要企业的竞争分析
- 竞争定位矩阵
- 战略展望矩阵
- 主要趋势
- 企业合併(M&A)
- 商业伙伴关係与合作
- 新产品发布
- 企业扩张计画和资金筹措
第五章 依产品类型分類的市场估算与预测(2022-2035 年)
- 硬体
- 娱乐
- 医疗保健
- 饭店业
- 零售
- 旅行
- 其他的
- 软体
- 服务
第六章 依支付方式分類的市场估算与预测(2022-2035 年)
- 现金制
- 无现金
- 询问
- 非接触式支付
- 杂交种
第七章 按模型分類的市场估算与预测(2022-2035 年)
- 独立型
- 壁挂式和桌面式
- 手机类型
第八章 按销售管道分類的市场估算与预测(2022-2035 年)
- 直销
- 间接销售
第九章 依自动驾驶等级分類的市场估算与预测(2022-2035 年)
- 半自动
- 全自动
第十章 按应用领域分類的市场估算与预测(2022-2035 年)
- 娱乐
- 医疗保健
- 饭店业
- 饭店
- 餐厅
- 其他的
- 零售
- 超级市场和大卖场
- 便利商店
- 百货公司
- 其他的
- 旅行
- 其他的
第十一章 各地区市场估计与预测(2022-2035 年)
- 北美洲
- 美国
- 加拿大
- 欧洲
- 德国
- 英国
- 法国
- 义大利
- 西班牙
- 俄罗斯
- 北欧国家
- 比荷卢经济联盟国家
- 亚太地区
- 中国
- 印度
- 日本
- 韩国
- 澳洲和纽西兰
- 新加坡
- 马来西亚
- 印尼
- 越南
- 泰国
- 拉丁美洲
- 巴西
- 墨西哥
- 阿根廷
- 哥伦比亚
- 中东和非洲
- 南非
- 沙乌地阿拉伯
- 阿拉伯聯合大公国
第十二章:公司简介
- 世界公司
- NCR Voyix
- Diebold Nixdorf
- Toshiba Global Commerce
- Fujitsu
- ITAB
- IBM
- Zebra Technologies
- Verifone
- Glory
- StrongPoint ASA
- Honeywell
- Pan-Oston
- DXC Technology
- 本地公司
- Qingdao CCL Technology
- HiStone POS
- Qingdao Wintec System
- Pyramid Computer
- Hisense Systems
- ECR Software
- PCMS
- 新兴企业
- Mashgin
- Zippin
- Trigo
- Standard Cognition
- ShelfX
The Global Self-Checkout System Market was valued at USD 5.3 billion in 2025 and is estimated to grow at a CAGR of 13.7% to reach USD 18.8 billion by 2035.
Growth is driven by rising customer volumes across public and commercial environments, which place increasing pressure on traditional checkout counters. Managing long queues and overcrowding has become a major operational challenge, prompting organizations to adopt automated checkout solutions. Self-checkout systems enable faster transaction completion, minimize dependency on on-site staff, and significantly improve customer convenience. These systems also allow businesses to reassign employees to higher-value tasks, improving workforce efficiency. The market is increasingly shifting toward automated and cashless checkout environments as digital payment adoption rises globally. Contactless payment options and seamless transaction experiences are becoming core expectations, supporting widespread system deployment. As operational efficiency and customer experience remain top priorities, self-checkout solutions continue to gain traction as a strategic investment across multiple service-oriented industries.
| Market Scope | |
|---|---|
| Start Year | 2025 |
| Forecast Year | 2026-2035 |
| Start Value | $5.3 Billion |
| Forecast Value | $18.8 Billion |
| CAGR | 13.7% |
The hardware segment accounted for 61.4% share in 2025. Strong demand for reliable and durable checkout components continues to support this dominance. Integrated hardware systems that combine scanning, display, and payment functionality simplify installation and maintenance, making them highly attractive for high-traffic environments.
The retail segment reached USD 2.57 billion and represented 48.5% share in 2025. Retailers have adopted self-checkout systems extensively to accelerate transaction speed, reduce labor dependency, and handle high customer footfall efficiently.
U.S. Self-Checkout System Market reached USD 1.75 billion in 2025. Market growth is supported by the strong presence of large-format retail operations and continuous investment in checkout automation. Technology providers increasingly prioritize the U.S. as a key revenue-generating region due to its advanced retail infrastructure and high adoption rates.
Key companies operating in the Self-Checkout System Market include Toshiba Global Commerce, Diebold Nixdorf, NCR Voyix, Fujitsu, ITAB, StrongPoint ASA, Pan-Oston, ECR Software, Wintec, and HiStone POS. Companies in the Self-Checkout System Market strengthen their competitive position through continuous hardware innovation and software integration. Manufacturers focus on developing robust, all-in-one systems that reduce installation complexity and improve uptime. Investment in cashless and contactless payment compatibility enhances system relevance. Strategic partnerships with retailers support large-scale deployments and long-term contracts. Firms also emphasize modular designs that allow easy upgrades and scalability. Improving system accuracy, security, and user interface design helps boost customer acceptance. Expanding global distribution networks and providing strong after-sales support further reinforce market presence and customer loyalty.
Table of Contents
Chapter 1 Methodology
- 1.1 Market scope and definition
- 1.2 Research design
- 1.2.1 Research approach
- 1.2.2 Data collection methods
- 1.3 Data mining sources
- 1.3.1 Global
- 1.3.2 Regional/Country
- 1.4 Base estimates and calculations
- 1.4.1 Base year calculation
- 1.4.2 Key trends for market estimation
- 1.5 Primary research and validation
- 1.5.1 Primary sources
- 1.6 Forecast
- 1.7 Research assumptions and limitations
Chapter 2 Executive Summary
- 2.1 Industry 3600 synopsis
- 2.2 Key market trends
- 2.2.1 Regional
- 2.2.2 Offering
- 2.2.3 Transaction
- 2.2.4 Model
- 2.2.5 Sales Channel
- 2.2.6 Autonomy Level
- 2.2.7 Application
- 2.3 TAM analysis, 2026-2035
- 2.4 CXO perspectives: Strategic imperatives
- 2.4.1 Executive decision points
- 2.4.2 Critical success factors
- 2.5 Future outlook and recommendations
Chapter 3 Industry Insights
- 3.1 Industry ecosystem analysis
- 3.1.1 Supplier landscape
- 3.1.2 Profit margin
- 3.1.3 Cost structure
- 3.1.4 Value addition at each stage
- 3.1.5 Factor affecting the value chain
- 3.1.6 Disruptions
- 3.2 Industry impact forces
- 3.2.1 Growth drivers
- 3.2.1.1 Rising demand for contactless and faster checkout experience
- 3.2.1.2 Growing adoption of automation in retail stores
- 3.2.1.3 Reduced operational costs for retailers
- 3.2.1.4 Expansion of supermarkets, hypermarkets, and convenience stores
- 3.2.2 Industry pitfalls and challenges
- 3.2.2.1 High initial deployment and maintenance costs
- 3.2.2.2 Limited adoption in small and budget-constrained retailers
- 3.2.3 Market opportunities
- 3.2.3.1 Growing demand from emerging markets and developing economies
- 3.2.3.2 Rising adoption in non-retail segments
- 3.2.3.3 Expansion of AI-powered autonomous checkout solutions
- 3.2.3.4 Integration with mobile apps, loyalty programs, and analytics
- 3.2.1 Growth drivers
- 3.3 Growth potential analysis
- 3.4 Regulatory landscape
- 3.4.1 North America
- 3.4.1.1 PCI Data Security Standard (PCI DSS)
- 3.4.1.2 US State-Level Legislation
- 3.4.1.3 Canadian PIPEDA
- 3.4.2 Europe
- 3.4.2.1 EU General Data Protection Regulation (GDPR)
- 3.4.2.2 EU AI Act
- 3.4.2.3 UK Digital Identity and Attributes Trust Framework
- 3.4.2.4 Payment Services Directive 2 (PSD2)
- 3.4.3 Asia Pacific
- 3.4.3.1 China's Cybersecurity Law (CSL)
- 3.4.3.2 Local Digital Payment Integration Standards
- 3.4.4 Latin America
- 3.4.4.1 Brazil PIX instant payment system security requirements
- 3.4.4.2 Mandatory Two-Factor Authentication (2FA)
- 3.4.5 Middle East & Africa
- 3.4.5.1 GCC National Payment Security Frameworks
- 3.4.5.2 South Africa's Protection of Personal Information Act (POPIA)
- 3.4.1 North America
- 3.5 Porter's analysis
- 3.6 PESTEL analysis
- 3.7 Technology and innovation landscape
- 3.7.1 Current technological trends
- 3.7.2 Emerging technologies
- 3.8 Price trends
- 3.8.1 By region
- 3.8.2 By product
- 3.9 Cost breakdown analysis
- 3.10 Sustainability and environmental impact
- 3.10.1 Environmental impact assessment
- 3.10.2 Social impact & community benefits
- 3.10.3 Governance & corporate responsibility
- 3.10.4 Sustainable finance & investment trends
- 3.11 Case studies
- 3.12 Future outlook & opportunities
Chapter 4 Competitive Landscape, 2025
- 4.1 Introduction
- 4.2 Company market share analysis
- 4.2.1 North America
- 4.2.2 Europe
- 4.2.3 Asia Pacific
- 4.2.4 LATAM
- 4.2.5 MEA
- 4.3 Competitive analysis of major market players
- 4.4 Competitive positioning matrix
- 4.5 Strategic outlook matrix
- 4.6 Key developments
- 4.6.1 Mergers & acquisitions
- 4.6.2 Partnerships & collaborations
- 4.6.3 New product launches
- 4.6.4 Expansion plans and funding
Chapter 5 Market Estimates & Forecast, By Offering, 2022 - 2035 ($Bn, Units)
- 5.1 Key trends
- 5.2 Hardware
- 5.2.1 Entertainment
- 5.2.2 Healthcare
- 5.2.3 Hospitality
- 5.2.4 Retail
- 5.2.5 Travel
- 5.2.6 Others
- 5.3 Software
- 5.4 Services
Chapter 6 Market Estimates & Forecast, By Transaction, 2022 - 2035 ($Bn, Units)
- 6.1 Key trends
- 6.2 Cash-based
- 6.3 Cashless
- 6.3.1 Contact
- 6.3.2 Contactless
- 6.3.3 Hybrid
Chapter 7 Market Estimates & Forecast, By Model, 2022 - 2035 ($Bn, Units)
- 7.1 Key trends
- 7.2 Standalone
- 7.3 Wall-mounted or countertop
- 7.4 Mobile
Chapter 8 Market Estimates & Forecast, By Sales Channel, 2022 - 2035 ($Bn, Units)
- 8.1 Key trends
- 8.2 Direct
- 8.3 Indirect
Chapter 9 Market Estimates & Forecast, By Autonomy Level, 2022 - 2035 ($Bn, Units)
- 9.1 Key trends
- 9.2 Semi-automated
- 9.3 fully-automated
Chapter 10 Market Estimates & Forecast, By Application, 2022 - 2035 ($Bn, Units)
- 10.1 Key trends
- 10.2 Entertainment
- 10.3 Healthcare
- 10.4 Hospitality
- 10.4.1 Hotel
- 10.4.2 Restaurants
- 10.4.3 Others
- 10.5 Retail
- 10.5.1 Supermarkets & Hypermarkets
- 10.5.2 Convenience Stores
- 10.5.3 Department Stores
- 10.5.4 Others
- 10.6 Travel
- 10.7 Others
Chapter 11 Market Estimates & Forecast, By Region, 2022 - 2035 ($Bn, Units)
- 11.1 Key trends
- 11.2 North America
- 11.2.1 US
- 11.2.2 Canada
- 11.3 Europe
- 11.3.1 Germany
- 11.3.2 UK
- 11.3.3 France
- 11.3.4 Italy
- 11.3.5 Spain
- 11.3.6 Russia
- 11.3.7 Nordics
- 11.3.8 Benelux
- 11.4 Asia Pacific
- 11.4.1 China
- 11.4.2 India
- 11.4.3 Japan
- 11.4.4 South Korea
- 11.4.5 ANZ
- 11.4.6 Singapore
- 11.4.7 Malaysia
- 11.4.8 Indonesia
- 11.4.9 Vietnam
- 11.4.10 Thailand
- 11.5 Latin America
- 11.5.1 Brazil
- 11.5.2 Mexico
- 11.5.3 Argentina
- 11.5.4 Colombia
- 11.6 MEA
- 11.6.1 South Africa
- 11.6.2 Saudi Arabia
- 11.6.3 UAE
Chapter 12 Company Profiles
- 12.1 Global companies
- 12.1.1 NCR Voyix
- 12.1.2 Diebold Nixdorf
- 12.1.3 Toshiba Global Commerce
- 12.1.4 Fujitsu
- 12.1.5 ITAB
- 12.1.6 IBM
- 12.1.7 Zebra Technologies
- 12.1.8 Verifone
- 12.1.9 Glory
- 12.1.10 StrongPoint ASA
- 12.1.11 Honeywell
- 12.1.12 Pan-Oston
- 12.1.13 DXC Technology
- 12.2 Regional companies
- 12.2.1 Qingdao CCL Technology
- 12.2.2 HiStone POS
- 12.2.3 Qingdao Wintec System
- 12.2.4 Pyramid Computer
- 12.2.5 Hisense Systems
- 12.2.6 ECR Software
- 12.2.7 PCMS
- 12.3 Emerging companies
- 12.3.1 Mashgin
- 12.3.2 Zippin
- 12.3.3 Trigo
- 12.3.4 Standard Cognition
- 12.3.5 ShelfX
 自助结帐系统系统市场分析及预测(至2035年):依类型、产品类型、服务、技术、组件、应用、部署类型、最终用户、功能及安装类型划分
 2026年全球自助结帐系统市场报告
 自助结帐系统市场 - 全球产业规模、份额、趋势、机会、预测:按产品、交易类型、型号、最终用户、地区和竞争格局划分,2021-2031年
 自助结帐系统市场规模、占有率、成长及全球产业分析:依类型、应用和地区划分的洞察与预测(2026-2034)
 自助结帐系统市场报告(按产品、型号、安装类型、最终用户和地区)2025 年至 2033 年
 自助结帐系统系统的全球市场评估,各零件,交易类别,模式类别,各终端用户产业,各地区,机会,预测,2018年~2032年
 自助结帐系统市场,按产品、按交易、按型号、按应用、按国家和地区 - 2025 年至 2032 年全球行业分析、市场规模、市场份额和预测
 自助结帐系统系统市场规模、份额、趋势分析报告:按组件、类型、应用、地区、细分市场预测,2025-2030 年
 自助结帐系统系统:市场占有率分析、产业趋势/统计、成长预测(2025-2030)美国自助结帐系统系统市场规模、份额、趋势分析报告:按组件、类型、应用和细分市场预测,2025-2030 年