


 |
市场调查报告书
商品编码
1913472
干散货航运市场机会、成长要素、产业趋势分析及预测(2026年至2035年)Dry Bulk Shipping Market Opportunity, Growth Drivers, Industry Trend Analysis, and Forecast 2026 - 2035 |
||||||
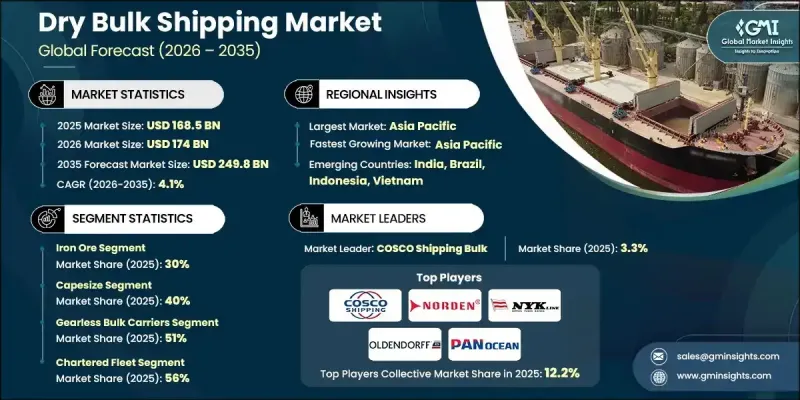
全球干散货航运市场预计到 2025 年将达到 1,685 亿美元,到 2035 年将达到 2,498 亿美元,年复合成长率为 4.1%。
市场发展与全球贸易活动和不断演变的法规结构密切相关,这些因素正在重塑船队营运和租船趋势。船舶能源效率和排放性能方面的合规要求正日益影响船舶部署决策和营运成本。据报道,全球干散装货船队中很大一部分的能源效率低于推荐基准,这促使船东加快投资,以提高燃油效率和实现船队现代化。针对能源效率和碳排放强度的监管措施正在推动环保船舶的引入,从而显着降低燃油消费量和排放。此外,支援更高效船队营运的数位化海事技术的整合正在提升行业绩效。先进的分析和管理平台有助于优化航线、维护计划和燃油管理,并有助于应对拥塞挑战和运费波动。这些因素共同作用,使效率、合规性和数位化能力成为塑造干散货航运市场长期发展的核心驱动力。
| 市场覆盖范围 | |
|---|---|
| 开始年份 | 2025 |
| 预测年份 | 2026-2035 |
| 起始值 | 1685亿美元 |
| 预测金额 | 2498亿美元 |
| 复合年增长率 | 4.1% |
2025年,大型干散货航运将占据45%的市场份额,并将采用船队管理和预测分析解决方案进行营运。据悉,这些系统能够帮助航运公司改善航程规划、减少非计画性停机时间、高效管理燃油消耗,并减轻港口拥塞和运费波动造成的损失。
预计到2025年,好望角型散装货船市占率将达到40%,2026年至2035年的复合年增长率将达到4.3%。就载货量而言,好望角型散装货船是干散货船队中最大的船型。根据业内估计,到2024年,这类船舶将占全球干散货船队总载重吨位的约40%,主要用于支持主要国际贸易走廊的长途运输。
预计到2025年,无齿轮传动散装货船市场占有率将达到51%。这类船舶的特色是船上没有货物装卸设施,2024年其载重吨位占全球干散货总载重吨位的55%。它们的广泛应用归功于其高营运效率和与现代港口基础设施的兼容性。
预计到 2025 年,中国干散货航运市场将占全球市场的 66%,创造 538 亿美元的收入。中国的主导地位源自于其作为关键原料进口大国的地位:官方贸易数据显示,中国 2024 年将进口超过 12 亿吨铁矿石,约占全球海运量的 70%。
目录
第一章调查方法
第二章执行摘要
第三章业界考察
- 生态系分析
- 供应商情况
- 利润率分析
- 成本结构
- 每个阶段的附加价值
- 影响价值链的因素
- 中断
- 产业影响因素
- 司机
- 全球海上贸易日益增长
- 工业和钢铁生产成长
- 扩大农业贸易
- 舰队现代化和效率
- 产业潜在风险与挑战
- 港口拥挤和基础设施瓶颈
- 包机费率波动
- 市场机会
- 船队更新环保高效船舶
- 贸易路线多元化
- 与数位化航运解决方案集成
- 成长潜力分析
- 监管环境
- 北美洲
- 美国海岸警卫队防卫队(USCG)海上安全条例
- 美国环保署(EPA)船舶排放标准
- 琼斯法案合规性和沿海航运规则
- 欧洲
- 欧洲海事安全局 (EMSA) 指南
- 欧盟硫排放法规及《国际防止船舶造成污染公约》附则六标准
- 欧盟船舶安全认证条例
- 欧盟型式核准和船旗国要求
- 遵守压舱水管理公约
- 港口国调查(PSC)
- 亚太地区
- 中国船舶排放标准与MARPOL合规性
- 印度航运总局规章
- 日本船舶安全与燃油效率标准
- 东协海事法规和区域准则
- 大型船舶作业安全标准
- 拉丁美洲
- 巴西国家水路运输局 (ANTAQ) 标准
- 阿根廷船舶安全与环境法规
- 墨西哥交通运输部部(SCT)船舶标准
- 南方共同市场海运法规的一致性
- 中东和非洲
- 阿拉伯联合大公国联邦海事法
- 沙乌地阿拉伯港务局和海事法规
- 南非海事安全局 (SAMSA) 条例
- 东非共同体(EAC)海事和航运标准
- 北美洲
- 波特五力分析
- PESTEL 分析
- 科技与创新趋势
- 当前技术趋势
- 新兴技术
- 价格趋势
- 按地区
- 副产品
- 成本細項分析
- 船舶购置成本
- 船员和人员配备成本
- 营运和维护成本
- 监理和合规成本
- 燃料和船用燃料成本
- 专利分析
- 永续性和环境方面
- 永续实践
- 减少废弃物策略
- 生产中的能源效率
- 环保倡议
- 碳足迹考量
- 干散货航运脱碳之路
- 国际海事组织(IMO)2030/2050目标的影响
- 燃料选择:液化天然气、甲醇、氨、生质燃料
- 改造与新建建筑脱碳的经济比较
- 碳定价及其对排放权交易体系(ETS)的影响
- 舰队供需平衡与订单分析
- 平衡车队运作和需求成长
- 按船舶等级分析订单
- 拆除和处置趋势
- 净船队成长预测(2026-2035 年)
- 运费和租船合约分析
- 定期租船和单次航次合约的趋势
- 现货和合约市场分析
- 波罗的海干散货指数(BDI)历史资料及预测
- 票价波动及风险缓解策略
- 租船人和船东之间的谈判动态
- 新船和造船厂现状
- 按船厂和国家订单状态
- 新船价趋势
- 船厂产能受限
- 交货延误及延误风险
第四章 竞争情势
- 介绍
- 公司市占率分析
- 北美洲
- 欧洲
- 亚太地区
- 拉丁美洲
- 中东和非洲
- 主要市场公司的竞争分析
- 竞争定位矩阵
- 战略展望矩阵
- 重大进展
- 併购
- 伙伴关係与合作
- 新产品发布
- 企业扩张计画和资金筹措
第五章 2022-2035年按产品分類的市场估算与预测
- 铁矿石
- 煤炭
- 粮食
- 矾土
- 镍
- 钢
- 肥料
- 其他的
第六章 按船舶类型分類的市场估算与预测,2022-2035年
- 好望角型
- 尺寸方便携带
- 巴拿马型
- 轻便极限型型
- 其他的
7. 2022-2035年按设计分類的市场估算与预测
- 无齿轮传动散货船
- 传统散装货船
- 复合散货船
- 自排放
- 布尔克湖人队
- 其他的
第八章 2022-2035年各细分市场的估计与预测
- 自有车辆
- 包租船队
第九章 依贸易路线分類的市场估计与预测,2022-2035年
- 长途贸易
- 近海贸易
第十章 2022-2035年各地区市场估计与预测
- 北美洲
- 美国
- 加拿大
- 欧洲
- 德国
- 英国
- 法国
- 义大利
- 西班牙
- 俄罗斯
- 北欧国家
- 荷兰
- 瑞典
- 亚太地区
- 中国
- 印度
- 日本
- 澳洲
- 韩国
- 新加坡
- 泰国
- 印尼
- 越南
- 拉丁美洲
- 巴西
- 墨西哥
- 阿根廷
- 中东和非洲
- 南非
- 沙乌地阿拉伯
- 阿拉伯聯合大公国
- 土耳其
第十一章 公司简介
- 世界玩家
- COSCO Shipping Bulk
- Oldendorff Carriers
- Pacific Basin
- Star Bulk
- Golden Ocean
- Diana Shipping
- Genco Shipping &Trading
- Bahri Dry Bulk
- Polsteam
- Eastern Bulk
- 区域玩家
- Eagle Bulk Shipping
- Navios Maritime Partners
- Safe Bulkers
- Fednav
- Belships
- 新兴企业/颠覆者
- Scorpio Bulkers
- Ultrabulk
- Western Bulk
- Wilson Shipping
- VARAMAR
The Global Dry Bulk Shipping Market was valued at USD 168.5 billion in 2025 and is estimated to grow at a CAGR of 4.1% to reach USD 249.8 billion by 2035.
Market development is closely tied to global trade activity and evolving regulatory frameworks that are reshaping fleet operations and charter dynamics. Compliance requirements related to vessel efficiency and emissions performance are increasingly influencing deployment decisions and operating costs. A large share of the global dry bulk fleet is reported to fall below preferred efficiency ratings, prompting shipowners to accelerate investments aimed at improving fuel performance and modernizing fleets. Regulatory measures targeting energy efficiency and carbon intensity have driven higher adoption of environmentally optimized vessels, contributing to measurable reductions in fuel consumption and emissions. Industry performance is further being enhanced through the integration of digital shipping technologies that support more efficient fleet utilization. Advanced analytics and management platforms are improving route optimization, maintenance planning, and fuel management, while also helping operators respond to congestion challenges and fluctuating freight conditions. These combined factors are positioning efficiency, compliance, and digital capability as central drivers shaping the long-term evolution of the dry bulk shipping market.
| Market Scope | |
|---|---|
| Start Year | 2025 |
| Forecast Year | 2026-2035 |
| Start Value | $168.5 Billion |
| Forecast Value | $249.8 Billion |
| CAGR | 4.1% |
The large dry bulk vessels segment held 45% share in 2025, operating with fleet management and predictive analytics solutions. These systems are described as enabling shipping companies to enhance voyage planning, reduce unplanned downtime, manage fuel usage more effectively, and limit disruptions caused by congestion at merchant ports and volatile freight rates.
The capesize segment held 40% share in 2025 and is projected to grow at a CAGR of 4.3% from 2026 to 2035. Capesize vessels are identified as the largest category within the dry bulk fleet by carrying capacity. Industry assessments indicate that these vessels represented approximately 40% of global dry bulk fleet deadweight tonnage in 2024, primarily supporting long-haul transportation along major international trade corridors.
The gearless bulk carriers segment held a 51% share in 2025. These vessels are characterized by the absence of onboard cargo-handling equipment and represented 55% of total global dry bulk cargo deadweight tonnage in 2024. Their widespread use is attributed to operational efficiency and compatibility with modern port infrastructure.
China Dry Bulk Shipping Market held 66% share, generating USD 53.8 billion in 2025. The country's dominance is linked to its role as a major importer of key raw materials. Official trade data indicate that more than 1.2 billion tons of iron ore were imported in 2024, representing close to 70% of global seaborne volumes.
Key participants active in the Global Dry Bulk Shipping Market include COSCO Shipping Bulk, Star Bulk, Pacific Basin, Oldendorff Carriers, Golden Ocean, Diana Shipping, Genco Shipping & Trading, Polsteam, Bahri, and Eastern Bulk. Companies operating in the Global Dry Bulk Shipping Market are strengthening their market position by prioritizing fleet efficiency, regulatory compliance, and digital transformation. Many operators are investing in newer vessels and retrofitting existing fleets to improve energy performance and meet evolving environmental standards. Adoption of data-driven fleet management platforms is being used to enhance operational visibility and cost control. Strategic fleet renewal programs and long-term charter agreements are helping stabilize earnings and reduce exposure to market volatility. Geographic diversification of trade routes is also being pursued to balance demand fluctuations.
Table of Contents
Chapter 1 Methodology
- 1.1 Research approach
- 1.2 Quality Commitments
- 1.2.1 GMI AI policy & data integrity commitment
- 1.2.1.1 Source consistency protocol
- 1.2.1 GMI AI policy & data integrity commitment
- 1.3 Research Trail & Confidence Scoring
- 1.3.1 Research Trail Components
- 1.3.2 Scoring Components
- 1.4 Data Collection
- 1.4.1 Partial list of primary sources
- 1.5 Data mining sources
- 1.5.1 Paid sources
- 1.5.1.1 Sources, by region
- 1.5.1 Paid sources
- 1.6 Base estimates and calculations
- 1.6.1 Base year calculation for any one approach
- 1.7 Forecast model
- 1.7.1 Quantified market impact analysis
- 1.7.1.1 Mathematical impact of growth parameters on forecast
- 1.7.1 Quantified market impact analysis
- 1.8 Research transparency addendum
- 1.8.1 Source attribution framework
- 1.8.2 Quality assurance metrics
- 1.8.3 Our commitment to trust
Chapter 2 Executive Summary
- 2.1 Industry 360° synopsis, 2022 - 2035
- 2.2 Key market trends
- 2.2.1 Regional
- 2.2.2 Commodity
- 2.2.3 Vessel
- 2.2.4 Design
- 2.2.5 Operation
- 2.2.6 Trade Route
- 2.3 TAM Analysis, 2026-2035
- 2.4 CXO perspectives: Strategic imperatives
- 2.4.1 Executive decision points
- 2.4.2 Critical success factors
- 2.5 Future outlook and strategic recommendations
Chapter 3 Industry Insights
- 3.1 Industry ecosystem analysis
- 3.1.1 Supplier landscape
- 3.1.2 Profit margin analysis
- 3.1.3 Cost structure
- 3.1.4 Value addition at each stage
- 3.1.5 Factor affecting the value chain
- 3.1.6 Disruptions
- 3.2 Industry impact forces
- 3.2.1.1 Growth drivers
- 3.2.1.2 Increasing global seaborne trade
- 3.2.1.3 Industrial and steel production growth
- 3.2.1.4 Expanding agricultural trade
- 3.2.1.5 Fleet modernization and efficiency
- 3.2.2 Industry pitfalls and challenges
- 3.2.2.1 Port congestion and infrastructure bottlenecks
- 3.2.2.2 Volatility in charter rates
- 3.2.3 Market opportunities
- 3.2.3.1 Fleet renewal and eco-efficient vessels
- 3.2.3.2 Trade route diversification
- 3.2.3.3 Integration with digital shipping solutions
- 3.3 Growth potential analysis
- 3.4 Regulatory landscape
- 3.4.1 North America
- 3.4.1.1 US Coast Guard (USCG) Maritime Safety Regulations
- 3.4.1.2 Environmental Protection Agency (EPA) Vessel Emission Standards
- 3.4.1.3 Jones Act Compliance and Cabotage Rules
- 3.4.2 Europe
- 3.4.2.1 European Maritime Safety Agency (EMSA) Guidelines
- 3.4.2.2 EU Sulphur Directive and MARPOL Annex VI Standards
- 3.4.2.3 EU Ship Safety Certification Regulations
- 3.4.2.4 EU Type Approval and Flag State Requirements
- 3.4.2.5 Ballast Water Management Convention Compliance
- 3.4.2.6 Port State Control (PSC) Inspections
- 3.4.3 Asia Pacific
- 3.4.3.1 China Ship Emission Standards and MARPOL Compliance
- 3.4.3.2 India Directorate General of Shipping Regulations
- 3.4.3.3 Japan Ship Safety and Fuel Efficiency Standards
- 3.4.3.4 ASEAN Maritime Regulations and Regional Guidelines
- 3.4.3.5 Heavy and Large Vessel Operational Safety Standards
- 3.4.4 Latin America
- 3.4.4.1 Brazil National Agency for Waterway Transportation (ANTAQ) Standards
- 3.4.4.2 Argentina Ship Safety and Environmental Regulations
- 3.4.4.3 Mexico Secretariat of Communications and Transport (SCT) Vessel Standards
- 3.4.4.4 MERCOSUR Maritime Transport Regulatory Alignment
- 3.4.5 Middle East & Africa
- 3.4.5.1 UAE Federal Maritime Law
- 3.4.5.2 Saudi Ports Authority and Shipping Regulations
- 3.4.5.3 South African Maritime Safety Authority (SAMSA) Regulations
- 3.4.5.4 East African Community (EAC) Maritime and Vessel Standards
- 3.4.1 North America
- 3.5 Porter's analysis
- 3.6 PESTEL analysis
- 3.7 Technology and innovation landscape
- 3.7.1 Current technological trends
- 3.7.2 Emerging technologies
- 3.8 Price trends
- 3.8.1 By region
- 3.8.2 By product
- 3.9 Cost breakdown analysis
- 3.9.1 Vessel acquisition costs
- 3.9.2 Crew and staffing costs
- 3.9.3 Operational and maintenance costs
- 3.9.4 Regulatory and compliance costs
- 3.9.5 Fuel and bunker costs
- 3.10 Patent analysis
- 3.11 Sustainability and environmental aspects
- 3.11.1 Sustainable practices
- 3.11.2 Waste reduction strategies
- 3.11.3 Energy efficiency in production
- 3.11.4 Eco-friendly Initiatives
- 3.11.5 Carbon footprint considerations
- 3.12 Decarbonization pathways for dry bulk shipping
- 3.12.1 IMO 2030 / 2050 targets impact
- 3.12.2 Fuel options: LNG, methanol, ammonia, biofuels
- 3.12.3 Retrofit vs newbuild decarbonization economics
- 3.12.4 Carbon pricing and ETS exposure
- 3.13 Fleet Supply-Demand Balance & Orderbook Analysis
- 3.13.1 Active fleet vs demand growth balance
- 3.13.2 Orderbook analysis by vessel class
- 3.13.3 Scrapping and demolition trends
- 3.13.4 Net fleet growth outlook (2026-2035)
- 3.14 Freight Rate & Chartering Analysis
- 3.14.1 Time charter vs. voyage charter trends
- 3.14.2 Spot market and contract market analysis
- 3.14.3 Historical Baltic Dry Index (BDI) trends and projections
- 3.14.4 Freight rate volatility and risk mitigation strategies
- 3.14.5 Charterer-shipowner bargaining dynamics
- 3.15 Newbuilding and shipyard landscape
- 3.15.1 Orderbook by shipyard and country
- 3.15.2 Newbuilding price trends
- 3.15.3 Shipyard capacity constraints
- 3.15.4 Delivery slippage and delay risks
Chapter 4 Competitive Landscape, 2025
- 4.1 Introduction
- 4.2 Company market share analysis
- 4.2.1 North America
- 4.2.2 Europe
- 4.2.3 Asia Pacific
- 4.2.4 LATAM
- 4.2.5 MEA
- 4.3 Competitive analysis of major market players
- 4.4 Competitive positioning matrix
- 4.5 Strategic outlook matrix
- 4.6 Key developments
- 4.6.1 Mergers & acquisitions
- 4.6.2 Partnerships & collaborations
- 4.6.3 New Product Launches
- 4.6.4 Expansion Plans and funding
Chapter 5 Market Estimates & Forecast, By Commodity, 2022 - 2035 (USD Mn, Tons)
- 5.1 Key trends
- 5.2 Iron Ore
- 5.3 Coal
- 5.4 Grains
- 5.5 Bauxite
- 5.6 Nickel
- 5.7 Steel
- 5.8 Fertilizers
- 5.9 Others
Chapter 6 Market Estimates & Forecast, By Vessel, 2022 - 2035 (USD Mn, Tons)
- 6.1 Key trends
- 6.2 Capesize
- 6.3 Handysize
- 6.4 Panamax
- 6.5 Handymax
- 6.6 Others
Chapter 7 Market Estimates & Forecast, By Design, 2022 - 2035 (USD Mn, Tons)
- 7.1 Key trends
- 7.2 Gearless Bulk Carriers
- 7.3 Conventional Bulkers
- 7.4 Combined Bulk Carriers
- 7.5 Self-Dischargers
- 7.6 Bulker Lakers
- 7.7 Others
Chapter 8 Market Estimates & Forecast, By Operation, 2022 - 2035 (USD Mn, Tons)
- 8.1 Key trends
- 8.2 Owned Fleet
- 8.3 Chartered Fleet
Chapter 9 Market Estimates & Forecast, By Trade Route, 2022 - 2035 (USD Mn, Tons)
- 9.1 Key trends
- 9.2 Long-Haul Trade
- 9.3 Short-Sea Trade
Chapter 10 Market Estimates & Forecast, By Region, 2022 - 2035 (USD Mn, Tons)
- 10.1 Key trends
- 10.2 North America
- 10.2.1 US
- 10.2.2 Canada
- 10.3 Europe
- 10.3.1 Germany
- 10.3.2 UK
- 10.3.3 France
- 10.3.4 Italy
- 10.3.5 Spain
- 10.3.6 Russia
- 10.3.7 Nordics
- 10.3.8 Netherlands
- 10.3.9 Sweden
- 10.4 Asia Pacific
- 10.4.1 China
- 10.4.2 India
- 10.4.3 Japan
- 10.4.4 Australia
- 10.4.5 South Korea
- 10.4.6 Singapore
- 10.4.7 Thailand
- 10.4.8 Indonesia
- 10.4.9 Vietnam
- 10.5 Latin America
- 10.5.1 Brazil
- 10.5.2 Mexico
- 10.5.3 Argentina
- 10.6 MEA
- 10.6.1 South Africa
- 10.6.2 Saudi Arabia
- 10.6.3 UAE
- 10.6.4 Turkey
Chapter 11 Company Profiles
- 11.1 Global Players
- 11.1.1 COSCO Shipping Bulk
- 11.1.2 Oldendorff Carriers
- 11.1.3 Pacific Basin
- 11.1.4 Star Bulk
- 11.1.5 Golden Ocean
- 11.1.6 Diana Shipping
- 11.1.7 Genco Shipping & Trading
- 11.1.8 Bahri Dry Bulk
- 11.1.9 Polsteam
- 11.1.10 Eastern Bulk
- 11.2 Regional Players
- 11.2.1 Eagle Bulk Shipping
- 11.2.2 Navios Maritime Partners
- 11.2.3 Safe Bulkers
- 11.2.4 Fednav
- 11.2.5 Belships
- 11.3 Emerging Players / Disruptors
- 11.3.1 Scorpio Bulkers
- 11.3.2 Ultrabulk
- 11.3.3 Western Bulk
- 11.3.4 Wilson Shipping
- 11.3.5 VARAMAR


