


 |
市场调查报告书
商品编码
1928877
环境感测器市场机会、成长要素、产业趋势分析及2026年至2035年预测Environmental Sensors Market Opportunity, Growth Drivers, Industry Trend Analysis, and Forecast 2026 - 2035 |
||||||
全球环境感测器市场预计到 2025 年将达到 22 亿美元,到 2035 年将达到 63 亿美元,年复合成长率为 11.1%。
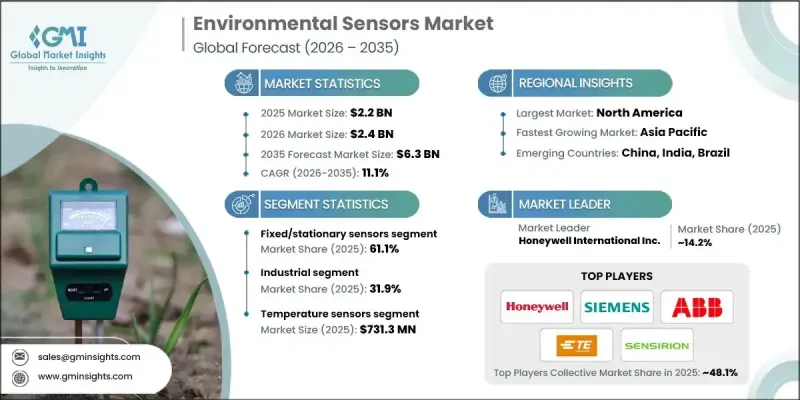
市场成长的驱动因素包括:日益严格的工业排放法规、无线和互联感测平台的普及、农业领域环境监测的日益广泛应用,以及智慧城市计划和物联网基础设施的加速部署。环境感测器在永续城市管理、工业安全和精密农业中正变得至关重要,能够即时监测空气品质、水资源、土壤健康和生物多样性。这推动了对互联感测器网路的需求,这些网路能够实现预测分析、优化营运和数据驱动的决策。预计到2030年,大多数城市和工业设施将依靠完全整合的感测器网路来提高多个领域的效率、安全性和永续性。
| 市场覆盖范围 | |
|---|---|
| 开始年份 | 2025 |
| 预测年份 | 2026-2035 |
| 起始值 | 22亿美元 |
| 预测金额 | 63亿美元 |
| 复合年增长率 | 11.1% |
预计到2025年,固定式感测器市场份额将达到61.1%。这些感测器广泛应用于工业工厂、市政系统以及用水和污水处理厂,用于提供连续、精确的监测。它们对于合规性、环境管理和製程控制至关重要,能够确保可靠运作并与自动化系统无缝整合。
预计到2025年,工业领域将占31.9%的市场份额。工业领域高度依赖环境感测器进行流程管理、排放控制、遵守安全标准、降低营运风险。严格的监管要求以及製造业、加工业和重工业等产业对高效安全营运的需求,是推动这项需求的主要因素。
预计到2025年,北美环境感测器市场占有率将达到29.8%。该地区的成长主要得益于严格的法规结构以及对空气品质、职场安全和排放控制日益增长的关注。在先进的智慧城市计画和监管合规要求的支持下,物联网无线感测器在城市规划、交通运输和工业应用中的普及速度正在加快。
目录
第一章调查方法和范围
第二章执行摘要
第三章业界考察
- 生态系分析
- 供应商情况
- 利润率
- 成本结构
- 每个阶段的附加价值
- 影响价值链的因素
- 中断
- 产业影响因素
- 司机
- 不断扩大的工业排放和安全法规
- 互联/无线工业感测平台的发展
- 农业领域环境感测技术的日益普及
- 对空气和水质合规性监测的需求日益增长
- 智慧城市和物联网基础设施应用成长
- 产业潜在风险与挑战
- 高精度、多参数感测解决方案高成本
- 互通性限制和校准复杂性
- 市场机会
- 将人工智慧驱动的预测分析整合到环境感测中
- 携带式和可穿戴感测设备的兴起
- 司机
- 成长潜力分析
- 监管环境
- 北美洲
- 欧洲
- 亚太地区
- 拉丁美洲
- 中东和非洲
- 波特分析
- PESTEL 分析
- 科技与创新趋势
- 当前技术趋势
- 新兴技术
- 价格趋势
- 按地区
- 副产品
- 定价策略
- 新兴经营模式
- 合规要求
- 专利和智慧财产权分析
- 地缘政治和贸易趋势
第四章 竞争情势
- 介绍
- 公司市占率分析
- 按地区
- 北美洲
- 欧洲
- 亚太地区
- 拉丁美洲
- 中东和非洲
- 市场集中度分析
- 按地区
- 主要企业的竞争标竿分析
- 财务绩效比较
- 收入
- 利润率
- 研究与开发
- 产品系列比较
- 产品线的广度
- 科技
- 创新
- 地理分布比较
- 全球扩张分析
- 服务网路覆盖
- 按地区分類的市场渗透率
- 竞争定位矩阵
- 领导企业
- 受让人
- 追踪者
- 小众玩家
- 战略展望矩阵
- 财务绩效比较
- 重大进展
- 併购
- 伙伴关係与合作
- 技术进步
- 扩张与投资策略
- 数位转型计划
- 新兴/Start-Ups竞赛的趋势
第五章 依感测器类型分類的市场估算与预测,2022-2035年
- 压力感测器
- 温度感测器
- 湿度感测器
- 气体感测器
- 噪音和声波感测器
- 震动和地震感测器
- 其他的
第六章 按类型分類的市场估算与预测,2022-2035年
- 固定/静止感测器
- 携带式/移动式感应器
第七章 依连接方式分類的市场估计与预测,2022-2035年
- 有线感应器
- 无线感测器
第八章 按应用领域分類的市场估算与预测,2022-2035年
- 空气品质监测
- 水质监测
- 土壤和土地监测
- 噪音和振动监测
- 天气和气象监测
- 其他的
9. 2022-2035年按最终用途产业分類的市场估算与预测
- 产业
- 化学製造
- 食品/饮料加工
- 製药生产
- 金属和采矿
- 纸浆和造纸
- 石油和天然气
- 其他的
- 能源与公共产业
- 发电
- 水和污水处理
- 可再生能源设施
- 其他的
- 智慧城市基础设施
- 城市空气品质网络
- 智慧水系统
- 交通/运输监控
- 其他的
- 建筑自动化
- 商业大楼和办公大楼
- 住宅
- 医院和医疗设施
- 资料中心
- 其他的
- 农业
- 精密农业
- 温室栽培可控农业
- 畜牧管理
- 水产养殖
- 其他的
第十章 2022-2035年各地区市场估计与预测
- 北美洲
- 我们
- 加拿大
- 欧洲
- 德国
- 英国
- 法国
- 西班牙
- 义大利
- 荷兰
- 亚太地区
- 中国
- 印度
- 日本
- 澳洲
- 韩国
- 拉丁美洲
- 巴西
- 墨西哥
- 阿根廷
- 中东和非洲
- 南非
- 沙乌地阿拉伯
- 阿拉伯聯合大公国
第十一章 公司简介
- 主要企业
- ABB Ltd.
- Honeywell International Inc.
- Siemens AG
- Texas Instruments Incorporated
- 按地区分類的主要企业
- 北美洲
- Analog Devices, Inc.
- Emerson Electric Co.
- TE Connectivity Ltd.
- NXP Semiconductors
- 亚太地区
- Murata Manufacturing Co., Ltd.
- Omron Corporation
- Renesas Electronics Corporation
- 欧洲
- ams-OSRAM AG
- Bosch Sensortec GmbH
- STMicroelectronics NV
- Sensirion AG
- 北美洲
- 小众玩家/颠覆者
- Amphenol Advanced Sensors
- Hach Company
- Vaisala
- Zebra Technologies
The Global Environmental Sensors Market was valued at USD 2.2 billion in 2025 and is estimated to grow at a CAGR of 11.1% to reach USD 6.3 billion by 2035.
Market expansion is fueled by increasing industrial emission regulations, the rise of wireless and connected sensing platforms, greater adoption of environmental monitoring in agriculture, and the accelerated implementation of smart city projects and IoT-enabled infrastructure. Environmental sensors are becoming essential for sustainable urban management, industrial safety, and precision agriculture, allowing real-time monitoring of air quality, water resources, soil health, and biodiversity. The demand for connected sensor networks is growing, enabling predictive analytics, optimized operations, and data-driven decision-making. By 2030, most cities and industrial facilities are expected to rely on fully integrated sensor networks for enhanced efficiency, safety, and sustainability across multiple sectors.
| Market Scope | |
|---|---|
| Start Year | 2025 |
| Forecast Year | 2026-2035 |
| Start Value | $2.2 Billion |
| Forecast Value | $6.3 Billion |
| CAGR | 11.1% |
The fixed and stationary sensors segment accounted for 61.1% share in 2025. These sensors are widely used because they provide continuous, accurate monitoring in industrial plants, urban systems, and water and wastewater facilities. They are critical for regulatory compliance, environmental management, and process control, enabling reliable operations and seamless integration with automated systems.
The industrial sector held 31.9% share in 2025. Industries rely heavily on environmental sensors to manage processes, control emissions, comply with safety standards, and mitigate operational risks. Sectors such as manufacturing, processing, and heavy industry drive demand due to strict regulatory requirements and the need for efficient, safe operations.
North America Environmental Sensors Market held a 29.8% share in 2025. Growth in the region is driven by stringent regulatory frameworks, rising concern for air quality, workplace safety, and emissions control. Adoption of IoT-enabled and wireless sensors across urban planning, transportation, and industrial applications is accelerating, supported by advanced smart city initiatives and regulatory compliance requirements.
Leading companies in the Global Environmental Sensors Market include Honeywell International Inc., Siemens AG, Bosch Sensortec GmbH, Murata Manufacturing Co., Ltd., STMicroelectronics N.V., TE Connectivity Ltd., ABB Ltd., ams OSRAM AG, Analog Devices, Inc., NXP Semiconductors, Sensirion AG, Omron Corporation, Renesas Electronics Corporation, Emerson Electric Co., Hach Company, Zebra Technologies, Vaisala, and Texas Instruments Incorporated. Companies in the Global Environmental Sensors Market are strengthening their market position by focusing on product innovation, developing sensors with enhanced accuracy, wireless capabilities, and IoT integration. Many are investing in strategic partnerships with smart city planners and industrial operators to expand adoption. Geographic expansion into emerging regions with rising urbanization and industrialization is a key strategy. Firms are also emphasizing sustainable and energy-efficient sensor technologies to meet regulatory requirements and corporate ESG goals.
Table of Contents
Chapter 1 Methodology and Scope
- 1.1 Market scope and definition
- 1.2 Research design
- 1.2.1 Research approach
- 1.2.2 Data collection methods
- 1.3 Data mining sources
- 1.3.1 Global
- 1.3.2 Regional/Country
- 1.4 Base estimates and calculations
- 1.4.1 Base year calculation
- 1.4.2 Key trends for market estimation
- 1.5 Primary research and validation
- 1.5.1 Primary sources
- 1.6 Forecast model
- 1.7 Research assumptions and limitations
Chapter 2 Executive Summary
- 2.1 Industry 360° synopsis, 2022 - 2035
- 2.2 Key market trends
- 2.2.1 Sensor type trends
- 2.2.2 Type trends
- 2.2.3 Connectivity trends
- 2.2.4 Application trends
- 2.2.5 End Use industry trends
- 2.2.6 Regional trends
- 2.3 TAM Analysis, 2026-2035
- 2.4 CXO perspectives: Strategic imperatives
- 2.4.1 Executive decision points
- 2.4.2 critical success factors
- 2.5 Future outlook and strategic recommendations
Chapter 3 Industry Insights
- 3.1 Industry ecosystem analysis
- 3.1.1 Supplier Landscape
- 3.1.2 Profit Margin
- 3.1.3 Cost structure
- 3.1.4 Value addition at each stage
- 3.1.5 Factor affecting the value chain
- 3.1.6 Disruptions
- 3.2 Industry impact forces
- 3.2.1 Growth drivers
- 3.2.1.1 Expansion of industrial emissions and safety regulations
- 3.2.1.2 Growth of connected/wireless industrial sensing platforms
- 3.2.1.3 Increasing adoption of environmental sensing in agriculture
- 3.2.1.4 Rising demand for air and water quality compliance monitoring
- 3.2.1.5 Smart city and IoT infrastructure deployment growth
- 3.2.2 Industry pitfalls and challenges
- 3.2.2.1 High cost of precision and multi-parameter sensing solutions
- 3.2.2.2 Limited interoperability and calibration complexities
- 3.2.3 Market opportunities
- 3.2.3.1 Integration of AI-driven predictive analytics in environmental sensing
- 3.2.3.2 Expansion of portable and wearable sensing devices
- 3.2.1 Growth drivers
- 3.3 Growth potential analysis
- 3.4 Regulatory landscape
- 3.4.1 North America
- 3.4.2 Europe
- 3.4.3 Asia Pacific
- 3.4.4 Latin America
- 3.4.5 Middle East & Africa
- 3.5 Porter';s analysis
- 3.6 PESTEL analysis
- 3.7 Technology and Innovation landscape
- 3.7.1 Current technological trends
- 3.7.2 Emerging technologies
- 3.8 Price trends
- 3.8.1 By region
- 3.8.2 By product
- 3.9 Pricing Strategies
- 3.10 Emerging Business Models
- 3.11 Compliance Requirements
- 3.12 Patent and IP analysis
- 3.13 Geopolitical and trade dynamics
Chapter 4 Competitive Landscape, 2025
- 4.1 Introduction
- 4.2 Company market share analysis
- 4.2.1 By region
- 4.2.1.1 North America
- 4.2.1.2 Europe
- 4.2.1.3 Asia Pacific
- 4.2.1.4 Latin America
- 4.2.1.5 Middle East & Africa
- 4.2.2 Market concentration analysis
- 4.2.1 By region
- 4.3 Competitive benchmarking of key players
- 4.3.1 Financial performance comparison
- 4.3.1.1 Revenue
- 4.3.1.2 Profit margin
- 4.3.1.3 R&D
- 4.3.2 Product portfolio comparison
- 4.3.2.1 Product range breadth
- 4.3.2.2 Technology
- 4.3.2.3 Innovation
- 4.3.3 Geographic presence comparison
- 4.3.3.1 Global footprint analysis
- 4.3.3.2 Service network coverage
- 4.3.3.3 Market penetration by region
- 4.3.4 Competitive positioning matrix
- 4.3.4.1 Leaders
- 4.3.4.2 Challengers
- 4.3.4.3 Followers
- 4.3.4.4 Niche players
- 4.3.5 Strategic outlook matrix
- 4.3.1 Financial performance comparison
- 4.4 Key developments
- 4.4.1 Mergers and acquisitions
- 4.4.2 Partnerships and collaborations
- 4.4.3 Technological advancements
- 4.4.4 Expansion and investment strategies
- 4.4.5 Digital transformation initiatives
- 4.5 Emerging/ startup competitors landscape
Chapter 5 Market Estimates and Forecast, By Sensor Type, 2022 - 2035 (USD Million & Units)
- 5.1 Key trends
- 5.2 Pressure sensors
- 5.3 Temperature sensors
- 5.4 Humidity sensors
- 5.5 Gas sensors
- 5.6 Noise & acoustic sensors
- 5.7 Vibration & seismic sensors
- 5.8 Others
Chapter 6 Market Estimates and Forecast, By Type, 2022 - 2035 (USD Million & Units)
- 6.1 Key trends
- 6.2 Fixed/stationary sensors
- 6.3 Portable/mobile sensors
Chapter 7 Market Estimates and Forecast, By Connectivity, 2022 - 2035 (USD Million & Units)
- 7.1 Key trends
- 7.2 Wired sensors
- 7.3 Wireless sensors
Chapter 8 Market Estimates and Forecast, By Application, 2022 - 2035 (USD Million & Units)
- 8.1 Key trends
- 8.2 Air quality monitoring
- 8.3 Water quality monitoring
- 8.4 Soil & land monitoring
- 8.5 Noise & vibration monitoring
- 8.6 Weather & meteorological monitoring
- 8.7 Others
Chapter 9 Market Estimates and Forecast, By End Use Industry, 2022 - 2035 (USD Million & Units)
- 9.1 Key trends
- 9.2 Industrial
- 9.2.1 Chemical manufacturing
- 9.2.2 Food & beverage processing
- 9.2.3 Pharmaceutical manufacturing
- 9.2.4 Metals & mining
- 9.2.5 Pulp & paper
- 9.2.6 Oil & gas
- 9.2.7 Others
- 9.3 Energy & utilities
- 9.3.1 Power generation
- 9.3.2 Water & wastewater treatment
- 9.3.3 Renewable energy facilities
- 9.3.4 Others
- 9.4 Smart cities & infrastructure
- 9.4.1 Urban air quality networks
- 9.4.2 Smart water systems
- 9.4.3 Traffic & transportation monitoring
- 9.4.4 Others
- 9.5 Building automation
- 9.5.1 Commercial buildings & offices
- 9.5.2 Residential buildings
- 9.5.3 Hospitals & healthcare facilities
- 9.5.4 Data centers
- 9.5.5 Others
- 9.6 Agriculture
- 9.6.1 Precision farming
- 9.6.2 Greenhouse & controlled agriculture
- 9.6.3 Livestock management
- 9.6.4 Aquaculture
- 9.7 Others
Chapter 10 Market Estimates and Forecast, By Region, 2022 - 2035 (USD Million & Units)
- 10.1 Key trends
- 10.2 North America
- 10.2.1 U.S.
- 10.2.2 Canada
- 10.3 Europe
- 10.3.1 Germany
- 10.3.2 UK
- 10.3.3 France
- 10.3.4 Spain
- 10.3.5 Italy
- 10.3.6 Netherlands
- 10.4 Asia Pacific
- 10.4.1 China
- 10.4.2 India
- 10.4.3 Japan
- 10.4.4 Australia
- 10.4.5 South Korea
- 10.5 Latin America
- 10.5.1 Brazil
- 10.5.2 Mexico
- 10.5.3 Argentina
- 10.6 Middle East and Africa
- 10.6.1 South Africa
- 10.6.2 Saudi Arabia
- 10.6.3 UAE
Chapter 11 Company Profiles
- 11.1 Global Key Players
- 11.1.1 ABB Ltd.
- 11.1.2 Honeywell International Inc.
- 11.1.3 Siemens AG
- 11.1.4 Texas Instruments Incorporated
- 11.2 Regional key players
- 11.2.1 North America
- 11.2.1.1 Analog Devices, Inc.
- 11.2.1.2 Emerson Electric Co.
- 11.2.1.3 TE Connectivity Ltd.
- 11.2.1.4 NXP Semiconductors
- 11.2.2 Asia Pacific
- 11.2.2.1 Murata Manufacturing Co., Ltd.
- 11.2.2.2 Omron Corporation
- 11.2.2.3 Renesas Electronics Corporation
- 11.2.3 Europe
- 11.2.3.1 ams-OSRAM AG
- 11.2.3.2 Bosch Sensortec GmbH
- 11.2.3.3 STMicroelectronics N.V.
- 11.2.3.4 Sensirion AG
- 11.2.1 North America
- 11.3 Niche Players/Disruptors
- 11.3.1 Amphenol Advanced Sensors
- 11.3.2 Hach Company
- 11.3.3 Vaisala
- 11.3.4 Zebra Technologies
 2026年全球环境感测器市场报告
 太阳能感测器市场规模、份额和成长分析:按组件类型、感测器类型、技术、终端用户产业、地区划分 - 2026-2033 年产业预测
 环境感测器市场分析及预测(至2035年):依类型、产品类型、技术、组件、应用、最终用户、功能、安装类型、设备及解决方案划分
 全球储能安全与监控系统市场:预测(至2034年)-按电池类型、技术、应用和地区分類的分析2026年全球被动式空气监测感测器市场报告
 Wi-Fi 雨量计市场按产品类型、安装类型、分销管道、应用和最终用户划分,全球预测,2026-2032 年热敏电阻器感测器市场按感测器类型、材料体系、销售管道、电阻范围、应用和最终用户产业划分-2026-2032年全球预测
 全球环境感测器市场规模研究与预测(按类型和最终用户产业及区域划分)2025-2035 年
 环境感测器:市场份额分析、行业趋势、统计数据和成长预测(2025-2030 年)
 环境感测器市场规模、份额、成长分析、按类型、按部署、按应用、按行业、按地区 - 行业预测,2024-2031 年