


 |
市场调查报告书
商品编码
1928908
过氧乙酸市场机会、成长要素、产业趋势分析及2026年至2035年预测Peracetic Acid Market Opportunity, Growth Drivers, Industry Trend Analysis, and Forecast 2026 - 2035 |
||||||
全球过氧乙酸市场预计到 2025 年将达到 10 亿美元,到 2035 年将达到 22 亿美元,年复合成长率为 7.4%。
这一增长得益于对环保消毒剂日益增长的需求,以及食品安全和卫生法规执行的加强,尤其是在开发中国家。监管机构正在收紧污水处理和工业污水的要求,加速了其在市政和工业领域的应用。人们越来越关注传统消毒剂对健康和环境的影响,特别是那些会产生有害残留副产物的消毒剂,这使得过氧乙酸成为首选。其高效性、生物降解性和与法规结构的兼容性,正在巩固其在多个终端应用领域的地位。在医疗保健领域,感染预防仍然是重中之重,这推动了过氧乙酸在灭菌和卫生流程中的广泛应用,从而维持了稳定的需求。这些因素共同促进了过氧乙酸的长期成长,并扩大了其在全球的应用范围。
| 市场覆盖范围 | |
|---|---|
| 开始年份 | 2025 |
| 预测年份 | 2026-2035 |
| 起始值 | 10亿美元 |
| 预测金额 | 22亿美元 |
| 复合年增长率 | 7.4% |
溶液级过氧乙酸市占率占比高达71.5%,预计到2035年将以7.2%的复合年增长率成长。该级别产品凭藉其在卫生、医疗保健和工业消毒等广泛应用领域的兼容性,保持着主导地位。即用型配方有助于快速实施并简化操作流程,因此溶液级产品的需求持续成长。
预计到 2025 年,纯度为 5-15% 的产品将占市场份额的 60%,到 2035 年将以 7.1% 的复合年增长率增长。此纯度等级被广泛采用,因为它在抗菌性能、法规合规性和安全操作特性方面实现了有效平衡,使其适用于各种卫生和消毒应用。
到 2025 年,北美过氧乙酸市场将占 30.1% 的份额。不断发展的法规结构,尤其註重对已批准的消毒剂和残留水平的控制,尤其是在食品加工、医疗保健和工业卫生领域,正在支持该地区的成长。
目录
第一章调查方法和范围
第二章执行摘要
第三章业界考察
- 生态系分析
- 供应商情况
- 利润率
- 每个阶段的附加价值
- 影响价值链的因素
- 中断
- 产业影响因素
- 司机
- 产业潜在风险与挑战
- 市场机会
- 成长潜力分析
- 监管环境
- 北美洲
- 欧洲
- 亚太地区
- 拉丁美洲
- 中东和非洲
- 波特分析
- PESTEL 分析
- 价格趋势
- 按地区
- 依产品类型
- 未来市场趋势
- 科技与创新趋势
- 当前技术趋势
- 新兴技术
- 专利状态
- 贸易统计(HS编码)(註:仅提供主要国家的贸易统计)
- 主要进口国
- 主要出口国
- 永续性和环境方面
- 永续努力
- 减少废弃物策略
- 生产中的能源效率
- 环保倡议
- 考虑到碳足迹
第四章 竞争情势
- 介绍
- 公司市占率分析
- 按地区
- 北美洲
- 欧洲
- 亚太地区
- 拉丁美洲
- 中东和非洲
- 按地区
- 企业矩阵分析
- 主要市场公司的竞争分析
- 竞争定位矩阵
- 重大进展
- 併购
- 伙伴关係与合作
- 新产品发布
- 业务拓展计划
第五章 依产品类型分類的市场估算与预测,2022-2035年
- 溶液级
- 蒸馏级
- 其他的
6. 按纯度分類的市场估计与预测,2022-2035 年
- 纯度低于5%(低纯度)
- 纯度5%至15%(中等纯度)
- 高纯度(超过15%)
7. 2022-2035年按最终用途产业分類的市场估算与预测
- 卫生保健
- 医院表面消毒
- 手术器械的消毒
- 透析设备的消毒
- 製药无尘室卫生管理
- 食品/饮料加工
- 肉类/家禽加工
- 饮水卫生管理
- 乳製品设备清洁
- 蔬果清洗
- 水处理
- 水处理
- 污水处理
- 工业水处理
- 水产养殖水处理
- 纸浆和造纸
- 纸浆漂白
- 消毒纸机系统
- 再生纤维加工
- 使用 Slimside 和除臭剂
- 农业
- 采后农产品消毒
- 牲畜棚卫生管理
- 灌溉水处理
- 农业设备消毒
- 製药
- API合成
- 无尘室表面卫生管理
- 製药设备灭菌
- 包装设备消毒
- 化学过程
- 氧化剂
- 聚合催化剂
- 有机合成中间体
- 污水消毒
- 石油化学/石油和天然气
- 炼油厂污水消毒
- 管道污泥和生物膜清除
- 脱硫工艺
- 冷却水系统处理
第八章 2022-2035年各地区市场估算与预测
- 北美洲
- 我们
- 加拿大
- 欧洲
- 德国
- 英国
- 法国
- 西班牙
- 义大利
- 其他欧洲地区
- 亚太地区
- 中国
- 印度
- 日本
- 澳洲
- 韩国
- 亚太其他地区
- 拉丁美洲
- 巴西
- 墨西哥
- 阿根廷
- 其他拉丁美洲地区
- 中东和非洲
- 沙乌地阿拉伯
- 南非
- 阿拉伯聯合大公国
- 其他中东和非洲地区
第九章:公司简介
- Acuro Organics Limited
- Airedale Chemical
- Biosan LLC
- Christeyns
- Diversey Holdings
- Ecolab
- Enviro Tech Chemical Services
- Evonik Industries
- FMC Corporation
- Hydrite Chemical Co.
- Kemira
- Loeffler Chemical Corporation
- Mitsubishi Gas Chemical Company
- National Peroxide Limited
- SEITZ GmbH
- Solvay
- Sopura SA
- Spartan Chemical Company, Inc.
- Others
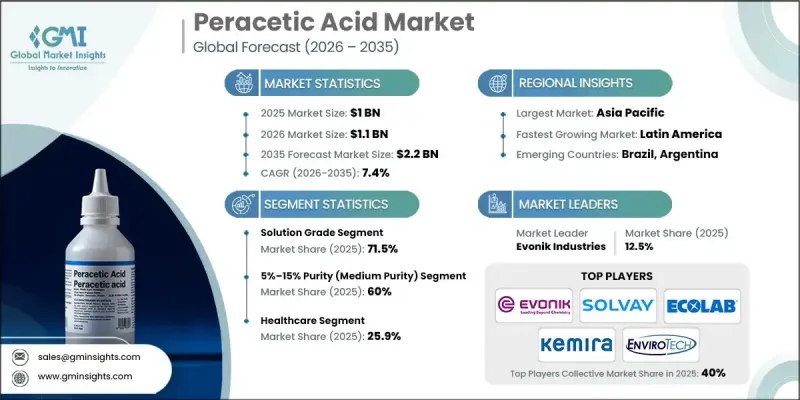
The Global Peracetic Acid Market was valued at USD 1 billion in 2025 and is estimated to grow at a CAGR of 7.4% to reach USD 2.2 billion by 2035.
Growth is supported by rising demand for environmentally responsible disinfectants and increasing enforcement of food safety and sanitation regulations, particularly in developing economies. Regulatory bodies are tightening requirements around wastewater treatment and industrial discharge, which is accelerating adoption across municipal and industrial applications. Peracetic acid is gaining preference as concerns rise over the health and environmental impact of conventional disinfectants, especially those associated with harmful residual byproducts. Its effectiveness, biodegradability, and compatibility with regulatory frameworks are strengthening its position across multiple end-use sectors. The healthcare sector continues to demonstrate consistent demand as infection prevention remains a priority, encouraging wider use of peracetic acid in sterilization and sanitation processes. Together, these factors are reinforcing long-term growth and expanding the application scope of peracetic acid globally.
| Market Scope | |
|---|---|
| Start Year | 2025 |
| Forecast Year | 2026-2035 |
| Start Value | $1 Billion |
| Forecast Value | $2.2 Billion |
| CAGR | 7.4% |
The solution-grade peracetic acid segment held 71.5% share and is expected to grow at a CAGR of 7.2% through 2035. This grade maintains its leading position due to its broad end-use compatibility across sanitation, healthcare, and industrial disinfection. Ready-to-use formulations support rapid deployment and simplify operational processes, which continues to drive preference for solution-grade products.
The 5%-15% purity range accounted for 60% share in 2025 and is forecast to grow at a CAGR of 7.1% by 2035. This purity level is widely adopted because it offers an effective balance between antimicrobial performance, regulatory compliance, and safe handling characteristics, making it suitable for a wide range of sanitation and disinfection applications.
North America Peracetic Acid Market held 30.1% share in 2025. Regional growth is supported by evolving regulatory frameworks that emphasize approved disinfectants and controlled residual levels, particularly across food processing, healthcare, and industrial sanitation operations.
Key companies operating in the Global Peracetic Acid Market include Solvay, Evonik Industries, Ecolab, Kemira, FMC Corporation, Diversey Holdings, Mitsubishi Gas Chemical Company, Hydrite Chemical Co., Enviro Tech Chemical Services, Spartan Chemical Company, Inc., Christeyns, Sopura S.A., Biosan LLC, Airedale Chemical, Acuro Organics Limited, Loeffler Chemical Corporation, National Peroxide Limited, and SEITZ GmbH. Companies in the Global Peracetic Acid Market are strengthening their competitive positions through capacity expansion, product optimization, and regulatory alignment. Manufacturers are investing in formulation improvements to enhance stability, safety, and application efficiency. Strategic focus on environmentally friendly and low-residue solutions is helping companies align with tightening regulations. Firms are expanding distribution networks and forming partnerships with industrial and municipal clients to secure long-term supply agreements.
Table of Contents
Chapter 1 Methodology & Scope
- 1.1 Market scope and definition
- 1.2 Research design
- 1.2.1 Research approach
- 1.2.2 Data collection methods
- 1.3 Data mining sources
- 1.3.1 Global
- 1.3.2 Regional/Country
- 1.4 Base estimates and calculations
- 1.4.1 Base year calculation
- 1.4.2 Key trends for market estimation
- 1.5 Primary research and validation
- 1.5.1 Primary sources
- 1.6 Forecast model
- 1.7 Research assumptions and limitations
Chapter 2 Executive Summary
- 2.1 Industry 360° synopsis
- 2.2 Key market trends
- 2.2.1 Regional
- 2.2.2 Product type
- 2.2.3 Purity
- 2.2.4 End Use industry
- 2.3 TAM Analysis, 2026-2035
- 2.4 CXO perspectives: Strategic imperatives
- 2.4.1 Executive decision points
- 2.4.2 Critical success factors
- 2.5 Future Outlook and Strategic Recommendations
Chapter 3 Industry Insights
- 3.1 Industry ecosystem analysis
- 3.1.1 Supplier landscape
- 3.1.2 Profit margin
- 3.1.3 Value addition at each stage
- 3.1.4 Factor affecting the value chain
- 3.1.5 Disruptions
- 3.2 Industry impact forces
- 3.2.1 Growth drivers
- 3.2.2 Industry pitfalls and challenges
- 3.2.3 Market opportunities
- 3.3 Growth potential analysis
- 3.4 Regulatory landscape
- 3.4.1 North America
- 3.4.2 Europe
- 3.4.3 Asia Pacific
- 3.4.4 Latin America
- 3.4.5 Middle East & Africa
- 3.5 Porter';s analysis
- 3.6 PESTEL analysis
- 3.7 Price trends
- 3.7.1 By region
- 3.7.2 By Product type
- 3.8 Future market trends
- 3.9 Technology and Innovation landscape
- 3.9.1 Current technological trends
- 3.9.2 Emerging technologies
- 3.10 Patent Landscape
- 3.11 Trade statistics (HS code) ( Note: the trade statistics will be provided for key countries only)
- 3.11.1 Major importing countries
- 3.11.2 Major exporting countries
- 3.12 Sustainability and environmental aspects
- 3.12.1 Sustainable practices
- 3.12.2 Waste reduction strategies
- 3.12.3 Energy efficiency in production
- 3.12.4 Eco-friendly initiatives
- 3.13 Carbon footprint consideration
Chapter 4 Competitive Landscape, 2025
- 4.1 Introduction
- 4.2 Company market share analysis
- 4.2.1 By region
- 4.2.1.1 North America
- 4.2.1.2 Europe
- 4.2.1.3 Asia Pacific
- 4.2.1.4 LATAM
- 4.2.1.5 MEA
- 4.2.1 By region
- 4.3 Company matrix analysis
- 4.4 Competitive analysis of major market players
- 4.5 Competitive positioning matrix
- 4.6 Key developments
- 4.6.1 Mergers & acquisitions
- 4.6.2 Partnerships & collaborations
- 4.6.3 New Product Launches
- 4.6.4 Expansion Plans
Chapter 5 Market Estimates and Forecast, By Product Type, 2022-2035 (USD Million) (Kilo Tons)
- 5.1 Key trends
- 5.2 Solution grade
- 5.3 Distilled grade
- 5.4 Others
Chapter 6 Market Estimates and Forecast, By Purity, 2022-2035 (USD Million) (Kilo Tons)
- 6.1 Key trends
- 6.2 <5% Purity (Low Purity)
- 6.3 5%-15% Purity (Medium Purity)
- 6.4 >15% Purity (High Purity)
Chapter 7 Market Estimates and Forecast, By End Use Industry, 2022-2035 (USD Million) (Kilo Tons)
- 7.1 Key trends
- 7.2 Healthcare
- 7.2.1 Hospital Surface Disinfection
- 7.2.2 Surgical Instrument Sterilization
- 7.2.3 Dialysis Equipment Disinfection
- 7.2.4 Pharmaceutical Clean Room Sanitation
- 7.3 Food & Beverage Processing
- 7.3.1 Meat and Poultry Processing
- 7.3.2 Beverage Sanitation
- 7.3.3 Dairy Equipment Cleaning
- 7.3.4 Fruit & Vegetable Washing
- 7.4 Water Treatment
- 7.4.1 Municipal Water Treatment
- 7.4.2 Wastewater Treatment
- 7.4.3 Industrial Water Treatment
- 7.4.4 Aquaculture Water Treatment
- 7.5 Pulp & Paper
- 7.5.1 Pulp Bleaching
- 7.5.2 Paper Machine System Disinfection
- 7.5.3 Recycled Fiber Treatment
- 7.5.4 Slimicide & Deodorizing Agent Use
- 7.6 Agriculture
- 7.6.1 Post-Harvest Produce Disinfection
- 7.6.2 Animal Housing Sanitation
- 7.6.3 Irrigation Water Treatment
- 7.6.4 Agricultural Equipment Disinfection
- 7.7 Pharmaceuticals
- 7.7.1 API Synthesis
- 7.7.2 Cleanroom Surface Sanitation
- 7.7.3 Pharma Equipment Sterilization
- 7.7.4 Packaging Equipment Disinfection
- 7.8 Chemical Processing
- 7.8.1 Oxidizing Agent
- 7.8.2 Polymerization Catalyst
- 7.8.3 Organic Synthesis Intermediate
- 7.8.4 Wastewater Disinfection
- 7.9 Petrochemical / Oil & Gas
- 7.9.1 Refinery Wastewater Disinfection
- 7.9.2 Pipeline Sludge & Biofilm Removal
- 7.9.3 Desulfurization Processes
- 7.9.4 Cooling Water System Treatment
Chapter 8 Market Estimates and Forecast, By Region, 2022-2035 (USD Million) (Kilo Tons)
- 8.1 Key trends
- 8.2 North America
- 8.2.1 U.S.
- 8.2.2 Canada
- 8.3 Europe
- 8.3.1 Germany
- 8.3.2 UK
- 8.3.3 France
- 8.3.4 Spain
- 8.3.5 Italy
- 8.3.6 Rest of Europe
- 8.4 Asia Pacific
- 8.4.1 China
- 8.4.2 India
- 8.4.3 Japan
- 8.4.4 Australia
- 8.4.5 South Korea
- 8.4.6 Rest of Asia Pacific
- 8.5 Latin America
- 8.5.1 Brazil
- 8.5.2 Mexico
- 8.5.3 Argentina
- 8.5.4 Rest of Latin America
- 8.6 Middle East and Africa
- 8.6.1 Saudi Arabia
- 8.6.2 South Africa
- 8.6.3 UAE
- 8.6.4 Rest of Middle East and Africa
Chapter 9 Company Profiles
- 9.1 Acuro Organics Limited
- 9.2 Airedale Chemical
- 9.3 Biosan LLC
- 9.4 Christeyns
- 9.5 Diversey Holdings
- 9.6 Ecolab
- 9.7 Enviro Tech Chemical Services
- 9.8 Evonik Industries
- 9.9 FMC Corporation
- 9.10 Hydrite Chemical Co.
- 9.11 Kemira
- 9.12 Loeffler Chemical Corporation
- 9.13 Mitsubishi Gas Chemical Company
- 9.14 National Peroxide Limited
- 9.15 SEITZ GmbH
- 9.16 Solvay
- 9.17 Sopura S.A.
- 9.18 Spartan Chemical Company, Inc.
- 9.19 Others
 过氧乙酸市场:全球市场按等级、形态、浓度、包装、应用和分销管道分類的预测-2026-2032年
 过氧乙酸市场分析及预测(至2035年):类型、产品、应用、终端用户、形态、技术、製程、材料类型、功能、设备
 过氧乙酸市场报告:依等级、应用、终端用户产业及地区划分(2026-2034年)
 2026年过氧乙酸全球市场报告
 过氧乙酸市场 - 全球产业规模、份额、趋势、机会及预测(按等级、应用、最终用途产业、地区和竞争格局划分,2021-2031年)日本过氧乙酸市场报告:依等级、应用、终端用户产业及地区划分(2026-2034年)
 过氧乙酸市场规模、份额及成长分析(按等级、应用、最终用途及地区划分)-2026-2033年产业预测
 全球过氧乙酸市场(按等级、应用、最终用途产业、形式和地区划分)- 预测至 2030 年
 过氧乙酸市场,规模,占有率,趋势,产业分析报告:各等级,各用途,各最终用途,各地区,2025年~2034年的市场预测
 过氧乙酸:市场占有率分析、产业趋势、统计、成长预测(2025-2030)