


 |
市场调查报告书
商品编码
1928941
家禽益生菌配料市场机会、成长要素、产业趋势分析及2026年至2035年预测Poultry Probiotic Ingredients Market Opportunity, Growth Drivers, Industry Trend Analysis, and Forecast 2026 - 2035 |
||||||
全球家禽益生菌成分市场预计到 2025 年将达到 1.263 亿美元,到 2035 年将达到 2.302 亿美元,年复合成长率为 6.3%。
家禽益生菌成分经过精心配製,富含多种有益微生物,有助于维持肠道健康、提高饲料转换率、增强免疫力,并提升商业化养殖中家禽的整体表现。这些成分包含芽孢桿菌、链球菌、双叉桿菌、乳酸桿菌等多种益生菌菌株,它们在抑制病原体、促进营养吸收、优化消化功能和增强抗病能力方面发挥关键作用,是抗生素的天然替代品。全球家禽产量的成长、无抗生素养殖方式的广泛应用以及益生菌技术的进步正在推动这一市场的发展。对多菌株配方、先进菌株研发以及针对不同家禽品种的生产力优化方面的持续投入,正在推动全球市场的强劲需求,为养殖户带来诸多益处,例如改善肠道菌群定植、增强病原体抑制、提高饲料转化率以及优化商业化家禽养殖系统的免疫反应。
| 市场覆盖范围 | |
|---|---|
| 开始年份 | 2025 |
| 预测年份 | 2026-2035 |
| 起始值 | 1.263亿美元 |
| 预测金额 | 2.302亿美元 |
| 复合年增长率 | 6.3% |
乳酸菌市占率比高达67.8%,预计到2035年将以6.2%的复合年增长率成长。其市场主导地位归功于其卓越的肠道定植能力、有效的病原体抑製作用以及在肉鸡、蛋鸡和种鸡中经证实的优异性能。乳酸菌透过产生乳酸来维持肠道健康,并能有效抑制有害细菌的生长,使其成为商业性家禽养殖中首选的益生菌菌株。
家禽业务占市场份额的37.7%,预计到2035年将以6.6%的复合年增长率成长。这主要归功于鸡肉在全球家禽生产(包括肉鸡和蛋鸡)中的主导地位。该业务受益于成熟的益生菌通讯协定、贯穿生产各个阶段的检验研究,以及透过提高饲料转换率、降低死亡率和提升整体生产力而实现的可衡量的投资收益率(ROI)。
2025 年,美国全国家禽益生菌原料市场价值 3,120 万美元。北美市场的成长动力来自商业肉鸡养殖中对肠道环境优化的强劲需求、无抗生素水产养殖中对多菌株益生菌的需求,以及为提高生产效率而实施先进益生菌方案的综合鸡蛋生产企业的需求。
目录
第一章调查方法和范围
第二章执行摘要
第三章业界考察
- 生态系分析
- 供应商情况
- 利润率
- 每个阶段的附加价值
- 影响价值链的因素
- 中断
- 产业影响因素
- 司机
- 产业潜在风险与挑战
- 市场机会
- 成长潜力分析
- 监管环境
- 北美洲
- 欧洲
- 亚太地区
- 拉丁美洲
- 中东和非洲
- 波特分析
- PESTEL 分析
- 科技与创新趋势
- 当前技术趋势
- 新兴技术
- 价格趋势
- 按地区
- 按产品等级
- 未来市场趋势
- 科技与创新趋势
- 当前技术趋势
- 新兴技术
- 专利趋势
- 贸易统计(HS编码)(註:仅提供主要国家的贸易统计)
- 主要进口国
- 主要出口国
- 永续性和环境方面
- 永续努力
- 减少废弃物策略
- 生产中的能源效率
- 环保倡议
- 考虑到碳足迹
第四章 竞争情势
- 介绍
- 公司市占率分析
- 按地区
- 北美洲
- 欧洲
- 亚太地区
- 拉丁美洲
- 中东和非洲
- 按地区
- 企业矩阵分析
- 主要市场公司的竞争分析
- 竞争定位矩阵
- 重大进展
- 併购
- 伙伴关係与合作
- 新产品发布
- 扩张计划
第五章 2022-2035年按产品分類的市场估算与预测
- 乳酸菌 乳酸桿菌属
- 嗜酸乳桿菌
- 植物乳桿菌
- L. reuteri
- L. salivarius
- 其他的
- 双歧桿菌
- 双叉桿菌/双叉桿菌/ 长双叉桿菌
- 长双歧桿菌
- 动物双歧桿菌
- 其他的
- 链球菌
- S. thermophilus
- 粪肠球菌
- 芽孢桿菌
- 枯草桿菌
- B. licheniformis
- 枯草桿菌
- 其他的
- 其他的
第六章 按应用领域分類的市场估算与预测,2022-2035年
- 鸡
- 肉鸡
- 产蛋母鸡
- 种鸡
- 土耳其
- 鸭子
- 鹅
- 其他的
第七章 2022-2035年各地区市场估算与预测
- 北美洲
- 我们
- 加拿大
- 欧洲
- 德国
- 英国
- 法国
- 西班牙
- 义大利
- 其他欧洲地区
- 亚太地区
- 中国
- 印度
- 日本
- 澳洲
- 韩国
- 亚太其他地区
- 拉丁美洲
- 巴西
- 墨西哥
- 阿根廷
- 其他拉丁美洲地区
- 中东和非洲
- 沙乌地阿拉伯
- 南非
- 阿拉伯聯合大公国
- 其他中东和非洲地区
第八章:公司简介
- Novonesis(formerly Chr. Hansen)
- Novus International
- Biomin Holding GmbH
- Evonik Industries AG
- Adisseo France SAS
- Huvepharma AD
- Kemin Industries
- International Animal Health Products
- Pic-Bio, Inc.
- Neospark
- Lallemand Animal Nutrition
- Alltech
- Arm &Hammer Animal Nutrition
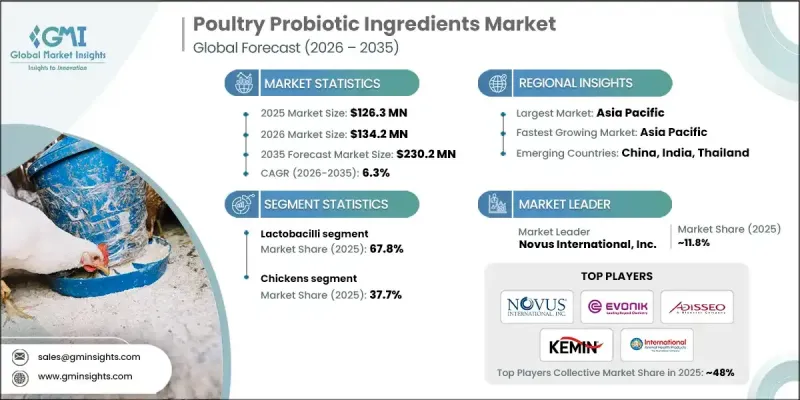
The Global Poultry Probiotic Ingredients Market was valued at USD 126.3 million in 2025 and is estimated to grow at a CAGR of 6.3% to reach USD 230.2 million by 2035.
Poultry probiotic ingredients consist of carefully formulated beneficial microorganisms that support gut health, enhance feed conversion efficiency, strengthen immunity, and improve overall bird performance in commercial operations. These ingredients include strains such as Bacillus, Streptococcus, Bifidobacterium, Lactobacilli, and other probiotic microbes that play critical roles in pathogen suppression, nutrient absorption, digestive optimization, and disease resistance, and serve as natural alternatives to antibiotics. Increasing global poultry production, the rise of antibiotic-free farming practices, and advancements in probiotic technologies are driving growth in this market. Continuous investment in multi-strain formulations, advanced strain development, and performance optimization across different poultry species ensures robust global demand, providing producers with improved gut colonization, stronger pathogen inhibition, enhanced feed conversion ratios, and optimized immune responses across commercial poultry systems.
| Market Scope | |
|---|---|
| Start Year | 2025 |
| Forecast Year | 2026-2035 |
| Start Value | $126.3 Million |
| Forecast Value | $230.2 Million |
| CAGR | 6.3% |
The lactobacilli segment held a 67.8% share and is expected to grow at a CAGR of 6.2% through 2035. Its dominance stems from superior gut colonization, effective pathogen inhibition, and proven performance across broilers, layers, and breeding stock. Lactobacilli support intestinal health through lactic acid production and provide competitive exclusion against harmful bacteria, making them the preferred probiotic strain for commercial poultry operations.
The chickens segment held a 37.7% share and is anticipated to grow at a CAGR of 6.6% through 2035. This is driven by chickens' overwhelming presence in global poultry production, covering both meat and egg production. The segment benefits from established probiotic protocols, validated research across production stages, and measurable ROI through improved feed conversion, reduced mortality, and increased overall productivity.
U.S. Poultry Probiotic Ingredients Market accounted for USD 31.2 million in 2025. Growth in North America is fueled by strong demand from commercial broiler operations for gut health optimization, multi-strain probiotics for antibiotic-free farming, and integrated layer operations employing advanced probiotic programs to improve production efficiency.
Key players operating in the Global Poultry Probiotic Ingredients Market include Novus International, Novonesis (formerly Chr. Hansen), Biomin Holding GmbH, Evonik Industries AG, Adisseo France SAS, Kemin Industries, Huvepharma AD, International Animal Health Products, Pic-Bio, Inc., Neospark, Lallemand Animal Nutrition, Alltech, and Arm & Hammer Animal Nutrition. Companies in the Poultry Probiotic Ingredients Market strengthen their foothold by investing in research and development for novel strains, multi-strain formulations, and advanced delivery systems. Expanding production capacities, establishing strategic partnerships with feed producers, and entering emerging geographic markets help enhance reach and distribution. Firms also emphasize quality assurance, regulatory compliance, and scientifically validated performance data to build customer trust.
Table of Contents
Chapter 1 Methodology & Scope
- 1.1 Market scope and definition
- 1.2 Research design
- 1.2.1 Research approach
- 1.2.2 Data collection methods
- 1.3 Data mining sources
- 1.3.1 Global
- 1.3.2 Regional/Country
- 1.4 Base estimates and calculations
- 1.4.1 Base year calculation
- 1.4.2 Key trends for market estimation
- 1.5 Primary research and validation
- 1.5.1 Primary sources
- 1.6 Forecast model
- 1.7 Research assumptions and limitations
Chapter 2 Executive Summary
- 2.1 Industry 360° synopsis
- 2.2 Key market trends
- 2.2.1 Product
- 2.2.2 Application
- 2.2.3 Regional
- 2.3 TAM Analysis, 2025-2035
- 2.4 CXO perspectives: Strategic imperatives
- 2.4.1 Executive decision points
- 2.4.2 Critical success factors
- 2.5 Future outlook and strategic recommendations
Chapter 3 Industry Insights
- 3.1 Industry ecosystem analysis
- 3.1.1 Supplier landscape
- 3.1.2 Profit margin
- 3.1.3 Value addition at each stage
- 3.1.4 Factor affecting the value chain
- 3.1.5 Disruptions
- 3.2 Industry impact forces
- 3.2.1 Growth drivers
- 3.2.2 Industry pitfalls and challenges
- 3.2.3 Market opportunities
- 3.3 Growth potential analysis
- 3.4 Regulatory landscape
- 3.4.1 North America
- 3.4.2 Europe
- 3.4.3 Asia Pacific
- 3.4.4 Latin America
- 3.4.5 Middle East & Africa
- 3.5 Porter';s analysis
- 3.6 PESTEL analysis
- 3.7 Technology and innovation landscape
- 3.7.1 Current technological trends
- 3.7.2 Emerging technologies
- 3.8 Price trends
- 3.8.1 By region
- 3.8.2 By product grade
- 3.9 Future market trends
- 3.10 Technology and innovation landscape
- 3.10.1 Current technological trends
- 3.10.2 Emerging technologies
- 3.11 Patent landscape
- 3.12 Trade statistics (HS code) (Note: the trade statistics will be provided for key countries only)
- 3.12.1 Major importing countries
- 3.12.2 Major exporting countries
- 3.13 Sustainability and environmental aspects
- 3.13.1 Sustainable practices
- 3.13.2 Waste reduction strategies
- 3.13.3 Energy efficiency in production
- 3.13.4 Eco-friendly initiatives
- 3.14 Carbon footprint consideration
Chapter 4 Competitive Landscape, 2025
- 4.1 Introduction
- 4.2 Company market share analysis
- 4.2.1 By region
- 4.2.1.1 North America
- 4.2.1.2 Europe
- 4.2.1.3 Asia Pacific
- 4.2.1.4 LATAM
- 4.2.1.5 MEA
- 4.2.1 By region
- 4.3 Company matrix analysis
- 4.4 Competitive analysis of major market players
- 4.5 Competitive positioning matrix
- 4.6 Key developments
- 4.6.1 Mergers & acquisitions
- 4.6.2 Partnerships & collaborations
- 4.6.3 New product launches
- 4.6.4 Expansion plans
Chapter 5 Market Estimates and Forecast, By Product, 2022-2035 (USD Million) (Kilo Tons)
- 5.1 Key trends
- 5.2 Lactobacilli
- 5.2.1 L. acidophilus
- 5.2.2 L. plantarum
- 5.2.3 L. reuteri
- 5.2.4 L. salivarius
- 5.2.5 Others
- 5.3 Bifidobacterium
- 5.4 B. bifidum
- 5.4.1 B. longum
- 5.4.2 B. animalis
- 5.4.3 Others
- 5.5 Streptococcus
- 5.5.1 S. thermophilus
- 5.5.2 Enterococcus faecium
- 5.6 Bacillus
- 5.6.1 B. subtilis
- 5.6.2 B. licheniformis
- 5.6.3 B. amyloliquefaciens
- 5.6.4 Others
- 5.7 Others
Chapter 6 Market Estimates and Forecast, By Application, 2022-2035 (USD Million) (Kilo Tons)
- 6.1 Key trends
- 6.2 Chickens
- 6.2.1 Broilers
- 6.2.2 Layers
- 6.2.3 Breeders
- 6.3 Turkeys
- 6.4 Ducks
- 6.5 Geese
- 6.6 Others
Chapter 7 Market Estimates and Forecast, By Region, 2022-2035 (USD Million) (Kilo Tons)
- 7.1 Key trends
- 7.2 North America
- 7.2.1 U.S.
- 7.2.2 Canada
- 7.3 Europe
- 7.3.1 Germany
- 7.3.2 UK
- 7.3.3 France
- 7.3.4 Spain
- 7.3.5 Italy
- 7.3.6 Rest of Europe
- 7.4 Asia Pacific
- 7.4.1 China
- 7.4.2 India
- 7.4.3 Japan
- 7.4.4 Australia
- 7.4.5 South Korea
- 7.4.6 Rest of Asia Pacific
- 7.5 Latin America
- 7.5.1 Brazil
- 7.5.2 Mexico
- 7.5.3 Argentina
- 7.5.4 Rest of Latin America
- 7.6 Middle East and Africa
- 7.6.1 Saudi Arabia
- 7.6.2 South Africa
- 7.6.3 UAE
- 7.6.4 Rest of Middle East and Africa
Chapter 8 Company Profiles
- 8.1 Novonesis (formerly Chr. Hansen)
- 8.2 Novus International
- 8.3 Biomin Holding GmbH
- 8.4 Evonik Industries AG
- 8.5 Adisseo France SAS
- 8.6 Huvepharma AD
- 8.7 Kemin Industries
- 8.8 International Animal Health Products
- 8.9 Pic-Bio, Inc.
- 8.10 Neospark
- 8.11 Lallemand Animal Nutrition
- 8.12 Alltech
- 8.13 Arm & Hammer Animal Nutrition
