


 |
市场调查报告书
商品编码
1928943
金奈米颗粒市场机会、成长要素、产业趋势分析及预测(2026年至2035年)Gold Nanoparticles Market Opportunity, Growth Drivers, Industry Trend Analysis, and Forecast 2026 - 2035 |
||||||
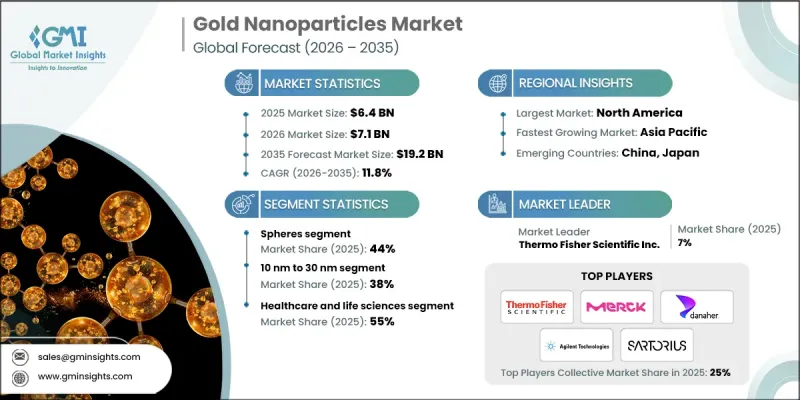
全球金奈米颗粒市场预计到 2025 年将达到 64 亿美元,到 2035 年将达到 192 亿美元,年复合成长率为 11.8%。
金奈米颗粒已从专业的实验室材料发展成为生命科学领域中可规模化生产且应用广泛的材料,解决了诸如稳定的生物标记和可调光学性质等挑战。新冠疫情期间,生命科学研究经费达到前所未有的水平,大大促进了创新和学术论文的发表。这些奈米颗粒通常用作研究和诊断中的试剂和检测组件。买家对品质标准、可追溯性和全面文件的要求日益提高,尤其是在体外诊断和生物偶联应用领域。符合ISO标准的系统和分析证书正逐渐成为采购中的标准要求,确保了供应链的稳定性。持续的研发投入、公共科学参与以及对可重复性的重视,即使在疫情引发的需求激增结束后,也将继续支撑市场的长期成长。
| 市场覆盖范围 | |
|---|---|
| 开始年份 | 2025 |
| 预测年份 | 2026-2035 |
| 起始值 | 64亿美元 |
| 预测金额 | 192亿美元 |
| 复合年增长率 | 11.8% |
球形奈米颗粒市场占有率占44%,预计到2035年将以11.1%的复合年增长率成长。这种形状的奈米颗粒因其扩充性大规模生产、可重复性好以及在常规标记和检测生产中易于检验等优点而日益受到青睐。同时,为了获得可调的等离子体特性,用于光热治疗和感测应用,买家越来越多地采用棒状和星状等异向性形状的奈米颗粒。供应商正透过扩展产品目录和提高批次间一致性来应对不断变化的研究需求。
预计到2025年,粒径在10-30奈米范围内的金奈米颗粒将占据38%的市场份额,并在2035年之前以14.8%的复合年增长率增长。中等尺寸的颗粒在光学讯号强度、胶体稳定性和生物偶联实用性方面实现了良好的平衡,适用于常规检测。小于10奈米的奈米颗粒因其优异的组织穿透性和更大的表面积而更受欢迎,但需要更严格的品管。同时,较大的颗粒仍然适用于散射和可视化应用。
预计2025年,北美金奈米颗粒市场规模将达22亿美元,2035年将达71亿美元,复合年增长率(CAGR)为12.5%。强大的生命科学研发丛集、完善的采购标准以及强劲的诊断需求是推动区域成长的主要动力。检测生产规模的扩大和转化研究的持续投入,则维持了诊断、影像和早期治疗应用领域的稳定需求。
目录
第一章调查方法和范围
第二章执行摘要
第三章业界考察
- 生态系分析
- 供应商情况
- 利润率
- 每个阶段的附加价值
- 影响价值链的因素
- 中断
- 产业影响因素
- 司机
- 快速诊断和生物感测器
- 奈米医学研究和转化流程的进展
- 等离子体激元学和先进光学元件的发展
- 产业潜在风险与挑战
- 黄金高成本且价格波动剧烈
- 监理和安全检验负担
- 市场机会
- 标靶药物传递和光热治疗
- 可扩展的绿色合成和表面功能化
- 司机
- 成长潜力分析
- 监管环境
- 北美洲
- 欧洲
- 亚太地区
- 拉丁美洲
- 中东和非洲
- 波特分析
- PESTEL 分析
- 价格趋势
- 按地区
- 依产品类型
- 未来市场趋势
- 科技与创新趋势
- 当前技术趋势
- 新兴技术
- 专利状态
- 贸易统计(HS编码)(註:仅提供主要国家的贸易统计)
- 主要进口国
- 主要出口国
- 永续性和环境方面
- 永续努力
- 减少废弃物策略
- 生产中的能源效率
- 环保倡议
- 考虑到碳足迹
第四章 竞争情势
- 介绍
- 公司市占率分析
- 按地区
- 北美洲
- 欧洲
- 亚太地区
- 拉丁美洲
- 中东和非洲
- 按地区
- 企业矩阵分析
- 主要市场公司的竞争分析
- 竞争定位矩阵
- 重大进展
- 併购
- 伙伴关係与合作
- 新产品发布
- 业务拓展计划
第五章 2022-2035年按产品分類的市场估算与预测
- 领域
- 桿
- 壳
- 笼
- 星星
- 三角形和棱柱
- 其他的
6. 按规模范围分類的市场估算与预测,2022-2035 年
- 小于10奈米
- 10nm~30nm
- 31nm~50nm
- 51nm~100nm
- 超过100奈米
7. 2022-2035年按最终用途产业分類的市场估算与预测
- 医学与生命科学
- 体外诊断
- 影像剂和造影剂
- 药物传递与治疗方法
- 生物感测器
- 研究和实验室用途
- 电子学与光电
- 导电油墨
- 显示器和光电子学
- 电浆装置
- 光热和光学元件
- 化学品/材料
- 催化剂
- 涂料和复合材料
- 能源与环境
- 太阳能和燃料电池应用
- 水处理与环境感测
- 其他最终用途
第八章 2022-2035年各地区市场估算与预测
- 北美洲
- 我们
- 加拿大
- 欧洲
- 德国
- 英国
- 法国
- 西班牙
- 义大利
- 其他欧洲地区
- 亚太地区
- 中国
- 印度
- 日本
- 澳洲
- 韩国
- 亚太其他地区
- 拉丁美洲
- 巴西
- 墨西哥
- 阿根廷
- 其他拉丁美洲地区
- 中东和非洲
- 沙乌地阿拉伯
- 南非
- 阿拉伯聯合大公国
- 其他中东和非洲地区
第九章:公司简介
- Cytodiagnostics Inc.
- nanoComposix
- BBI Solutions
- Merck KGaA
- Thermo Fisher Scientific Inc.
- Danaher Corporation
- Sartorius AG
- Agilent Technologies Inc.
- PerkinElmer Inc.
- Luminex Corporation
- Tanaka Precious Metals
- AMETEK Inc.
- Strem Chemicals Inc.
- Nanopartz Inc.
- Meliorum Technologies Inc.
- Goldsol Inc.
The Global Gold Nanoparticles Market was valued at USD 6.4 billion in 2025 and is estimated to grow at a CAGR of 11.8% to reach USD 19.2 billion by 2035.
Gold nanoparticles have evolved from a specialized laboratory material into a scalable, widely applied input across life sciences, addressing challenges in stable bio-labeling and tunable optical properties. Funding for life sciences research reached unprecedented levels during the COVID-19 pandemic, driving both innovation and publication output. These nanoparticles are commonly utilized as reagents and assay components in research and diagnostics. Buyers increasingly demand higher quality standards, traceability, and comprehensive documentation, particularly in in-vitro diagnostics and bioconjugation applications. ISO-aligned systems and certificates of analysis are becoming standard requirements in procurement, ensuring consistent supply chains. Sustained R&D, public science engagement, and a focus on reproducibility continue to underpin the market's long-term growth, even beyond pandemic-driven demand spikes.
| Market Scope | |
|---|---|
| Start Year | 2025 |
| Forecast Year | 2026-2035 |
| Start Value | $6.4 Billion |
| Forecast Value | $19.2 Billion |
| CAGR | 11.8% |
The spherical nanoparticles segment held a 44% share and is expected to grow at a CAGR of 11.1% through 2035. This shape dominates due to high-volume scalability, reproducibility, and ease of validation in routine labeling and assay production. Meanwhile, buyers are increasingly adding anisotropic shapes, such as rods and stars, to achieve tunable plasmonic properties for photothermal therapy and sensing applications. Suppliers are responding by broadening product catalogs and enhancing batch consistency to meet evolving research needs.
The gold nanoparticles sized 10 nm to 30 nm captured 38% share in 2025 and are expected to grow at a CAGR of 14.8% through 2035. Mid-range particles balance optical signal strength, colloidal stability, and bioconjugation practicality for routine assays. Smaller nanoparticles under 10 nm are preferred for enhanced tissue penetration and surface area, though they require stricter quality control. Larger particles remain relevant for scattering and visibility applications.
North America Gold Nanoparticles Market generated USD 2.2 billion in 2025 and is projected to reach USD 7.1 billion by 2035 at a CAGR of 12.5%. Strong life science R&D clusters, established procurement standards, and robust diagnostics demand drive regional growth. The scaling of assay manufacturing and consistent funding for translational research maintain steady demand across diagnostics, imaging, and early-stage therapeutic applications.
Major players in the Global Gold Nanoparticles Market include Cytodiagnostics Inc., nanoComposix, BBI Solutions, Merck KGaA, Thermo Fisher Scientific Inc., Danaher Corporation, Sartorius AG, Agilent Technologies, Inc., PerkinElmer, Inc., Luminex Corporation, Tanaka Precious Metals, AMETEK, Inc., Strem Chemicals, Inc., Nanopartz Inc., Meliorum Technologies, Inc., and Goldsol, Inc. Companies in the Global Gold Nanoparticles Market are strengthening their positions by expanding product portfolios with varied particle sizes and shapes to meet diverse research and diagnostic needs. R&D investments ensure improved reproducibility, stability, and bioconjugation performance. Firms are also emphasizing ISO-compliant quality systems, certificates of analysis, and traceable documentation to enhance trust with buyers.
Table of Contents
Chapter 1 Methodology & Scope
- 1.1 Market scope and definition
- 1.2 Research design
- 1.2.1 Research approach
- 1.2.2 Data collection methods
- 1.3 Data mining sources
- 1.3.1 Global
- 1.3.2 Regional/Country
- 1.4 Base estimates and calculations
- 1.4.1 Base year calculation
- 1.4.2 Key trends for market estimation
- 1.5 Primary research and validation
- 1.5.1 Primary sources
- 1.6 Forecast model
- 1.7 Research assumptions and limitations
Chapter 2 Executive Summary
- 2.1 Industry 3600 synopsis
- 2.2 Key market trends
- 2.2.1 Regional
- 2.2.2 Product
- 2.2.3 Size Range
- 2.2.4 End use Industry
- 2.3 TAM Analysis, 2026-2035
- 2.4 CXO perspectives: Strategic imperatives
- 2.4.1 Executive decision points
- 2.4.2 Critical success factors
- 2.5 Future Outlook and Strategic Recommendations
Chapter 3 Industry Insights
- 3.1 Industry ecosystem analysis
- 3.1.1 Supplier landscape
- 3.1.2 Profit margin
- 3.1.3 Value addition at each stage
- 3.1.4 Factor affecting the value chain
- 3.1.5 Disruptions
- 3.2 Industry impact forces
- 3.2.1 Growth drivers
- 3.2.1.1 Expansion of rapid diagnostics and biosensors
- 3.2.1.2 Rising nanomedicine research and translational pipelines
- 3.2.1.3 Growth in plasmonics and advanced optical devices
- 3.2.2 Industry pitfalls and challenges
- 3.2.2.1 High cost and price volatility of gold
- 3.2.2.2 Regulatory and safety validation burden
- 3.2.3 Market opportunities
- 3.2.3.1 Targeted drug delivery and photothermal therapy
- 3.2.3.2 Scalable green synthesis and surface functionalization
- 3.2.1 Growth drivers
- 3.3 Growth potential analysis
- 3.4 Regulatory landscape
- 3.4.1 North America
- 3.4.2 Europe
- 3.4.3 Asia Pacific
- 3.4.4 Latin America
- 3.4.5 Middle East & Africa
- 3.5 Porter';s analysis
- 3.6 PESTEL analysis
- 3.7 Price trends
- 3.7.1 By region
- 3.7.2 By Product type
- 3.8 Future market trends
- 3.9 Technology and Innovation landscape
- 3.9.1 Current technological trends
- 3.9.2 Emerging technologies
- 3.10 Patent Landscape
- 3.11 Trade statistics (HS code) (Note: the trade statistics will be provided for key countries only)
- 3.11.1 Major importing countries
- 3.11.2 Major exporting countries
- 3.12 Sustainability and environmental aspects
- 3.12.1 Sustainable practices
- 3.12.2 Waste reduction strategies
- 3.12.3 Energy efficiency in production
- 3.12.4 Eco-friendly initiatives
- 3.13 Carbon footprint consideration
Chapter 4 Competitive Landscape, 2025
- 4.1 Introduction
- 4.2 Company market share analysis
- 4.2.1 By region
- 4.2.1.1 North America
- 4.2.1.2 Europe
- 4.2.1.3 Asia Pacific
- 4.2.1.4 LATAM
- 4.2.1.5 MEA
- 4.2.1 By region
- 4.3 Company matrix analysis
- 4.4 Competitive analysis of major market players
- 4.5 Competitive positioning matrix
- 4.6 Key developments
- 4.6.1 Mergers & acquisitions
- 4.6.2 Partnerships & collaborations
- 4.6.3 New Product Launches
- 4.6.4 Expansion Plans
Chapter 5 Market Estimates and Forecast, By Product, 2022-2035 (USD Billion) (Kilo Tons)
- 5.1 Key trends
- 5.2 Spheres
- 5.3 Rods
- 5.4 Shells
- 5.5 Cages
- 5.6 Stars
- 5.7 Triangles and prisms
- 5.8 Other
Chapter 6 Market Estimates and Forecast, By Size Range, 2022-2035 (USD Billion) (Kilo Tons)
- 6.1 Key trends
- 6.2 Less than 10 nm
- 6.3 10 nm to 30 nm
- 6.4 31 nm to 50 nm
- 6.5 51 nm to 100 nm
- 6.6 More than 100 nm
Chapter 7 Market Estimates and Forecast, By End Use Industry, 2022-2035 (USD Billion) (Kilo Tons)
- 7.1 Key trends
- 7.2 Healthcare and life sciences
- 7.2.1 In vitro diagnostics
- 7.2.2 Imaging and contrast agents
- 7.2.3 Drug delivery and therapeutics
- 7.2.4 Biosensors
- 7.2.5 Research and laboratory use
- 7.3 Electronics and photonics
- 7.3.1 Conductive inks
- 7.3.2 Displays and optoelectronics
- 7.3.3 Plasmonic devices
- 7.3.4 Photothermal and optical components
- 7.4 Chemicals and materials
- 7.4.1 Catalysts
- 7.4.2 Coatings and composites
- 7.5 Energy and environment
- 7.5.1 Solar and fuel cell applications
- 7.5.2 Water treatment and environmental sensing
- 7.6 Other end use
Chapter 8 Market Estimates and Forecast, By Region, 2022-2035 (USD Billion) (Kilo Tons)
- 8.1 Key trends
- 8.2 North America
- 8.2.1 U.S.
- 8.2.2 Canada
- 8.3 Europe
- 8.3.1 Germany
- 8.3.2 UK
- 8.3.3 France
- 8.3.4 Spain
- 8.3.5 Italy
- 8.3.6 Rest of Europe
- 8.4 Asia Pacific
- 8.4.1 China
- 8.4.2 India
- 8.4.3 Japan
- 8.4.4 Australia
- 8.4.5 South Korea
- 8.4.6 Rest of Asia Pacific
- 8.5 Latin America
- 8.5.1 Brazil
- 8.5.2 Mexico
- 8.5.3 Argentina
- 8.5.4 Rest of Latin America
- 8.6 Middle East and Africa
- 8.6.1 Saudi Arabia
- 8.6.2 South Africa
- 8.6.3 UAE
- 8.6.4 Rest of Middle East and Africa
Chapter 9 Company Profiles
- 9.1 Cytodiagnostics Inc.
- 9.2 nanoComposix
- 9.3 BBI Solutions
- 9.4 Merck KGaA
- 9.5 Thermo Fisher Scientific Inc.
- 9.6 Danaher Corporation
- 9.7 Sartorius AG
- 9.8 Agilent Technologies Inc.
- 9.9 PerkinElmer Inc.
- 9.10 Luminex Corporation
- 9.11 Tanaka Precious Metals
- 9.12 AMETEK Inc.
- 9.13 Strem Chemicals Inc.
- 9.14 Nanopartz Inc.
- 9.15 Meliorum Technologies Inc.
- 9.16 Goldsol Inc.
 金奈米颗粒市场:按类型、尺寸、合成方法、应用和最终用户划分-2026-2032年全球市场预测导电金颗粒市场按产品类型、粒径、合成方法和应用划分-全球预测,2026-2032年萤光标记金奈米球市场:按产品类型、粒径、表面化学性质、销售管道、应用和最终用途产业划分-全球预测(2026-2032 年)超均匀金奈米球市场:按粒径、合成方法、表面涂层、应用和最终用户划分,全球预测(2026-2032年)
 金奈米颗粒市场规模、份额及成长分析(按类型、应用、终端用户产业及地区划分)-2026-2033年产业预测
 金奈米粒子:市场份额分析、行业趋势、统计数据和成长预测(2025-2030 年)
 金奈米粒子市场按製程、应用、最终用途产业和地区划分 - 预测至 2029 年
 金奈米颗粒市场规模、份额和趋势分析报告:按最终用途、按地区、细分市场预测,2024-2030 年