


 |
市场调查报告书
商品编码
1928952
游戏相关产品市场机会、成长要素、产业趋势分析及2026年至2035年预测Gaming Merchandise Market Opportunity, Growth Drivers, Industry Trend Analysis, and Forecast 2026 - 2035 |
||||||
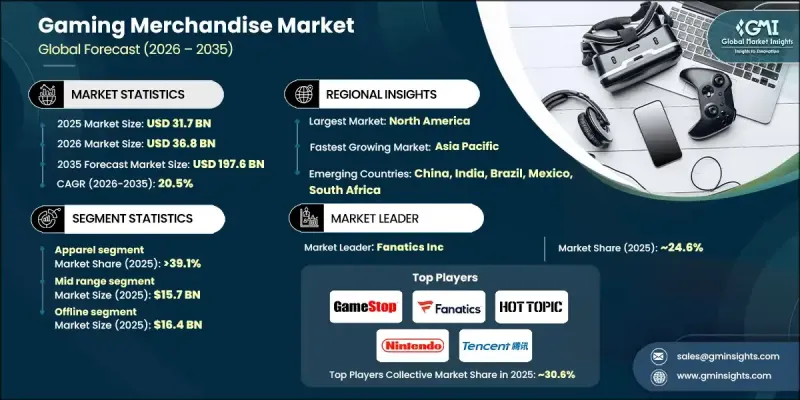
全球游戏週边商品市场预计到 2025 年将达到 317 亿美元,到 2035 年将达到 1976 亿美元,年复合成长率为 20.5%。
这种快速成长反映了全球游戏使用者群体的稳定扩张以及游戏娱乐界文化影响力的不断加深。随着游戏不断融入日常生活,消费者的参与度也从互动体验扩展到购买品牌实体产品。週边产品已成为粉丝表达个人身分、品牌亲和性和长期忠诚度的重要途径。随着游戏在各个年龄层和地区被更广泛地接受,与知名游戏品牌相关的生活风格类产品的需求也不断增长。随着游戏生态系统的日趋成熟,週边产品的购买行为正从小众活动演变为主流消费趋势。不断壮大的粉丝群、日益增长的数位曝光度以及对游戏世界的强烈情感依恋,都支撑着这种持续的需求。在持续创新、不断拓展的分销网络和不断扩大的全球影响力的支持下,游戏相关週边产品正转型成为一个高成长的消费品类。
| 市场覆盖范围 | |
|---|---|
| 开始年份 | 2025 |
| 预测年份 | 2026-2035 |
| 起始值 | 317亿美元 |
| 预测金额 | 1976亿美元 |
| 复合年增长率 | 20.5% |
到2025年,服饰品类将成为最大的产品类别,市占率将达到39.1%。消费者对品牌服饰和与游戏文化相关的休閒服饰的浓厚兴趣是推动此需求的主要因素。时尚的设计、品牌知名度和零售店的便利购买管道持续推动着服饰品类的普及,巩固了其在市场上的主导地位。
预计到2025年,中价位市场将创造157亿美元的收入。该市场凭藉其在价格和感知品质之间的最佳平衡,吸引了众多消费者,并从中受益。这价位的产品符合主流消费者的购买习惯,并支撑着多个产品类别的稳定销售。
预计到2025年,北美将以35.5%的市占率引领区域游戏週边商品市场。强劲的消费者参与度、成熟的数位商务管道和强大的品牌知名度是推动市场需求的主要因素。该地区对能够体现游戏相关生活方式偏好的品牌商品持续保持着浓厚的兴趣。
目录
第一章调查方法和范围
第二章执行摘要
第三章业界考察
- 生态系分析
- 供应商情况
- 利润率
- 成本结构
- 每个阶段的附加价值
- 影响价值链的因素
- 中断
- 产业影响因素
- 司机
- 全球游戏社群在PC、主机和行动平台方面迅速发展
- 电子竞技联赛和现场游戏活动的扩展
- 粉丝对游戏系列的浓厚兴趣推动了对授权版和限量版产品的需求。
- 主播和游戏网红的影响力日益增强,正在加速产品认知度和直接面向消费者的销售成长。
- 电子商务和线上市场的发展正在增加全球游戏相关商品的供应量。
- 产业潜在风险与挑战
- 高额的许可费和特许权使用费
- 新兴市场零售店的匮乏限制了线下产品销售。
- 市场机会
- 将游戏相关产品与时尚和生活风格品牌结合
- 对永续、环保游戏服装日益增长的需求为差异化提供了机会。
- 司机
- 成长潜力分析
- 监管环境
- 北美洲
- 欧洲
- 亚太地区
- 拉丁美洲
- 中东和非洲
- 波特分析
- PESTEL 分析
- 科技与创新趋势
- 当前技术趋势
- 新兴技术
- 价格趋势
- 历史价格分析(2022-2024)
- 价格趋势背后的因素
- 区域价格差异
- 价格预测(2026-2035)
- 定价策略
- 新兴经营模式
- 合规要求
- 永续性措施
- 永续材料评估
- 碳足迹分析
- 采取循环经济模式
- 永续性认证和标准
- 永续性投资报酬率分析
- 全球消费者心理分析
- 专利分析
第四章 竞争情势
- 介绍
- 公司市占率分析
- 按地区
- 北美洲
- 欧洲
- 亚太地区
- 拉丁美洲
- 中东和非洲
- 市场集中度分析
- 按地区
- 主要企业的竞争标竿分析
- 财务绩效比较
- 收入
- 利润率
- 研究与开发
- 产品系列比较
- 产品线的广度
- 科技
- 创新
- 地理分布比较
- 全球扩张分析
- 服务网路覆盖
- 按地区分類的市场渗透率
- 竞争定位矩阵
- 领导企业
- 受让人
- 追踪者
- 小众玩家
- 战略展望矩阵
- 财务绩效比较
- 2022-2025 年主要发展动态
- 併购
- 合作伙伴关係和合资企业
- 技术进步
- 扩张与投资策略
- 永续发展倡议
- 数位转型计划
- 新兴/Start-Ups竞赛的趋势
第五章 2022-2035年按产品分類的市场估算与预测
- ,
- 服饰
- 配件
- 收藏品
- 游戏周边设备
- 居家装饰
- 其他的
第六章 依价格区间分類的市场估计与预测,2022-2035年
- 高阶
- 中檔
- 低价位
7. 2022-2035年按分销管道分類的市场估算与预测
- 在线的
- 离线
第八章 2022-2035年各地区市场估算与预测
- 按地区
- 北美洲
- 我们
- 加拿大
- 欧洲
- 英国
- 德国
- 法国
- 义大利
- 西班牙
- 俄罗斯
- 其他欧洲地区
- 亚太地区
- 中国
- 印度
- 日本
- 韩国
- ANZ
- 亚太其他地区
- 拉丁美洲
- 巴西
- 墨西哥
- 阿根廷
- 其他拉丁美洲地区
- 中东和非洲
- 沙乌地阿拉伯
- 南非
- 阿拉伯聯合大公国
- 其他中东和非洲地区
第九章:公司简介
- Activision Blizzard
- Amazon
- Bandai Namco
- Bioworld Merchandising
- Capcom Store
- Electronic Arts(EA)
- Etsy Sellers
- Fanatics, Inc.
- Fangamer
- Funko, Inc.
- Gamerabilia
- GameStop Corp.
- Insert Coin Clothing
- Hasbro, Inc.
- Hot Topic, Inc.
- J!NX, LLC
- LEGO Group
- Logitech G
- Loot Crate, LLC
- Microsoft Gaming
- NetEase
- Nintendo
- Numskull Designs
- Razer
- Sony Interactive Entertainment
- Square Enix Store
- SteelSeries
- Take-Two Interactive
- Tencent Holdings
- Ubisoft
The Global Gaming Merchandise Market was valued at USD 31.7 billion in 2025 and is estimated to grow at a CAGR of 20.5% to reach USD 197.6 billion by 2035.
This sharp growth reflects the steady enlargement of the global gaming audience and the deeper cultural influence of gaming entertainment worldwide. As gaming continues to integrate into everyday lifestyles, consumer engagement increasingly extends beyond interactive experiences into the purchase of branded physical products. Merchandise has become a key channel through which fans express personal identity, brand affinity, and long-term loyalty. The growing acceptance of gaming across age groups and geographies is driving demand for lifestyle-oriented products associated with well-known game brands. As the gaming ecosystem matures, merchandise purchasing behavior is evolving into a mainstream consumer trend rather than a niche activity. Rising fan communities, increased digital exposure, and stronger emotional attachment to game universes are supporting sustained demand. This momentum is transforming gaming merchandise into a high-growth consumer category, supported by continuous innovation, broader distribution, and expanding global reach.
| Market Scope | |
|---|---|
| Start Year | 2025 |
| Forecast Year | 2026-2035 |
| Start Value | $31.7 Billion |
| Forecast Value | $197.6 Billion |
| CAGR | 20.5% |
The apparel category accounted for 39.1% share in 2025, making it the largest product segment. Demand is being driven by strong interest in branded clothing and lifestyle wear associated with gaming culture. Fashion-forward designs, brand visibility, and wider retail accessibility continue to support adoption, reinforcing apparel's leading position within the market.
The mid-range price segment generated USD 15.7 billion in 2025. This segment benefits from offering an optimal balance between cost and perceived quality, appealing to a broad consumer base. Products in this range align well with mainstream purchasing behavior, supporting consistent sales volumes across multiple merchandise categories.
North America Gaming Merchandise Market represented 35.5% share in 2025, positioning it as the leading regional market. Strong consumer engagement, established digital commerce channels, and high brand awareness are driving demand. The region continues to see strong interest in branded merchandise that reflects gaming-related lifestyle preferences.
Key companies active in the Global Gaming Merchandise Market include Nintendo, Funko, Sony Interactive Entertainment, Microsoft Gaming, Bandai Namco, Fanatics, Inc., Ubisoft, LEGO Group, Activision Blizzard, Hasbro, Inc., Razer, Logitech G, Square Enix Store, NetEase, Electronic Arts, Take-Two Interactive, Tencent Holdings, SteelSeries, GameStop Corp., Hot Topic, Inc., Insert Coin Clothing, Fangamer, Loot Crate, LLC, Numskull Designs, J!NX, LLC, Bioworld Merchandising, Capcom Store, Gamerabilia, Amazon, and independent Etsy sellers. Companies operating in the Global Gaming Merchandise Market are strengthening their positions through brand partnerships, diversified product lines, and direct-to-consumer sales strategies. Many players are focusing on limited-edition releases and exclusive collections to increase brand value and customer engagement. Expanding e-commerce capabilities and leveraging global distribution networks remain central priorities. Collaborations with designers and content creators are used to align merchandise with evolving consumer tastes. Firms are also investing in data-driven marketing to understand fan preferences and optimize product launches.
Table of Contents
Chapter 1 Methodology and Scope
- 1.1 Market scope and definition
- 1.2 Research design
- 1.2.1 Research approach
- 1.2.2 Data collection methods
- 1.3 Data mining sources
- 1.3.1 Global
- 1.3.2 Regional/Country
- 1.4 Base estimates and calculations
- 1.4.1 Base year calculation
- 1.4.2 Key trends for market estimation
- 1.5 Primary research and validation
- 1.5.1 Primary sources
- 1.6 Forecast model
- 1.7 Research assumptions and limitations
Chapter 2 Executive Summary
- 2.1 Industry snapshot
- 2.2 Key market trends
- 2.2.1 Products trends
- 2.2.2 Price Range trends
- 2.2.3 Distribution trends
- 2.2.4 Regional
- 2.3 TAM Analysis, 2026-2035 (USD Billion)
- 2.4 CXO perspectives: Strategic imperatives
- 2.4.1 Executive decision points
- 2.4.2 critical success factors
- 2.5 Future outlook and strategic recommendations
Chapter 3 Industry Insights
- 3.1 Industry ecosystem analysis
- 3.1.1 Supplier landscape
- 3.1.2 Profit margin
- 3.1.3 Cost structure
- 3.1.4 Value addition at each stage
- 3.1.5 Factor affecting the value chain
- 3.1.6 Disruptions
- 3.2 Industry impact forces
- 3.2.1 Growth drivers
- 3.2.1.1 Rapid growth of global gaming communities across PC, console, and mobile platforms.
- 3.2.1.2 Expansion of esports leagues and live gaming events
- 3.2.1.3 Strong fan engagement with game franchises is increasing demand for licensed and limited-edition products.
- 3.2.1.4 Rising influence of streamers and gaming influencers is accelerating merchandise visibility and direct-to-consumer sales.
- 3.2.1.5 Growth of e-commerce and online marketplaces is improving global accessibility to gaming merchandise.
- 3.2.2 Industry pitfalls and challenges
- 3.2.2.1 High licensing and royalty costs.
- 3.2.2.2 Limited retail presence in emerging markets restricts offline merchandise sales.
- 3.2.3 Market opportunities
- 3.2.4 Integration of gaming merchandise with fashion and lifestyle brands.
- 3.2.5 Rising demand for sustainable and eco-friendly gaming apparel presents differentiation opportunities.
- 3.2.1 Growth drivers
- 3.3 Growth potential analysis
- 3.4 Regulatory landscape
- 3.4.1 North America
- 3.4.2 Europe
- 3.4.3 Asia Pacific
- 3.4.4 Latin America
- 3.4.5 Middle East & Africa
- 3.5 Porter';s analysis
- 3.6 PESTEL analysis
- 3.7 Technology and innovation landscape
- 3.7.1 Current technological trends
- 3.7.2 Emerging technologies
- 3.8 Price trends
- 3.8.1 Historical price analysis (2022-2024)
- 3.8.2 Price trend drivers
- 3.8.3 Regional price variations
- 3.8.4 Price forecast (2026-2035)
- 3.9 Pricing strategies
- 3.10 Emerging business models
- 3.11 Compliance requirements
- 3.12 Sustainability measures
- 3.12.1 Sustainable materials assessment
- 3.12.2 Carbon footprint analysis
- 3.12.3 Circular economy implementation
- 3.12.4 Sustainability certifications and standards
- 3.12.5 Sustainability roi analysis
- 3.13 Global consumer sentiment analysis
- 3.14 Patent analysis
Chapter 4 Competitive Landscape, 2025
- 4.1 Introduction
- 4.2 Company market share analysis
- 4.2.1 By region
- 4.2.1.1 North America
- 4.2.1.2 Europe
- 4.2.1.3 Asia Pacific
- 4.2.1.4 Latin America
- 4.2.1.5 Middle East & Africa
- 4.2.2 Market Concentration Analysis
- 4.2.1 By region
- 4.3 Competitive benchmarking of key players
- 4.3.1 Financial performance comparison
- 4.3.1.1 Revenue
- 4.3.1.2 Profit margin
- 4.3.1.3 R&D
- 4.3.2 Product portfolio comparison
- 4.3.2.1 Product range breadth
- 4.3.2.2 Technology
- 4.3.2.3 Innovation
- 4.3.3 Geographic presence comparison
- 4.3.3.1 Global footprint analysis
- 4.3.3.2 Service network coverage
- 4.3.3.3 Market penetration by region
- 4.3.4 Competitive positioning matrix
- 4.3.4.1 Leaders
- 4.3.4.2 Challengers
- 4.3.4.3 Followers
- 4.3.4.4 Niche players
- 4.3.5 Strategic outlook matrix
- 4.3.1 Financial performance comparison
- 4.4 Key developments, 2022-2025
- 4.4.1 Mergers and acquisitions
- 4.4.2 Partnerships and collaborations
- 4.4.3 Technological advancements
- 4.4.4 Expansion and investment strategies
- 4.4.5 Sustainability initiatives
- 4.4.6 Digital transformation initiatives
- 4.5 Emerging/ startup competitors landscape
Chapter 5 Market Estimates & Forecast, By Product, 2022 - 2035 (USD Billion)
- 5.1 Key trends,
- 5.2 Apparel
- 5.3 Accessories
- 5.4 Collectibles
- 5.5 Gaming Peripherals
- 5.6 Home Decor
- 5.7 Others
Chapter 6 Market Estimates and Forecast, By Price Range, 2022 - 2035 (USD Billion)
- 6.1 Key trends
- 6.2 High-end
- 6.3 Mid-range
- 6.4 Low-cost
Chapter 7 Market Estimates & Forecast, By Distribution Channel, 2022 - 2035 (USD Billion)
- 7.1 Key trends
- 7.2 Online
- 7.3 Offline
Chapter 8 Market Estimates & Forecast, By Region, 2022 - 2035 (USD Billion)
- 8.1 Key trends, by region
- 8.2 North America
- 8.2.1 U.S.
- 8.2.2 Canada
- 8.3 Europe
- 8.3.1 UK
- 8.3.2 Germany
- 8.3.3 France
- 8.3.4 Italy
- 8.3.5 Spain
- 8.3.6 Russia
- 8.3.7 Rest of Europe
- 8.4 Asia-Pacific
- 8.4.1 China
- 8.4.2 India
- 8.4.3 Japan
- 8.4.4 South Korea
- 8.4.5 ANZ
- 8.4.6 Rest of Asia-Pacific
- 8.5 Latin America
- 8.5.1 Brazil
- 8.5.2 Mexico
- 8.5.3 Argentina
- 8.5.3 Rest of Latin America
- 8.6 MEA
- 8.6.1 Saudi Arabia
- 8.6.2 South Africa
- 8.6.3 UAE
- 8.6.4 Rest of MEA
Chapter 9 Company Profiles
- 9.1 Activision Blizzard
- 9.2 Amazon
- 9.3 Bandai Namco
- 9.4 Bioworld Merchandising
- 9.5 Capcom Store
- 9.6 Electronic Arts (EA)
- 9.7 Etsy Sellers
- 9.8 Fanatics, Inc.
- 9.9 Fangamer
- 9.10 Funko, Inc.
- 9.11 Gamerabilia
- 9.12 GameStop Corp.
- 9.13 Insert Coin Clothing
- 9.14 Hasbro, Inc.
- 9.15 Hot Topic, Inc.
- 9.16 J!NX, LLC
- 9.17 LEGO Group
- 9.18 Logitech G
- 9.19 Loot Crate, LLC
- 9.20 Microsoft Gaming
- 9.21 NetEase
- 9.22 Nintendo
- 9.23 Numskull Designs
- 9.24 Razer
- 9.25 Sony Interactive Entertainment
- 9.26 Square Enix Store
- 9.27 SteelSeries
- 9.28 Take-Two Interactive
- 9.29 Tencent Holdings
- 9.30 Ubisoft


