


 |
市场调查报告书
商品编码
1936559
中空玻璃微球市场机会、成长要素、产业趋势分析及预测(2026年至2035年)Hollow Glass Microspheres Market Opportunity, Growth Drivers, Industry Trend Analysis, and Forecast 2026 - 2035 |
||||||
全球空心玻璃微球市场预计到 2025 年将达到 25 亿美元,预计到 2035 年将达到 38 亿美元,年复合成长率为 4.4%。
汽车和工业领域日益严格的燃油效率和排放气体法规推动了市场成长。中空玻璃微球有助于减轻产品重量,从而提高车辆的燃油效率,并在其他应用中实现节能。在北美和欧洲,严格的二氧化碳法规和净零排放倡议正在加速汽车製造商和材料供应商用轻质微球替代传统矿物填充材。建筑和基础设施产业也做出了显着贡献,更严格的建筑能效法规推动了微球在保温板、涂料和密封剂中的应用,这些材料在不增加重量的情况下改善了热管理性能。油漆、涂料和聚合物产业也越来越多地采用微球来降低挥发性有机化合物(VOC)含量、改善隔音效果,并实现轻质高性能产品。
| 市场覆盖范围 | |
|---|---|
| 开始年份 | 2025 |
| 预测年份 | 2026-2035 |
| 起始值 | 25亿美元 |
| 预测金额 | 38亿美元 |
| 复合年增长率 | 4.4% |
预计到2025年,涂层中空玻璃微球市场份额将达到54%,并在2035年之前以4.6%的复合年增长率成长。製造商正从简单地供应预涂层微球转向为环氧树脂、聚氨酯、聚烯和特殊涂料等终端应用系统提供客製化解决方案。银和镍涂层主要用于提高导电性和电磁干扰屏蔽性能,而铝和二氧化钛涂层则可增强反射率和光学阻隔性能。客製化涂层使配方师能够探索具有高技术潜力和性能要求的细分应用领域。
涂料和油漆领域占市场份额的27%,预计到2035年将以4.8%的复合年增长率成长。中空玻璃微球可提高隔热和隔音性能,同时降低产品密度,进而提高建筑和运输业的能源效率。汽车和基础设施产业的终端用户重视这些优势,因为它们有助于节省燃料、提高营运效率并符合不断变化的环境标准。
预计2034年,北美中空玻璃微球市场规模将达到11.9亿美元。该地区市场成长的主要驱动力来自汽车行业的轻量化措施、节能建材以及复合材料在工业和商业领域的成熟应用。美国是核心需求中心,航太、汽车、建筑涂料以及石油天然气等产业推动了微球在合成泡沫、先进复合材料和高性能隔热材料复合材料等领域的应用。强大的原始设备製造商(OEM)实力、不断升级的工业基础设施以及成熟的复合材料製造体系,巩固了北美在该市场的主导地位。
目录
第一章调查方法和范围
第二章执行摘要
第三章业界考察
- 生态系分析
- 供应商情况
- 利润率
- 每个阶段的附加价值
- 影响价值链的因素
- 中断
- 产业影响因素
- 司机
- 汽车和运输业的减重
- 节能隔热建筑的需求
- 先进复合材料与3D列印技术的发展
- 产业潜在风险与挑战
- 与传统矿物填料相比,高成本
- 加工挑战和研磨敏感性
- 市场机会
- 电动车、航太和船舶领域的扩张
- 用于医疗、牙科和专用设备
- 司机
- 成长潜力分析
- 监管环境
- 北美洲
- 欧洲
- 亚太地区
- 拉丁美洲
- 中东和非洲
- 波特五力分析
- PESTEL 分析
- 价格趋势
- 按地区
- 依产品类型
- 未来市场趋势
- 科技与创新趋势
- 当前技术趋势
- 新兴技术
- 专利状态
- 贸易统计(HS编码)(註:仅提供主要国家的贸易统计)
- 主要进口国
- 主要出口国
- 永续性和环境方面
- 永续努力
- 减少废弃物策略
- 生产中的能源效率
- 环保倡议
- 考虑到碳足迹
第四章 竞争情势
- 介绍
- 公司市占率分析
- 按地区
- 北美洲
- 欧洲
- 亚太地区
- 拉丁美洲
- 中东和非洲
- 按地区
- 企业矩阵分析
- 主要市场公司的竞争分析
- 竞争定位矩阵
- 重大进展
- 併购
- 伙伴关係与合作
- 新产品发布
- 业务拓展计划
第五章 依产品类型分類的市场估算与预测,2022-2035年
- 未包覆的中空玻璃微球
- 涂层中空玻璃微球
- 镀银中空玻璃微球
- 镀镍中空玻璃微球
- 铝涂层中空玻璃微球
- 二氧化钛包覆的中空玻璃微球
- 其他涂层中空玻璃微球
第六章 按应用领域分類的市场估算与预测,2022-2035年
- 油漆和涂料
- 工业涂料
- 船舶及防护涂料
- 汽车修补漆和原厂喷漆
- 建筑和装饰涂料
- 塑胶、复合材料和橡胶
- 热塑性复合材料
- 热固性复合材料(环氧树脂、聚酯树脂)
- 弹性体和橡胶製品
- 3D列印和特种塑料
- 运输
- 汽车(内装、车身面板)
- 航太航天零件
- 铁路和船舶结构
- 商用车和卡车零件
- 隔热和浮力
- 保温板和发泡体
- 海洋和水下浮力模组
- 管道和储罐隔热材料
- 低温/LNG隔热系统
- 卫生保健
- 医疗设备及组件
- 牙科材料和水泥
- 药物输送和缓释系统
- 整形外科和义肢材料
- 其他(用途)
第七章 2022-2035年各地区市场估算与预测
- 北美洲
- 我们
- 加拿大
- 欧洲
- 德国
- 英国
- 法国
- 西班牙
- 义大利
- 其他欧洲地区
- 亚太地区
- 中国
- 印度
- 日本
- 澳洲
- 韩国
- 亚太其他地区
- 拉丁美洲
- 巴西
- 墨西哥
- 阿根廷
- 其他拉丁美洲地区
- 中东和非洲
- 沙乌地阿拉伯
- 南非
- 阿拉伯聯合大公国
- 其他中东和非洲地区
第八章:公司简介
- Polysciences, Inc
- Sovitec
- Nova Instruments LLC
- Mo-Sci Corporation
- Geocon Products
- Kish Company Inc
- Cenostar Corporation
- Dennert Poraver Gmbh
- Ceno Technologies
- Potters Industries LLC
- Trelleborg AB
- Cospheric LLC
- 3M Company
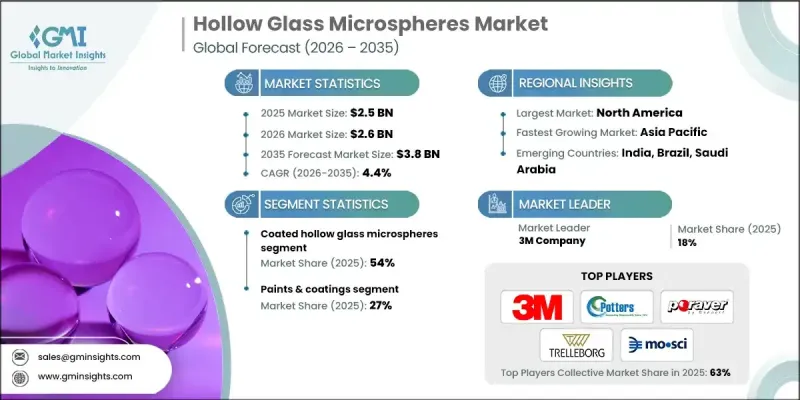
The Global Hollow Glass Microspheres Market was valued at USD 2.5 billion in 2025 and is estimated to grow at a CAGR of 4.4% to reach USD 3.8 billion by 2035.
Market growth is driven by increasing pressure from fuel efficiency and emissions regulations across the automotive and industrial sectors. Hollow glass microspheres help reduce product weight, enhancing fuel efficiency in vehicles and promoting energy savings in other applications. In North America and Europe, stringent CO2 regulations and net-zero initiatives have motivated vehicle manufacturers and material suppliers to replace traditional mineral fillers with lightweight microspheres. The construction and infrastructure sectors have also contributed significantly, as stricter building energy efficiency regulations encourage the use of microspheres in insulation panels, coatings, and sealants to improve thermal regulation without adding weight. Paints, coatings, and polymer industries are increasingly using microspheres to reduce VOC content, improve acoustic insulation, and produce lightweight, high-performance products across applications.
| Market Scope | |
|---|---|
| Start Year | 2025 |
| Forecast Year | 2026-2035 |
| Start Value | $2.5 Billion |
| Forecast Value | $3.8 Billion |
| CAGR | 4.4% |
The coated hollow glass microspheres segment accounted for 54% share in 2025 and is expected to grow at a CAGR of 4.6% through 2035. Manufacturers are increasingly shifting from simply supplying coated microspheres to providing tailored solutions for end-use systems such as epoxy, polyurethane, polyolefin, and specialty-coated applications. Silver and nickel coatings are primarily targeted at electroconductive and EMI-shielding functions, while aluminum and titanium dioxide coatings enhance reflectivity and optical barrier properties. Custom coatings enable formulators to explore niche applications with high technological potential and performance requirements.
The paints and coatings segment held 27% share and is projected to grow at a CAGR of 4.8% by 2035. Hollow glass microspheres reduce product density while improving thermal and acoustic insulation, driving energy efficiency in construction and transport applications. End-users in automotive and infrastructure value these benefits for fuel savings, operational efficiency, and compliance with evolving environmental standards.
North America Hollow Glass Microspheres Market is estimated to reach USD 1.19 billion in 2034. Market growth in the region is fueled by lightweighting initiatives in automotive and energy-efficient building materials, as well as the established use of composites in industrial and commercial sectors. The U.S. serves as the core demand hub, with sectors including aerospace, automotive, construction coatings, and oil & gas driving microsphere adoption for syntactic foams, advanced composites, and high-performance insulation applications. Strong OEM presence, retrofitting of industrial infrastructure, and established composite manufacturing contribute to North America's leading market position.
Key players in the Global Hollow Glass Microspheres Market include Polysciences, Inc, Sovitec, Nova Instruments LLC, Mo-Sci Corporation, Geocon Products, Kish Company Inc, Cenostar Corporation, Dennert Poraver GmbH, Ceno Technologies, Potters Industries LLC, Trelleborg AB, Cospheric LLC, and 3M Company. Companies in the hollow glass microspheres market are employing several strategies to expand their footprint and strengthen market positioning. These include investing heavily in R&D to develop customized microspheres with specialized coatings for specific applications such as EMI shielding, reflectivity, and insulation. Manufacturers are forming strategic partnerships with polymer, automotive, and construction companies to integrate microspheres into advanced formulations. Market players are also expanding geographically to target emerging regions and leveraging digital marketing and technical service support to improve client engagement.
Table of Contents
Chapter 1 Methodology & Scope
- 1.1 Market scope and definition
- 1.2 Research design
- 1.2.1 Research approach
- 1.2.2 Data collection methods
- 1.3 Data mining sources
- 1.3.1 Global
- 1.3.2 Regional/Country
- 1.4 Base estimates and calculations
- 1.4.1 Base year calculation
- 1.4.2 Key trends for market estimation
- 1.5 Primary research and validation
- 1.5.1 Primary sources
- 1.6 Forecast model
- 1.7 Research assumptions and limitations
Chapter 2 Executive Summary
- 2.1 Industry 360° synopsis
- 2.2 Key market trends
- 2.2.1 Regional
- 2.2.2 Product Type
- 2.2.3 Application
- 2.3 TAM Analysis, 2026-2035
- 2.4 CXO perspectives: Strategic imperatives
- 2.4.1 Executive decision points
- 2.4.2 Critical success factors
- 2.5 Future Outlook and Strategic Recommendations
Chapter 3 Industry Insights
- 3.1 Industry ecosystem analysis
- 3.1.1 Supplier landscape
- 3.1.2 Profit margin
- 3.1.3 Value addition at each stage
- 3.1.4 Factor affecting the value chain
- 3.1.5 Disruptions
- 3.2 Industry impact forces
- 3.2.1 Growth drivers
- 3.2.1.1 Lightweighting in automotive and transportation
- 3.2.1.2 Demand for energy-efficient, insulated buildings
- 3.2.1.3 Growth of advanced composites and 3D printing
- 3.2.2 Industry pitfalls and challenges
- 3.2.2.1 Higher cost versus conventional mineral fillers
- 3.2.2.2 Processing challenges and crush sensitivity
- 3.2.3 Market opportunities
- 3.2.3.1 Expansion in EVs, aerospace and marine sectors
- 3.2.3.2 Use in medical, dental and specialty devices
- 3.2.1 Growth drivers
- 3.3 Growth potential analysis
- 3.4 Regulatory landscape
- 3.4.1 North America
- 3.4.2 Europe
- 3.4.3 Asia Pacific
- 3.4.4 Latin America
- 3.4.5 Middle East & Africa
- 3.5 Porter's analysis
- 3.6 PESTEL analysis
- 3.7 Price trends
- 3.7.1 By region
- 3.7.2 By Product type
- 3.8 Future market trends
- 3.9 Technology and Innovation landscape
- 3.9.1 Current technological trends
- 3.9.2 Emerging technologies
- 3.10 Patent Landscape
- 3.11 Trade statistics (HS code)( Note: the trade statistics will be provided for key countries only)
- 3.11.1 Major importing countries
- 3.11.2 Major exporting countries
- 3.12 Sustainability and environmental aspects
- 3.12.1 Sustainable practices
- 3.12.2 Waste reduction strategies
- 3.12.3 Energy efficiency in production
- 3.12.4 Eco-friendly initiatives
- 3.13 Carbon footprint consideration
Chapter 4 Competitive Landscape, 2025
- 4.1 Introduction
- 4.2 Company market share analysis
- 4.2.1 By region
- 4.2.1.1 North America
- 4.2.1.2 Europe
- 4.2.1.3 Asia Pacific
- 4.2.1.4 LATAM
- 4.2.1.5 MEA
- 4.2.1 By region
- 4.3 Company matrix analysis
- 4.4 Competitive analysis of major market players
- 4.5 Competitive positioning matrix
- 4.6 Key developments
- 4.6.1 Mergers & acquisitions
- 4.6.2 Partnerships & collaborations
- 4.6.3 New Product Launches
- 4.6.4 Expansion Plans
Chapter 5 Market Estimates and Forecast, By Product Type, 2022-2035 (USD Billion) (Kilo Tons)
- 5.1 Key trends
- 5.2 Uncoated hollow glass microspheres
- 5.3 Coated hollow glass microspheres
- 5.3.1 Silver-coated hollow glass microspheres
- 5.3.2 Nickel-coated hollow glass microspheres
- 5.3.3 Aluminum-coated hollow glass microspheres
- 5.3.4 Titanium dioxide-coated hollow glass microspheres
- 5.3.5 Other coated hollow glass microspheres
Chapter 6 Market Estimates and Forecast, By Application, 2022-2035 (USD Billion) (Kilo Tons)
- 6.1 Key trends
- 6.2 Paints & coatings
- 6.2.1 Industrial coatings
- 6.2.2 Marine and protective coatings
- 6.2.3 Automotive refinish and OEM coatings
- 6.2.4 Architectural and decorative paints
- 6.3 Plastics, composites & rubber
- 6.3.1 Thermoplastic composites
- 6.3.2 Thermoset composites (epoxy, polyester)
- 6.3.3 Elastomers and rubber products
- 6.3.4 3D printing and specialty plastics
- 6.4 Transportation
- 6.4.1 Automotive (interiors, body panels)
- 6.4.2 Aerospace and aviation components
- 6.4.3 Rail and marine structures
- 6.4.4 Commercial vehicle and truck parts
- 6.5 Insulation and buoyancy
- 6.5.1 Thermal insulation panels and foams
- 6.5.2 Buoyancy modules for offshore and subsea
- 6.5.3 Pipeline and tank insulation
- 6.5.4 Cryogenic and LNG insulation systems
- 6.6 Healthcare
- 6.6.1 Medical devices and components
- 6.6.2 Dental materials and cements
- 6.6.3 Drug delivery and controlled-release systems
- 6.6.4 Orthopedic and prosthetic composites
- 6.7 Others (applications)
Chapter 7 Market Estimates and Forecast, By Region, 2022-2035 (USD Billion) (Kilo Tons)
- 7.1 Key trends
- 7.2 North America
- 7.2.1 U.S.
- 7.2.2 Canada
- 7.3 Europe
- 7.3.1 Germany
- 7.3.2 UK
- 7.3.3 France
- 7.3.4 Spain
- 7.3.5 Italy
- 7.3.6 Rest of Europe
- 7.4 Asia Pacific
- 7.4.1 China
- 7.4.2 India
- 7.4.3 Japan
- 7.4.4 Australia
- 7.4.5 South Korea
- 7.4.6 Rest of Asia Pacific
- 7.5 Latin America
- 7.5.1 Brazil
- 7.5.2 Mexico
- 7.5.3 Argentina
- 7.5.4 Rest of Latin America
- 7.6 Middle East and Africa
- 7.6.1 Saudi Arabia
- 7.6.2 South Africa
- 7.6.3 UAE
- 7.6.4 Rest of Middle East and Africa
Chapter 8 Company Profiles
- 8.1 Polysciences, Inc
- 8.2 Sovitec
- 8.3 Nova Instruments LLC
- 8.4 Mo-Sci Corporation
- 8.5 Geocon Products
- 8.6 Kish Company Inc
- 8.7 Cenostar Corporation
- 8.8 Dennert Poraver Gmbh
- 8.9 Ceno Technologies
- 8.10 Potters Industries LLC
- 8.11 Trelleborg AB
- 8.12 Cospheric LLC
- 8.13 3M Company
 2026-2034年全球发泡聚合物微球市场规模、份额、趋势与成长分析报告
 微球市场规模、份额及成长分析(按产品、材料、应用及地区划分)-2026-2033年产业预测
 可膨胀微球:全球市场份额和排名、总收入和需求预测(2025-2031年)
 微球市场(按材料、类型和分销管道)—2025-2032 年全球预测
 微球市场-全球产业规模、份额、趋势、机会及预测,依原料、应用、区域及竞争状况细分,2020-2030 年
 全球金属微球市场
 聚合物微球:市场份额分析、产业趋势、统计和成长预测(2025-2030)
 中空微球市场:2025-2029 年全球市场全球糖球市场规模(按产品、应用、地区、范围和预测)
 化妆品微球市场报告:2031 年趋势、预测与竞争分析